An alternative method for measuring
the index profile of a gradient-index lens
H. C. Hsieh, W. C. Wu, W. Y. Chang, F. S. Hsu, and D. C. Su
*Department of Photonics and Institute of Electro-Optical Engineering,
National Chiao-Tung University, 1001 University Road, Hsinchu 30010, Taiwan, ROC
ABSTRACT
An alternative method for measuring the index profile of the GRIN lens is proposed based on Fresnel’s equations and the common-path phase-shifting interfermetry. A light beam composing of the right- and the left- circularly polarized components is obliquely incident on the tested GRIN lens and the reflected light passes through an analyzer. The light is collected and imaged by an imaging lens to a CMOS camera. Four interferograms under different additional phases are taken and Carre’s phase-shifting method is used to calculate the full-field phase distribution. Next, the estimated data are substituted into the special equations derived from the Fresnel’s equations, and the index profile of the GRIN lens can be obtained. Its validity has been demonstrated. It has both merits of the common-path interferemetry and the phase-shifting interferemetry.
Keywords: Circularly polarized light, full-field measurement, refractive index, GRIN lens, electro-optic modulator
1. INTRODUCTION
The gradient index (GRIN) lenses have many applications in wide field such as copying machines, optical scanners, and fiber optics light coupling systems. To enhance their quality and performance, it is necessary to measure the refractive index distribution of a GRIN lens accurately. Although several techniques [1-5] have been proposed for measuring refractive index, almost all of them are suitable only for one-point measurement. To overcome this drawback, an alternative method for measuring the full-field refractive index distribution of a GRIN lens is presented in this paper based on Fresnel equations [6] and the phase-shifting interferometry [7,8]. A light beam composing of the right- and the left- circularly polarized components is used, and an additional phase difference between these two components is introduced by an electro-optic modulator. The light beam is obliquely incident on the tested GRIN lens and the reflected light passes through an analyzer. The interferograms are collected and imaged by a set of imaging lenses to a CMOS camera. Four interferograms under different additional phases are taken and Carre’s phase-shifting method [9] is used to calculate the full-field phase distribution. Next, the estimated data are substituted into the special equations derived from the Fresnel’s equations, and the index profile of the GRIN lens can be obtained. The validity of this method is demonstrated. It has both merits of the common-path interferemetry [10] and the phase-shifting interferemetry [9], that is, high stability, simple configuration, easy operation, and high resolution.
2. PRINCIPLE
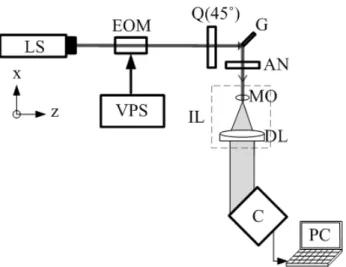
The optical configuration of this method is shown in Fig. 1. For convenience, the z-axis is chosen along the light propagation direction, and the y-axis is along the vertical direction. After a linearly polarized light at 45° to the x-axis passes through an electro-optical modulator (EOM) driven by a voltage power supply (VPS) and a quarter-wave plate (Q) with the fast axis at 45° to the x-axis, its Jones vector can be expressed as [11]
Fig. 1 The optical configuration of this method. LS: Laser; EOM: electro-optic modulator; VPS: voltage power supply; Q: quarter-wave plate; G: GRIN Lens; AN: analyzer; IL: imaging lens; MO: microscopic objective; DL: doublet; C: CMOS camera. ' (45 ) ( ) E =Q ° EOM Γ E 2 2 1 0 1 1 1 1 1 2 2 0 i i i e i e Γ Γ − ⎛ ⎞ ⎛ ⎞⎜ ⎟ ⎛ ⎞ = ⎜ ⎟⎜ ⎟ ⎜ ⎟ ⎝ ⎠⎜ ⎟ ⎝ ⎠ ⎝ ⎠ 2 2 1 1 1 1 2 2 i i i e e i Γ −Γ ⎛ ⎞ ⎛ ⎞ = ⎜ ⎟ + ⎜ ⎟ ⎝ ⎠ ⎝ ⎠ , (1)
where Q and EOM are the Jones matrices of the Q and the EOM; E is the Jones vector of the incident light. From Eq. (1), it can be seen that there is an additional phase difference Γ between the right- and the left- circular polarizations. Here,
Γ is introduced by the EOM which acts a phase-shifter. The light is incident at 45° on the tested GRIN lens (G) with the refractive index distribution ( , )n x y . The reflected light passes through an analyzer (AN) with the transmission axis at 45° to the x-axis. The AN makes the orthogonally polarized components of the light to interfere each other, and an imaging lens (IL) is used to image the surface of the G onto the image plane of the CMOS camera (C). Consequently, the light at the C can be derived as
( )
2 2 2 2 2 2 45 ' 0 cos 45 sin 45 cos 45 10 2
sin 45 cos 45 sin 45
C i i p i i s E AN GE r e ie r ie e Γ −Γ Γ −Γ = ° ⎛ ⎞ + ⎛ ° ° ° ⎛⎞ ⎞ ⎜ ⎟ = ⎜ ° ° ° ⎟⎜ ⎟ ⎜ ⎟ ⎝ ⎠ ⎝ ⎠ ⎜ + ⎟ ⎝ ⎠ 2 2 2 2 2 2 2 2 1 4 i i i i i i i i r e ie r ie e r e ie r ie e Γ −Γ Γ −Γ Γ −Γ Γ −Γ ⎛ ⎛ ⎞ ⎛ ⎞⎞ + + + ⎜ ⎜ ⎟ ⎜ ⎟⎟ ⎜ ⎝ ⎠ ⎝ ⎠⎟ = ⎜ ⎛ ⎞ ⎛ ⎞⎟ ⎜ ⎜ + ⎟+ ⎜ + ⎟⎟ ⎜ ⎝ ⎠ ⎝ ⎠⎟ ⎝ ⎠ p s p s , (2)
where
AN
andG
are the Jones matrices of the AN and the G, respectively.r
s andr
p are the amplitude reflection coefficients of the G, and they can be written as2 2 2 2 sin 45 cos 45 sin 45 cos 45 p n n n r n n n − ° ° − = − ° ° + , (3) and 2 2 2 2 cos 45 sin 45 cos 45 sin 45 s n r n ° − − ° = ° + − ° . (4)
Hence, the intensity of the interference signal recorded by the C can be written as 2 C I= E 0(1 cos( )) I γ φ = + Γ + , (5) where
(
2 2)
0 1 4 p s I = r +r ; (6) and 0 1/ I γ = . (7)φ is the phase of the interference signal, and it can be expressed as 2 1 2 2 1 ( , ) tan 1 n x y n φ = − ⎛⎜ − ⎞⎟ ⎜ − ⎟ ⎝ ⎠. (8)
It also can be rewritten as
2 sec sec ( , ) tan n x y φ φ φ − = . (9)
It is obvious from Eq. (7) that ( , )n x y can be calculated with the measurement of ( , )φ x y .
Next, Carre’s phase-shifting interferometric technique, in which the EOM acts as a phase-shifter, is applied to measure ( , )φ x y . If the voltage Vi coming from the VPS is applied to the EOM, then the Γ can be expressed as [12]
(V Vi 0) Vπ π − Γ =
Va Vπ π = , (10)
where V0 is the extinction bias voltage and Vπ is the half-wave voltage. Hence, Eq. (5) can be rewritten as I x y( , )=I0[1 cos(+ Γ +φ( , ))]x y
If I1, I2, I3, and I4 are the interference intensities as Va as equals to 3 / 2− V , −V/ 2, / 2V , and 3 / 2V , respectively, then we have 1 4 2 3 2 3 1 4 1 2 3 1 4 [( ) ( )][3( ) ( )] ( , ) tan ( ) ( ) I I I I I I I I x y I I I I φ = − − + − − − − + − + . (12)
Consequently, the estimated data ( , )φ x y are substituted into Eq. (7), and the full-field refractive index distribution ( , )
n x y of the GRIN lens can be obtained.
3. EXPERIMENTS AND RESULTS
In order to show the feasibility of this method, a GRIN lens (AC Photonics, Inc./ ALC-18) with a diameter of 1.8mm was tested. An He-Ne laser with a wavelength of 632.8 nm and the EOM (New Focus/Model 4002) with
148V
Vπ = were used. A CMOS camera (Baslar/A504K) with 256 gray levels and 680×680 pixels was used to recorded
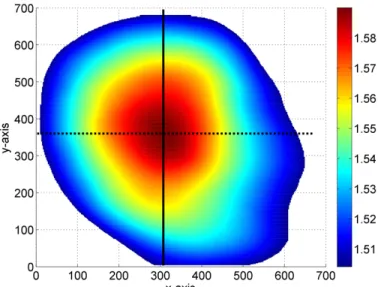
the four interferograms under the conditions Va = -120 V, -40 V, 40 V, and 120 V. The interferograms were sent into a personal computer, and they were analyzed with the software Matlab (MathWorks Inc.). The measured results ( , )φ x y
were substituted into Eq. (7) to estimate the n(x,y). For easier reading, n(x,y) is displayed in color as shown in Fig. 2 and the associated refractive index contour was also depicted in Fig. 3. The refractive index profiles along the horizontal and vertical black lines in Fig. 2 were depicted as the solid and dash lines in Fig. 4, respectively.
Fig. 3 Refractive index contour of the GRIN Lens.
Fig. 4 The refractive index profiles along the x-axis (dash line) and the y-axis (solid line).
4. DISCUSSION From Eq. (7), we have
n n φ φ ∂ Δ = Δ ∂
(
)
2 4 2 4 4 2cot cot 1 cot csc
1 cot 1 cot csc φ φ φ φ φ φ φ φ − − = Δ − − + , (13)
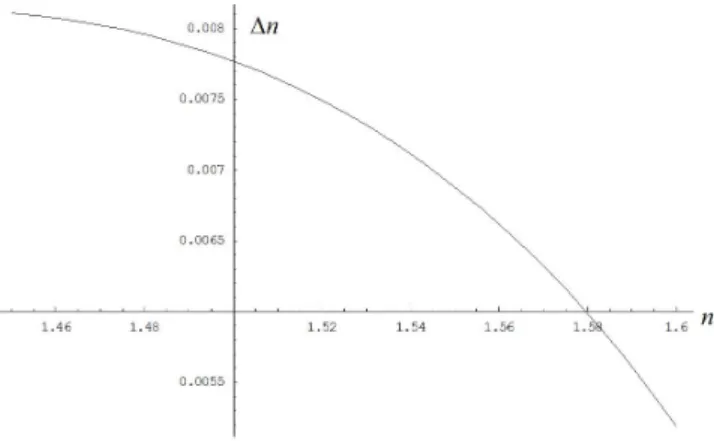
where nΔ and Δφ represent the errors in n and φ . The error φΔ may be influenced by the phase-resolution of the phase-shifting interferometry and the polarization-mixing error [13]. The former is about360 1.406
256 °
= ° . The latter is about 0.028°, which is derived from the extinction ratio 1 10× −3of the polarizer (Newport Inc.). So, the total error of Δφ is 1.43°. Consequently, substituting the experimental error Δ =φ 1.43° into Eq. (11), the relation curve of nΔ versus n can be calculated and depicted in Fig. 5. It can be seen that nΔ can be reduced to 0.005 asn=1.6.
To collect the reflected parallel beam from the GRIN lens and magnify the object simultaneously, it is better to use the imaging lens IL composed of a microscopic objective (MO) and a doublet (DL). Because the IL is an afocal optical system, the GRIN lens needs to be located in the front focal plane of the MO obliquely and the image plane of the CMOS camera should be correspondingly located in the rear focal plane of the DL obliquely. The transverse magnification of the IL in our experiments is -4.5.
5. CONCLUSION
Based on Fresnel’s equations and the common-path phase-shifting interfermetry, an alternative method for measuring the index profile of a GRIN lens has been proposed. In this method, the Carre’s phase-shifting interferometric technique with an EOM phase shifter has been used to estimate the full-field phase distribution. A light beam compromising of the right- and the left- circularly polarized components is obliquely incident on the tested GRIN lens and the reflected light passes through an analyzer. Then, the light is collected and imaged by a set of imaging lenses to a CMOS camera. Four interferograms under different additional phases are taken and sent to a PC computer to calculate
Fig. 5 Relation curve of nΔ versus n.
the full-field phase distribution. Next, the estimated data are substituted into the special equations derived from the Fresnel’s equations, and the index profile of the GRIN lens can be obtained. The validity of this method has been demonstrated. It has both merits of the common-path interferemetry and the phase-shifting interferemetry, that is, high stability, simple configuration, easy operation, and high resolution.
ACKNOWLEDGMENTS
This study was supported in part by the National Science Council, Taiwan, under Contract No. NSC98-2221-E-009-018-MY3
REFERENCES
[1] Chao, Y. F. and Lee, K. Y., "Index profile of radial gradient index lens measured by imaging ellipsometric
technique," Jap. Jour. Appl. Opt. 44, 1111-1114 (2005).
[2] Liu, Z., Dong, X., Chen, Q., Yin, C., Xu, Y. and Zheng, Y., ”Nondestructive measurement of an optical fiber
refractive-index profile by a transmitted-light differential interference contact microscope,” Appl. Opt. 43, 1485- 1492 (2004).
[3] Vazquez, D., Acosta, E., Smith, G. and Garner, L., ”Tomographic method for measurement of the radiant refractive
index of the crystalline lens. II The rotationally symmetrical lens,” Opt. Soc. Am. A 23, 2551- 2565 (2006).
[4] Ray, M., Sarkar, S. K., Basuray, A. and SoodBiswas, N., ”Measurement of refractive index profile of GRIN
glasses,” SPIE 4417, 483- 488(2001).
[5] Conde, R. and Depeursinge, C., “Refractive index profile and geometry measurements in multicore fibres,” Pure
Appl. Opt. 5, 269–274 (1996).
[6] Born, M. and Wolf, E., Principles of optics, 7th ed., Pergamon, Oxford, UK , p.40 (1999). [7] Malacara, D., Optical shop testing, 3rd ed., John Wiley, USA, p. 547 (2007).
[8] Yariv, A. and Yeh, P., Optical waves in crystals, John Wiley & Sons, New York, p. 276 (1984). [9] Gasvik, K. J., “Optical Metrology,” 3rd ed., John Wiley, 280 (2002).
[10] Rastogi, P. K., “Optical Measurement Techniques and Applications,” Artech House, Boston, 101 (1997). [11] Saleh, B. E. A. and Teich, M. C., “Fundamentals of Photonics,” Wiley, New York, 702 (1991).
[12] Su, D. C., Chiu, M. H. and Chen, C. D., “Simple two-frequency laser,” Precis. Eng. 18, 161-163 (1996).
[13] Chiu, M. H., Lee, J. Y. and Su, D. C., “Complex refractive-index measurement based on Fresnel's equations