903
Extremely High Methane Concentration in Bottom Water and
Cored Sediments from Offshore Southwestern Taiwan
Pei-Chuan Chuang1, Tsanyao Frank Yang1,
*
, Saulwood Lin 2, Hsiao-Fen Lee1, Tefang F. Lan1, Wei-Li Hong1, Char-Shine Liu 2, Ju-Chin Chen 2, and Yunshuen Wang 3(Manuscript received 10 March 2006, in final form 28 September 2006)
ABSTRACT
1
Department of Geosciences, National Taiwan University, Taipei, Taiwan, ROC
2
Institute of Oceanography, National Taiwan University, Taipei, Taiwan, ROC
3
Central Geological Survey, MOEA, Taipei, Taiwan, ROC
*
Corresponding author address: Prof. Tsanyao Frank Yang, Department of Geosciences, National Taiwan University, Taipei, Taiwan, ROC; E-mail: tyyang@ntu.edu.twIt has been found that Bottom Simulating Reflections (BSRs), which infer the existence of potential gas hydrates underneath seafloor sediments, are widely distributed in offshore southwestern Taiwan. Fluids and gases derived from dissociation of gas hydrates, which are typically methane enriched, affect the composition of seawater and sediments near venting areas. Hence, methane concentration of seawater and sediments become useful proxies for exploration of potential gas hydrates in a given area. We systematically collected bottom waters and sedimentary core samples for dis-solved and pore-space gas analyses through five cruises: ORI-697, ORI-718, ORII-1207, ORII-1230, and ORI-732 from 2003 to 2005 in this study. Some sites with extremely high methane concentrations have been found in off-shore southwestern Taiwan, e.g., sites G23 of ORI-697, N8 of ORI-718, and G96 of ORI-732. The methane concentrations of cored sediments display an increasing trend with depth. Furthermore, the down-core profiles of methane and sulfate reveal very shallow depths of sulfate methane inter-face (SMI) at some sites in this study. It implies sulfate reduction being mainly driven by the process of anaerobic methane oxidation (AMO) in sediments; thus indicating that there is a methane-enriched venting source, which may be the product of dissociation of gas hydrates in this area.
(Key words: Methane, Gas hydrate, Sulfate methane interface, Anaerobic methane oxidation)
1. INTRODUCTION
Gas hydrates, which are a kind of non-stoichiometric clathrate, are natural occurring sol-ids composed of water molecules forming a rigid lattice of cages with most of the cages each containing a molecule of natural gas, mainly methane. These are metastable crystal products at low temperature and high-pressure. If the temperature and pressure conditions are above the gas hydrate stability boundary, then the protogenic gas hydrates dissociate into water and methane. Gas hydrates are widely distributed in the permafrost of polar regions and the strata of continental deep-sea areas (Kvenvolden 1998; Pellenbarg and Max 2000; Sloan 1998; Milkov 2004) and are considered future potential energy resources.
There are conditions under which gas hydrates beneath the ocean floor may become unstable: firstly, if there is a general change in temperature and pressure conditions at the seafloor; and secondly, if warm fluids begin moving through highly permeable faults (Pecher 2002). When dissociation occurs, the frozen sediments become liquefied releasing water and dissociated gases and thereby increasing pore pressure. These high-pressure fluids from gas hydrate dissociation permeate upward through the seafloor. Here, there is a strong potential for faults and porous layers to provide the main migration pathways for fluids in gas hydrate bearing layers (Pecher 2002; Wood et al. 2002).
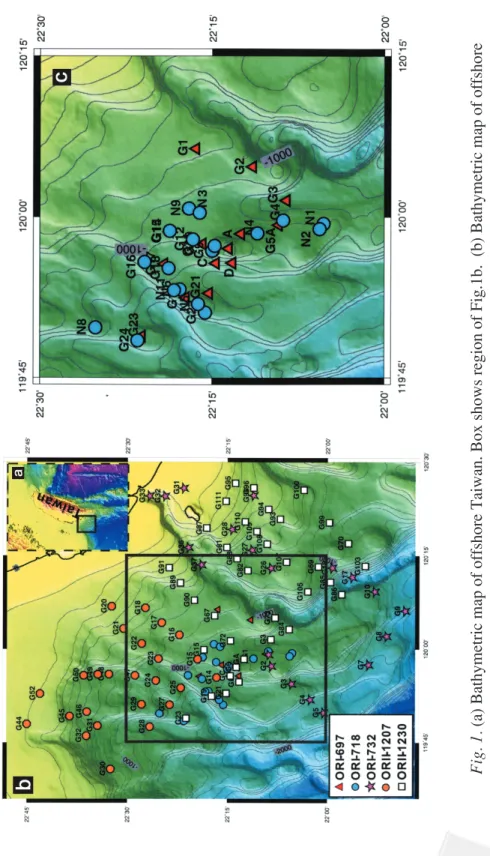
The fluids dissociated from gas hydrates may erupt through craters forming mud volcanoes. This may explain the presence of submarine mud volcanoes in offshore southwestern Taiwan (e.g., Chou et al. 2000; Chiu et al. 2006), which have been considered to be related to on-land mud volcanoes (Yang et al. 2003, 2004) by Yeh (2003). Moreover, these methane-rich fluids influence the composition of pore water and bottom seawater around these gas-expelling craters. Local scientists have done many geophysical investigations on gas hydrates in offshore southwestern Taiwan. Based on seismic reflection profiles, they found many Bottom Simulat-ing Reflections (BSRs) and concluded that gas hydrates are widely distributed under the seaf-loor of depths of 700 to 3000 m in this region (Chi et al. 1998; Chow et al. 2000; Schnürle et al. 1999, 2002, 2006; Liu et al. 2006). The study presents the first systematic survey based on gas geochemical techniques performed in the gas hydrate area in offshore SW Taiwan. We col-lected bottom waters and cored sediments for fluid and gas geochemistry study during five cruises (ORI-697; ORI-718; ORI-732; ORII-1207; ORII-1230) from 2003 to 2005. The sam-pling sites are shown in Fig. 1.
In comparison with gas hydrate studies in other areas (Kvenvolden and Lorenson 2000; Lorenson and Collett 2000), our results show unusually high methane concentration in bottom water and sediment pore space. This phenomenon can be explained by venting methane, which could be due to the release of methane from gas hydrate dissociation migrating upward.
2. ANALYTICAL METHODS AND PROCEDURES
Bottom water and sediment samples were collected for analyzing dissolved methane concen-tration in seawater and pore spaces. Sediment samples were collected by both gravity (30 - 100 cm of length) and piston (300 - 500 cm of length) core samplers. Bottom seawater samples are
Fig. 1.
represented by core top waters. The core top waters were collected in plastic bottles and then transferred immediately to low permeability glass bottles. After being given an ultrasonic bath at 60°C for 10 minutes, the dissolved gas of the bottom water was transferred to a 7-ml Vacutainer using a gas tight syringe. The extracted gases were analyzed using gas chromatography. Sediments were placed in a tin can of volume ca. 930 cm3 immediately after the cores
were retrieved on board. Distilled water was added into the can and a fixed space remained as the headspace. HgCl2 was added as a bacterial inhibitor. To avoid water and gas escaping, the cover was sealed by silicone gel. After the silicone dried, the can was kept upside down and ready for analyses.
In order to release all gases into the headspace from the pore space of the sediments, the tin can was first shaken after being brought back to a shore-based laboratory and then kept at room temperature for 30 minutes. A gas-tight syringe’s needle, connected to a Vacutainer, was allowed to pierce the tinplate can using a septa. Gases from the headspace were thus transferred to the Vacutainer. These extracted gases were then injected into a gas chromato-graph for analysis.
Gas was introduced into a gas chromatograph (GC) (SRI 8610C) equipped with both thermal conductivity (TCD) and flame ionization (FID) detectors. Different components of the gas were separated in GC (injection temperature 30°C, held isothermal for 2 minutes, ramped to 250°C at 120°C min-1). The system utilized two carrier gases, hydrogen and argon.
Hydrogen was supplied by a hydrogen generator for use in the FID and in one TCD; whilst the other TCD utilized argon supplied by a cylinder tank. In general, most gas components ana-lyzed in this system have analytical errors of less than 5% with low detection and quantifica-tion limits (Lee et al. 2005). Results of dissolved methane concentraquantifica-tions are reported relative to the volume of seawater from which the gases were extracted (i.e., nanoliters of gas per liter of seawater [nL L-1]) and methane concentrations of cored sediments are reported relative to
wet sediment from which the gases were extracted (i.e., microliters of gas per liter of wet sediment [µL L-1]).
3. RESULTS
3.1 Dissolved Methane Concentrations in Bottom Water
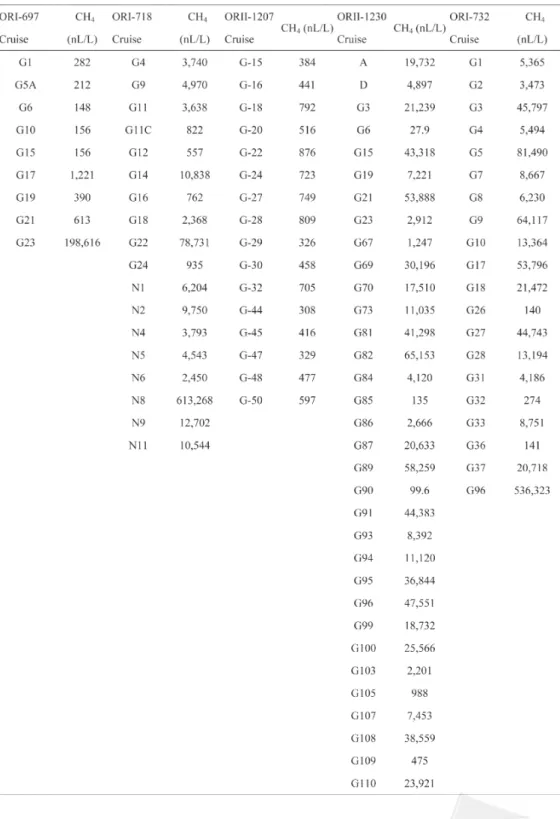
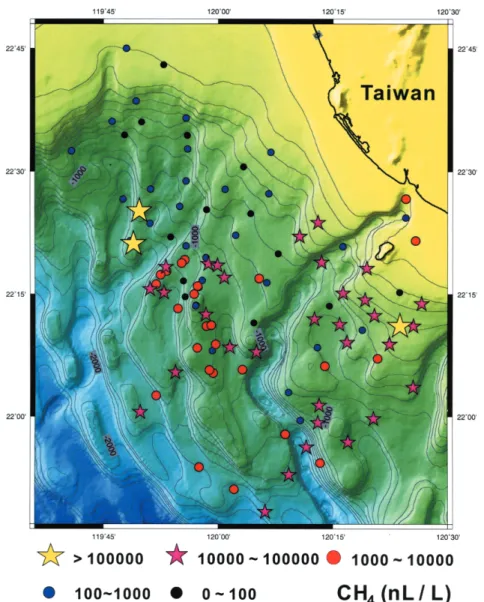
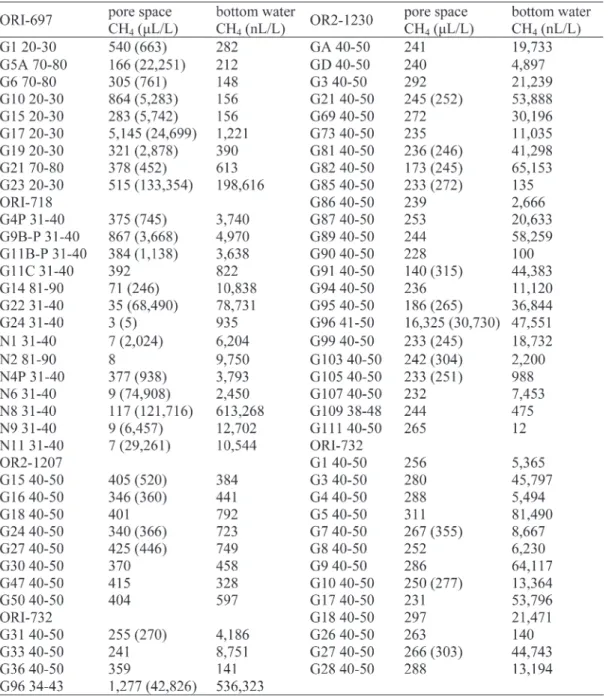
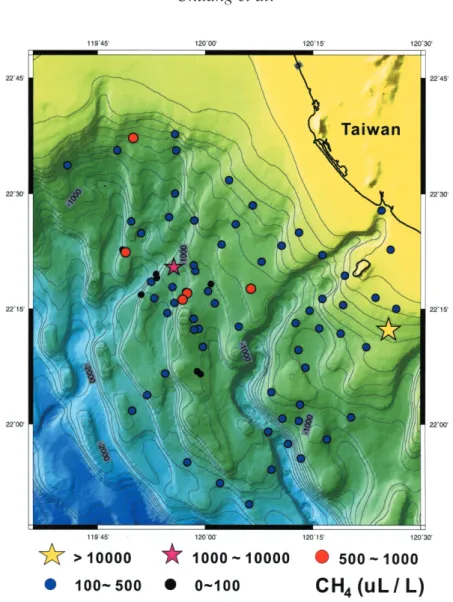
Results obtained from core top waters of 114 sites are listed in Table 1. Most of the samples contain methane as the dominant hydrocarbon gas. Most C2+ gases are below detec-tion limits, so only the results of methane concentradetec-tion are given here. The results can be arbitrarily divided into five groups: (a) Very low methane concentration (below detection limits); (b) Low methane concentration ( < 100 nL L-1); (c) High methane concentration (100
~ 1000 nL L-1); (d) Very high methane concentration (1000 ~ 10000 nL L-1); (e) Especial high
methane concentration (10000 ~ 100000 nL L-1); (f) Extremely high methane concentration
( > 100000 nL L-1). The concentration distribution of the dissolved methane in bottom water
in this study is compiled in Fig. 2. It shows that most sites exhibit much higher dissolved methane concentration than those in normal seawater, which is usually below 50 nL L-1 (Millero
Table 1. Dissolved methane concentrations measured in Offshore Southwestern Taiwan bottom seawaters.
Fig. 2. Map of methane concentrations (in nL L-1) in bottom seawaters distributed
in offshore southern Taiwan.
3.2 Methane and Ethane Concentrations of Cored Sediments
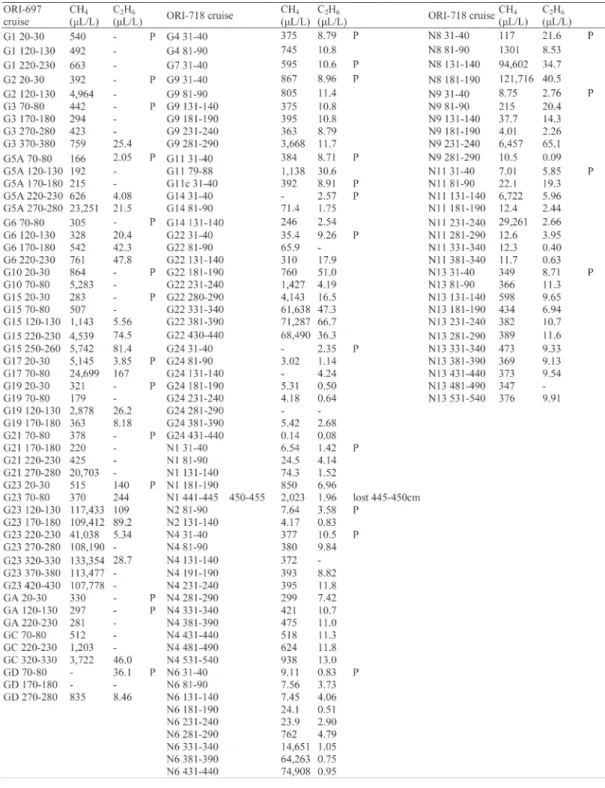
Methane is the main component of hydrocarbon gases, ethane is the minor component and C3+ gases usually are below detection limits. The results are consistent with recent work of Oung et al. (2006) in this area. Table 2 shows both methane and ethane concentrations of all
cored samples of each cruise. Note that the reported concentrations are considered to be the minimum values of the samples due to possible gas loss during core recovery, cutting, sample storage and gas transfer before analysis.
Except for a few sites, e.g., sites GD of ORI-697 and G24 of ORI-718 where the methane concentrations are very low (less than 10 µL L-1), the results show that most of the methane
concentrations in the pore spaces range from ~10 to ~10000 µL L-1.
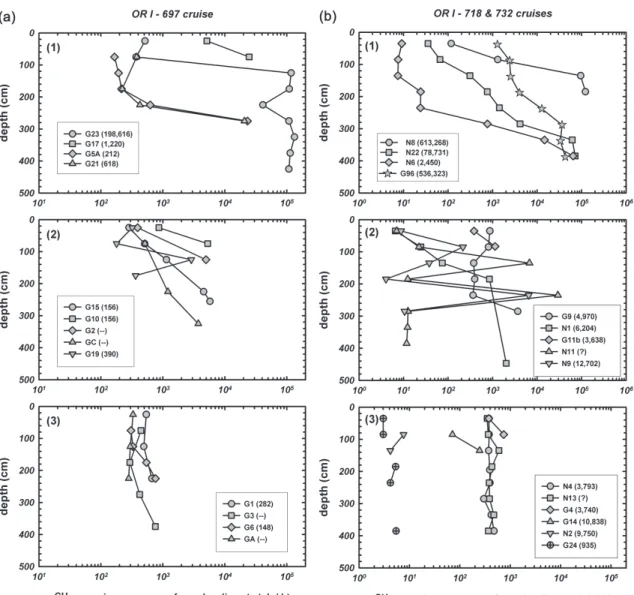
In general, most of the cored samples show less methane concentrations in the shallower depths, and methane concentration increasing with increasing depth (Fig. 3; see Table 2 for details). Extremely high methane concentrations can be found at some sites, especially sites G23 of ORI-697, G22, N8 of ORI-718, and G96 of ORI-732 cruises. In contrast, methane concentra-tions at some sites do not change much with depth and maintain similar values (102 ~ 103 µL L-1)
(Fig. 3), e.g., sites: G1, G3, G6, GA of ORI-697, and N4, N13, G4, G14 of ORI-718. It is worth noting that methane profiles at some sites show a saw-tooth shape, e.g., sites G19 of ORI-697 and N11, N9 of ORI-718, which indicate possible gas leaks at some depths or mul-tiple gas sources underneath some sites.
Note that the gravity core samples, of three cruises, ORII-1207, ORII-1230 (except G96) and ORI-732 (except G96), show low methane concentrations ( < 103 µL L-1) at all sites. The
length of cored sediments from gravity core samplers usually is less than 2 m, so the change of methane concentrations with depth is unknown for those sites.
4. DISCUSSIONS
4.1 Very Shallow Depth of Sulfate Methane Interface
Sulfate is involved in two chemical reactions induced by microbial activity that deplete sulfate in pore waters of the sulfate reduction zone within anoxic marine sediments. In the first process, sulfate, which is a kind of oxidant, reacts with sedimentary organic matter. The net reaction of the first process is shown as equation (1):
2(CH O) + SO 2 4 2- → 2HCO + H S3 - 2 . (1) In the second process, sulfate reacts with methane called anaerobic methane oxidation (AMO). The net reaction of the second process can be shown as equation (2):
CH + SO 4 4 2- → HCO + HS + H O3- - 2 . (2) By combining the profiles of interstitial sulfate concentration and the methane concentra-tion of pore spaces in sediments from a gas hydrate area, it is typical to observe sulfate deplet-ing and methane increasdeplet-ing dramatically at a particular depth; this is called the Sulfate Meth-ane Interface (SMI). If methMeth-ane fluxes from sediments are high, sulfate reduction rates will be fast. Furthermore, fast sulfate reduction rates induce shallower depth of the SMI. Therefore, the profiles of interstitial sulfate concentration and the methane concentration of pore space in sediments can provide an indicator for further estimation of methane fluxes from buried sedi-ments if there are gas hydrates beneath the sea floor (Borowski et al. 1996, 1999).
Fig. 3. Methane profiles of cored samples in this study. Figs. 3a and b (1): Meth-ane concentrations are low in the shallower depth, which increases with increasing depth ( < 10 ~ 105µL L-1). Figs. 3a and b (2): Methane profiles at
some sites show a saw-tooth shape ( > 104µL L-1; < 10 µL L-1). Figs. 3a
and b (3): Methane concentrations do not change much with depth and maintain similar values (0 ~ 103 µL L-1). Note that CH
4 concentrations have been converted from reported units (µL L-1). The number in
paren-theses represents the methane concentration (nL L-1) in bottom seawaters
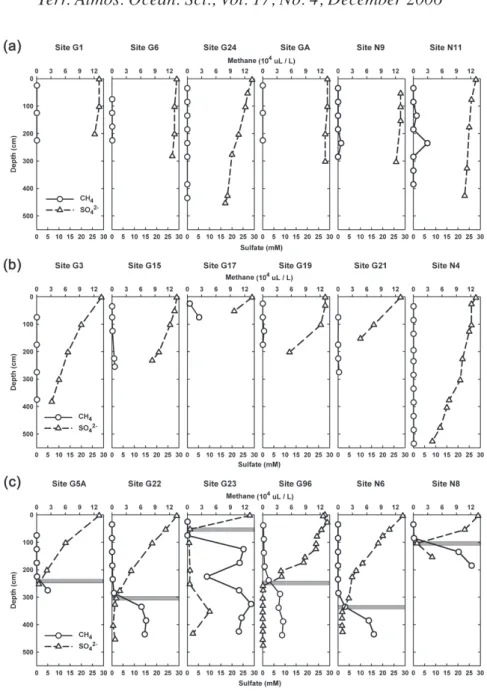
Geochemical profiles for cored samples are plotted in Fig. 4 with corresponding sulfate concentrations (Lin et al. 2006) in pore water and methane concentrations in pore space. Ac-cording to the depths of the SMI, the profiles can be grouped into three categories as discussed below:
(a) No obvious sulfate reduction trend and no discernable SMI (Fig. 4a): The profiles show that methane concentrations are very low in pore spaces showing no changes with increasing depths and sulfates are not depleted. This may be due to two reasons: low methane fluxes, or the short length of cores. The sites where the depths of SMI cannot be determined are: G1, G2, G6, GA, GC, G10 of ORI-697, and G4, G11, G9, G24, N1, N2, N9, N11, N13 of ORI-718.
(b) There is obvious sulfate reduction trend, and depths of the SMI can be predicted at a
few meters below the core length ( < 10 m) (Fig. 4b): Profiles show that methane
con-centrations do not change with increasing depths. Only some stations contain higher meth-ane concentrations in the bottom part of cored samples. Due to the short lengths of cored samples, the depths of the SMI cannot be measured. However, there might be higher methane fluxes in deeper sediments that affect the sulfate profiles with increasing depth. The curves of the sulfate profiles show a steep slope. Therefore, the depths of the SMI might be less than 10 m based on sulfate gradients, e.g., sites: G3, G15, G17, G19, G21 of ORI-697, and G14, N4 of ORI-718.
(c) The sulfate reduction trend is very sharp and the SMI appears at very shallow depths
( < 4 m) (Fig. 4c): The profiles show that the depths of the SMI range between 100 and 400 cm,
e.g., G5A, G23 (the sudden decrease of methane concentration at 225 cm might be due to leakage or sampling problems such as the introduction of air during storage) of ORI-697; G22, N6, N8 of ORI-718, and G96 of ORI-732. Note that the methane and sulfate profiles of gas hydrate bearing sediments from Blake Ridge at Ocean Drilling Program (ODP) sites 994, 995, and 997 show that the depths of the SMI are around 20 m (Dickens 2001). Com-pared to the results of ODP 204 sites, the sites in this study present much shallower SMI depths, especially at sites G23 of ORI-697 and N8 of ORI-718 ( < 100 cm). The low methane concentrations (~10 nL L-1) are controlled by AMO in the sulfate reduction zone.
Below 100 ~ 300 cm, methane concentrations can be up to 104 nL L-1 and sulfate becomes
totally depleted. To sum up, the stations shown in Figs. 4b and c have very shallow depths of the SMI indicating that there should be very high methane fluxes below the sea floors in the region.
4.2. Extremely High Methane Concentration
In general, dissolved methane concentration in average seawater is very low, about 20 nL L-1.
For example, in the Gulf of Mexico excluding areas where gas hydrate were found, methane concentration below 200 m is less than 50 nL L-1 except whenever methane is saturated due to
bacterial activity or photochemical processes (Millero 1996). In the area offshore SW Taiwan, measured methane concentrations in core top water samples are higher than general seawater background values and vary from 102 to 105 nL L-1. Moreover, some extremely high methane
Fig. 4. Selected profiles of methane concentrations of pore space in cored samples and dissolved sulfate concentrations in pore water. (a) The depths of SMI cannot be determined because of the short length of cored samples; (b) The depths of SMI cannot be determined. According to the sulfate gradient, it can be predicted that the depths of SMI are very shallow ( < 10 m); (c) The depths of SMI can be determined and are very shallow ( < 4 m). The shadow in different profiles shows the possibility range of the depths of SMI. The data of sulfate concentrations are from Lin et al. (2006).
concentrations ( > 100000 nL L-1) have been found in the study area, e.g., at sites G23 of ORI-697,
N8 of ORI-718, and G96 of ORI-732. Furthermore, these values are even higher than the very high dissolved methane concentration in seawater columns of the Hydrate Ridge area (Suess et al. 1999). This indicates that there are active venting sources injecting methane into seawa-ter in this area.
Based on the results of methane concentrations in the pore spaces of cored samples, there are extremely high methane concentrations at some sites, especially sites G23 of ORI-697, G22, N8 of ORI-718, and G96 of ORI-732. The highest methane concentration was detected at depths of 320 - 330 cm at site G23 of ORI-697 and its value is 133354 (µL L-1). This value
is higher than that obtained at the gas hydrate and gas venting rich area of the Blake Ridge (Kvenvolden and Lorenson 2000; Lorenson and Collett 2000).
Generally, the value of dissolved methane concentration in bottom seawater indicates whether there is a gas source beneath the sea floor or not at that station and can be taken as an efficient method of investigating whether or not there is a methane vent on the sea floor. Comparing the results of dissolved methane concentrations in bottom seawater with methane concentrations of pore spaces in sediments (Table 1; Table 2; Fig. 2), there is good correlation at sites of ORI-697, i.e., the higher the dissolved methane concentration in bottom seawater, the higher the methane concentrations of pore spaces in cored samples and vise versa. However, no good correlations are found at other sites especially in ORII-1230 and ORI-732 cruises except sites G22, N8 of ORI-718, and G96 of ORI-732. Most of the stations contain high dissolved methane concentrations without unusually high methane concentrations in the pore spaces of cored samples ([CH4] < 400 µL L-1).
The uncorrelated results of dissolved methane concentrations in bottom seawater and meth-ane concentrations of pore space in sediments of ORII-120 and ORI-732 cruises might be caused by the water samples. As the bottom water samples are represented by gravity core top water samples, they might be disturbed by core top sediments. Therefore, methane in the pore spaces may have been released into the core top water, making the core top water rich in highly dissolved methane. Note that the methane concentrations of pore spaces are much higher than the dissolved methane concentrations in bottom water (up to 3 orders of magnitude). Although methane concentrations of pore spaces do not have unusually high values (presume 200 µL L-1), the dissolved methane concentrations can easily reach abnormally high values
(200000 nL L-1) after being disturbed by methane of the pore spaces. For this reason, the
methane concentrations of pore spaces in core top sediments (the average depths range from 30 - 50 cm) are treated as an indicator of methane vent on the seafloor (Table 3; Fig. 5).
Actually, the dissolved methane concentrations of core top seawater can not be used as the only indicator to estimate if there are methane vents on the seafloor. In order to study the unusual values at one station, dissolved methane concentrations at different depths of the wa-ter column (e.g., Chen and Tseng 2006; Yang et al. 2006) and methane concentration of pore spaces at different depths of cored samples need to be taken into consideration.
Dissolved methane concentrations in bottom water and methane concentrations of pore spaces in deeper sediments are extremely high at sites N8, G23 of ORI-697, G22 of ORI-718, and G96 of ORI-732. The depths of the SMI in these four sites are also very shallow. As mentioned before, the stations have very shallow SMI depths indicating that there might be
Table 3. Comparison with dissolved methane in bottom waters and methane concentration of cored samples at the same site.
very high methane fluxes below the sea floor, which causes the extremely high methane con-centrations at these four sites. Moreover, besides the intensive BSRs (Liu et al. 2006) and the very high methane fluxes, there are high sulfate reduction rates, authigenic carbonates and pyrites existing at sites N8, G23 of ORI-697, and G22 of ORI-718 (Huang et al. 2006; Horng et al.
Fig. 5. Distribution of methane concentrations (in µL L-1) of pore spaces in
offshore southern Taiwan. Note that plotting methane concentrations from ORI-697 and ORI-718 are taken the data from upper 20 ~ 30 m sediments; while, those from ORII-1207, ORII-1230, and ORI-732 are from upper 40 ~ 50 m sediment.
2006; Jiang et al. 2006; Lin et al. 2006). Therefore, beneath these sites, the upward migrating methane through shallow sediments into the seawater might be released from the dissociation of gas hydrates.
5. CONCLUSIONS
1. Sediments and bottom waters were systematically collected by piston cores and gravity cores during five cruises from 2003 to 2005. The results show that many sites exhibit extremely high methane concentrations in both bottom water and sediments pore space compared to other gas hydrate areas in the world.
2. In general, the dissolved methane concentrations in bottom seawater are very high ( > 1000 nL L-1). Most values are much higher than the average seawater value ( < 50 nL L-1),
especially at site N8 of ORI-718, where the value reaches 613268 nL L-1. This implies that
a large amount of methane is venting from deep sediments up to the seawater in a wide area. 3. Methane is the main component of hydrocarbon gases in the study area, while ethane is the minor component and C3+ gases are usually below detection limits. Most of the cored sediments collected show a positive correlation of methane concentration in pore space with depth.
4. Methane concentrations at many sampling sites are higher than 100000 µL L-1, e.g., site G23
of ORI-697 and N8 of ORI-718. This infers that methane sources exist beneath the sea floor at these sites.
5. From methane and sulfate depth profiles, it has been found that the depths of the SMI are very shallow at many stations, which indicate the presence of very high methane fluxes. The high methane fluxes in this area might have been caused by the dissociation of gas hydrates below the sea floor. After gas hydrates dissociate, a large amount of methane is released and migrates upward to the shallow parts of sediment and the seawater. This can explain the unusually high methane concentration observed in this area.
Acknowledgements We thank the staff of Ocean Research Vessel I and II and all assistants
and students for their assistance in collecting samples. Discussion with all PIs of this gas hydrate integrated project is helpful. Drs. Giuseppe Etiope, Chih-Hsien Sun, and Ulrich Knittel gave critical comments and improved the manuscript. Central Geological Survey of Taiwan, ROC financially supported this study (5226902000-06-93-02; 5226902000-05-94-02).
REFERENCES
Borowski, W. S., C. K. Paull, and W. Ussler, 1996: Marine pore-water sulfate profiles indi-cate in situ methane flux from underlying gas hydrate. Geology, 24, 655-658.
Borowski, W. S., C. K. Paull, and W. Ussler, 1999: Global and local variations of interstitial sulfate gradients in deep-water, continental margin sediments: Sensitivity to underly-ing methane and gas hydrates. Mar. Geol., 159, 131-154.
Chen, C. T. A., and H. C. Tseng, 2006: Abnormally high CH4 concentrations in seawater at mid-depths on the continental slopes of the northern South China Sea. Terr. Atmos. Ocean. Sci., 17, 951-959.
Chi, W. C., D. L. Reed, C. S. Liu, and N. Lunberg, 1998: Distribution of the bottom simulat-ing reflector in the offshore Taiwan collision zone. Terr. Atmos. Ocean. Sci., 9, 779-793. Chiu, J. K., W. H. Tseng, and C. S. Liu, 2006: Distribution of gassy sediments and mud
volcanoes offshore southwestern Taiwan. Terr. Atmos. Ocean. Sci., 17, 703-722. Chow, J., J. S. Lee, R. Sun, C. S. Liu, and N. Lundberg, 2000: Characteristics of the bottom
simulating reflectors near mud diapirs: offshore southwestern Taiwan. Geo-Mar. Lett.,
20, 3-9.
Dickens, G. R., 2001: Sulfate profiles and barium fronts in sediment on the Blake Ridge: present and past methane fluxes through a large gas hydrate reservoir. Geochim. Cosmochim. Acta, 65, 529-543.
Horng, C. S., and K. H. Chen, 2006: Complicated magnetic mineral assemblages in marine sediments offshore of southwestern Taiwan: possible influence of methane flux on the early diagenetic process. Terr. Atmos. Ocean. Sci., 17, 1009-1026.
Huang, C. Y., C. W. Chien, M. Zhao, H. C. Li, and Y. Iizuka, 2006: Geological study of active cold seeps in the syn-collision accretionary prism Kaoping slope off SW Taiwan. Terr. Atmos. Ocean. Sci., 17, 679-702.
Jiang, W. T., J. C. Chen, B. J. Huang, C. J. Chen, Y. T. Lee, P. R. Huang, C. C. Lung, and S. W. Huang, 2006: Mineralogy and physical properties of cored sediments from the gas hydrate potential area of offshore southwestern Taiwan. Terr. Atmos. Ocean. Sci., 17, 981-1007.
Kvenvolden, K. A., 1998: A primer on the geological occurrence of gas hydrate. In: Henriet, J. P., and J. Mienert (Eds.), Gas Hydrates: Relevance to World Margin Stability and Climate Change, Geol. Soc. London, Spec. Publ., 137, 9-30.
Kvenvolden, K. A., and T. D. Lorenson, 2000: Methane and other hydrocarbon gases in sedi-ment from the southeastern North American continental margin. In: Paull, C. K. et al. (Eds.), Proceedings of the Ocean Drilling Program, Scientific Results, 164, 29-36. Lee, H. F., T. F. Yang, T. F. Lan, S. R. Song, and S. Tsao, 2005: Fumarolic gas composition
of the Tatun Volcano Group, northern Taiwan. Terr. Atmos. Ocean. Sci., 16, 843-864. Lin, S., W. C. Hsieh, Y. C. Lim, T. F. Yang, C. S. Liu, and Y. Wang, 2006: Methane migra-tion and its influence on sulfate reducmigra-tion in the Good Weather Ridge region, South China Sea continental margin sediments. Terr. Atmos. Ocean. Sci., 17, 883-902. Liu, C. S., P. Schnürle, Y. Wang, S. H. Chung, S. C. Chen, and T. H. Hsiuan, 2006:
Distribu-tion and characters of gas hydrate offshore of southwestern Taiwan. Terr. Atmos. Ocean. Sci., 17, 615-644.
Lorenson, T. D., and T. S. Collett, 2000: Gas content and composition of gas hydrate from sediments of the southeastern North American continental margin. In: Paull, C. K. et al. (Eds.), Proceedings of the Ocean Drilling Program, Scientific Results, 164, 37-46. Milkov, A. V., 2004: Global estimates of hydrate-bound gas in marine sediments: how much
is really out there? Earth-Sci. Rev., 66, 183-197.
Oung, J. N., C. Y. Lee, C. S. Lee, and C. L. Kuo, 2006: Geochemical study on hydrocarbon gases in seafloor sediments, southwestern offshore Taiwan - implications in the poten-tial occurrence of gas hydrates. Terr. Atmos. Ocean. Sci., 17, 921-931.
Pecher, I. A., 2002: Gas hydrates on the brink. Nature, 420, 622-623.
Pellenbarg, R. E., M. D. Max, 2000: Introduction, physical properties, and natural occur-rences of hydrate. In: Max, M. D. (Ed.), Natural Gas Hydrate in Oceanic and Perma-frost Environments, Kuwer Academic, Netherlands, 1-8.
Schnürle, P., T. H. Hsiuan, and C. S. Liu, 1999: Constrains on free gas and gas hydrate bear-ing sediments from multi-channel seismic data, offshore southwestern Taiwan. Petrol. Geol. Taiwan, 33, 21-42.
Schnürle, P., T. H. Hsiuan, T. K. Wang, K. MacIntosh, C. S. Liu, D. Reed, and Y. Nakamura, 2002: Characteristics of gas hydrate and free gas offshore southwestern Taiwan: pre-liminary results from a combined seismic reflection/refraction analysis. Petrol. Geol. Taiwan, 35, 1-34.
Schnürle, P., C. S. Liu, and C. S. Lee, 2006: Acoustic and shear-wave velocities in hydrate-bearing sediments offshore southwestern Taiwan: tomography, converted waves analysis and reverse-time migration of OBS records. Terr. Atmos. Ocean. Sci., 17, 757-779. Sloan, E. D. Jr., 1998: Physical/chemical properties of gas hydrates and application to world
margin stability and climatic change. In: Henriet, J. P., and J. Mienert (Eds.), Gas Hydrates: Relevance to World Margin Stability and Climate Change, Geol. Soc., London, Spec. Publ., 137, 31-50.
Suess, E., M. E. Torres, G. Bohrmann, R. W. Collier, J. Greinert, P. Linkea, G. Rehder, A. Trehu, K. Wallmann, G. Winckler, and E. Zuleger, 1999: Gas hydrate destabilization: enhanced dewatering, benthic material turnover and large methane plumes at the Cascadia convergent margin. Earth Planet. Sci. Lett., 170, 1-15.
Wood, W. T., J. F. Gettrust, N. R. Chapman, G. D. Spence, and R. D. Hyndman, 2002: De-creased stability of methane hydrate in marine sediments owing to phase-boundary roughness. Nature, 420, 656-660.
Yang, T. F., C. Y. Chou, C. H. Chen, L. L. Chyi, and J. H. Jiang, 2003: Exhalation of radon and its carrier gases in SW Taiwan. Radiat. Meas., 36, 425-429.
Yang, T. F., G. H. Yeh, C. C. Fu, C. C. Wang, T. F. Lan, H. F. Lee, C. H. Chen, V. Walia, and Q. C. Sung, 2004: Composition and exhalation flux of gases from mud volcanoes in Taiwan. Environ. Geol., 46, 1003-1011.
Yang, T. F., P. C. Chuang, S. Lin, J. C. Chen, Y. Wang, and S. H. Chung, 2006: Methane venting in gas hydrate potential area offshore of SW Taiwan: evidence of gas analysis of water column samples. Terr. Atmos. Ocean. Sci., 17, 933-950.
Yeh, G. H., 2003: Geochemistry and sources of mud-volcano fluids in Taiwan. Master Thesis, Inst. Oceanogr., Natl. Taiwan Univ., 61 pp. (in Chinese)
Chuang, P. C., T. F. Yang, S. Lin, H. F. Lee, T. F. Lan, W. L. Hong, C. S. Liu, J. C. Chen, and Y. Wang, 2006: Extremely high methane concentration in bottom water and cored sediments from offshore southwestern Taiwan. Terr. Atmos. Ocean. Sci., 17, 903-920.
