Substitutional carbon reduction in SiGeC alloys grown by rapid thermal
chemical vapor deposition
C. W. Liu,a)Y. D. Tseng, and Y. S. Huang
Department of Electrical Engineering, National Taiwan University, 1, Roosevelt Road, Sec. 4, Taipei, Taiwan, Republic of China
共Received 20 May 1999; accepted for publication 16 August 1999兲
The substitutional carbon reduction in Si1⫺x⫺yGexCystrained layers, annealed at high temperatures,
increases the compressive strain in the originally strain-compensated alloys. From the rocking curve simulation, the maximum amount of carbon reduction was below 0.9% for the various samples which were annealed below 1000 °C in the nitrogen flow. The interstitial silicon injection by thermal oxidation of the Si cap on the Si1⫺x⫺yGexCylayer enhances the reduction of substitutional carbon to a concentration of 1.3%. Oxidation of Si1⫺x⫺yGexCyalloys yields a Ge-enriched Si1⫺xGexlayer with the Ge concentration larger than the initial content, and the formation of 3C silicon carbide precipitate is observed by the Fourier transform infrared spectroscopy. © 1999 American Institute of Physics.关S0003-6951共99兲04641-0兴
Recently, there has been impressive progress in the growth1,2 and characterization3–5 of Si1⫺x⫺yGexCy alloys,
which offer great flexibility to tailor the strain and the elec-tronic properties of group IV heterostructures.6,7The substi-tutional incorporation of C can compensate the compressive strain of Si1⫺xGex layers grown on Si substrates and
sup-press the boron outdiffusion in the base of Si/Si1⫺x⫺yGexCy/Si heterojunction bipolar transistors.7
However, the reduction of substitutional carbon in Si1⫺x⫺yGexCy alloys during high temperature processing
limits the applications of this material. The study8 on thick 80–160 nm Si1⫺x⫺yGexCy samples with x⫽0 or 0.11 and
y⫽0.005 and 0.01 grown by rapid thermal chemical vapor deposition 共RTCVD兲 showed that the reduction of substi-tional carbon at 1000–1130 °C was caused by 3C silicon carbide precipitates. The study9 on thick 230 nm Si0.9855C0.0145grown on molecular beam epitaxy also showed that the carbon related defects or silicon carbide precipitates were responsible for the strain-relieving process. Both stud-ies conclude that the width of carbon profiles does not change during the annealing process. The study10 on thin Si1⫺x⫺yGexCy 共⬃20 nm兲 samples showed the reduction of
substitutional carbon increased the compressive strain in the epilayer and thus yields misfit dislocation relaxation, while the film thickness is below the critical thickness. In this let-ter, we report the quantitative analysis of the substitutional carbon reduction in the Si1⫺x⫺yGexCy alloys with various
sample structures. The substitutional carbon reduction can be enhanced by the interstitial silicon injection.
The Si1⫺x⫺yGexCysingle quantum wells were grown on Si 具100典 substrates by RTCVD. The Si1⫺x⫺yGexCy layers with carbon content less than 0.012 were grown at 625 °C using methylsilane as the C source. For higher carbon con-tent samples (y⫽0.022), the growth temperature was 550 °C. The higher substitutional carbon incorporation at lower temperature is consistent with the previous report.11 The growth pressure was 6 Torr. The gas flows were 3 slpm
for a hydrogen carrier, 26 sccm for dichlorosilane, and 0.8 sccm for germane. The Si cap layers for less-carbon-content samples (y⭐0.12) were grown at 700 °C, using a 26 sccm dichlorosilane flow and a 3 slpm hydrogen flow. The Si caps of high-carbon content samples (y⫽0.022) were grown at 550 °C, using a 4 sccm silane flow and a 3 slpm hydrogen flow. The Ge fraction and thickness of Si1⫺xGex was
ex-tracted by fitting x-ray rocking curves. The details of the Si1⫺x⫺yGexCy growth can be found in Ref. 2. As small
amounts of methylsilane were added to the source gases, we observed a shift in the 共400兲 x-ray diffraction peak of the resulting Si1⫺x⫺yGexCy layers away from that of a similar
layer without addition of methylsilane. Vegard’s law with a compensation ratio of 1% C to 8.3% Ge was used1,2to esti-mate the carbon concentration in alloys. The carbon content was obtained from the shift of the 共400兲 peak by assuming the Ge concentration was unchanged as methylsilane was added. The thickness of the as-grown Si1⫺x⫺yGexCy
quan-tum well was also extracted by fitting the rocking curves, which has been calibrated by Auger electron spectroscopy depth profiles on thick samples. Secondary ion mass spec-troscopy共SIMS兲 also has confirmed flat C profiles, and that Ge concentration was unchanged by adding the methylsilane on calibration samples.
Quantum well structures were investigated in this study. The nominal thickness of the Si caps was about 60 and 30 nm for 625 °C-grown Si1⫺x⫺yGexCy layers and 550
°C-grown Si1⫺x⫺yGexCy layers, respectively. All as-grown
samples are pseudomorphic and fully strained due to the low temperature growth. No defect was observed in these as-grown films after defect etching, using four parts of 49% HF and five parts of 0.3M CrO3.
To study the substitutional carbon reduction of the Si/Si1⫺x⫺yGexCy/Si quantum wells, the x-ray rocking
curves from as-grown and annealed samples were measured. The samples were annealed at temperature from 800 to 1000 °C in nitrogen. To avoid the nonuniformity on 100 mm wafer, a cumulative annealing scheme is adopted. In other words, the annealing treatment at different temperatures was
a兲Electronic mail: [email protected]
APPLIED PHYSICS LETTERS VOLUME 75, NUMBER 15 11 OCTOBER 1999
2271
0003-6951/99/75(15)/2271/3/$15.00 © 1999 American Institute of Physics
performed on the same piece of samples. The peaks of
the 共400兲 x-ray rocking curves for a 29 nm
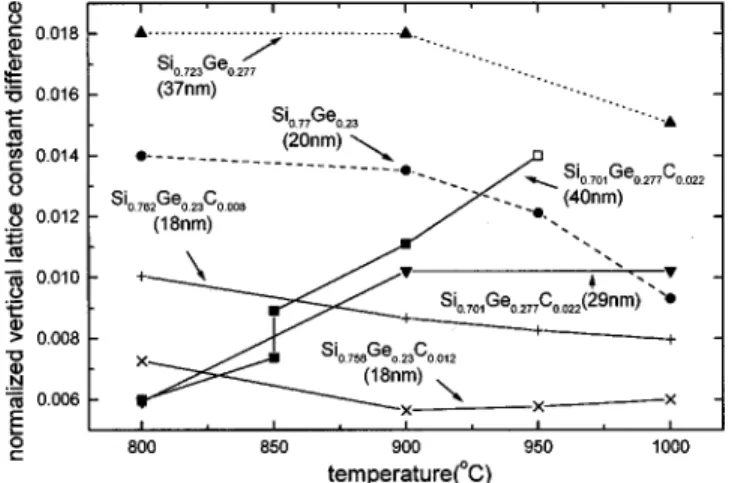
Si/Si0.701Ge0.277C0.022/Si quantum well sample shifts away from Si peak continuously 共Fig. 1兲, when the sample was annealed for 2 h from 800 to 1000 °C. The slight shift of 800 °C annealing process indicates the structure starts to lax. The low growth temperature of this sample may be re-sponsible for this, since 625 °C-grown samples are stable at 800 °C annealing for 2 h.10From the positions of the 共400兲 diffraction peaks, the vertical lattice constant can be obtained for various samples 共Fig. 2兲. The 37 nm Si0.723Ge0.277 and 20 nm Si0.77Ge0.23 control samples reveal a continuous de-crease of vertical lattice constant for the 2 h annealing from 800 to 1000 °C. This is due to the Ge out-diffusion and misfit dislocation formation.10 The annealing is performed in the ultrapure nitrogen flow. For the 18 nm Si0.762Ge0.23C0.008 sample, the vertical lattice constant drops slightly for the 2 h annealing from 800 to 1000 °C. For the 18 nm Si0.758Ge0.23C0.012 sample, the vertical lattice constant de-creases at 900 °C annealing for 2 h, but inde-creases for the 2 h annealing from 900 to 1000 °C. For the thick 29 nm Si0.701Ge0.277C0.022 sample, the vertical lattice constant in-creases for the 2 h annealing from 800 to 1000 °C. This
complicated behavior of Si1⫺x⫺yGexCy relaxation is most
likely due to the combined effects of Ge out-diffusion, misfit dislocation formation, and the reduction of substitutional car-bon. The Ge out-diffusion and misfit dislocation formation increase the vertical lattice constant, but the reduction of substitutional carbon decreases the vertical lattice constant. For thin samples, the Ge out-diffusion is important to change the vertical lattice constant, since the diffusion can lower the average Ge concentration more significantly, as compared to thick samples. However, the effect of substitutional carbon reduction on the vertical lattice is more pronounced in thick samples. To obtain the amount of substitutional carbon, the box profile of substitutional C distribution is assumed to fit the共400兲 diffraction rocking curves. From the secondary ion mass spectroscopy 共SIMS兲, the width of carbon profile is unchanged.8,9 The Ge profile is taken from the solution of one-dimensional interdiffusion equation.12 The relaxation of misfit dislocation is determined by the 共422兲 asymmetrical reflex. The substitutional carbon content in Si1⫺x⫺yGexCy epilayers can be obtained. The details can be found in Refs. 10 and 13.
Figure 3 shows the amount of substitutional carbon re-duction for various samples at different annealing tempera-tures. It is clear that the substitutional carbon reduction in-creases as the temperature inin-creases for all the samples. The reduction of substitutional carbon reaches a maximum amount of 0.009 for all these samples. A 40 nm Si0.701Ge0.277C0.022 sample was continuously annealed from 800 to 900 °C for 2 h in the nitrogen flow. The vertical lattice constant共Fig. 2兲 and the substitutional carbon reduction 共Fig. 3兲 of this sample increases for each annealing step. For the annealing at 850 °C, this sample was annealed two times. The vertical lattice constant of the 40 nm Si0.701Ge0.277C0.022 sample continues to increase after the second annealing step at 850 °C. This indicated substitutional carbon reduction does not reach thermal equilibrium at the annealing time. Similar results have been reported.9 To further investigate the substitutional carbon reduction behavior, we performed a 2 h oxidation process at 950 °C on the 40 nm Si0.701Ge0.277C0.022sample. This oxidizes the 3 nm Si cap and injects interstitial Si into the Si0.701Ge0.277C0.022 alloys, the vertical lattice constant continues to increase as determined
FIG. 1. The high-resolution x-ray diffraction spectra of a 29 nm Si/Si0.701Ge0.277C0.022/Si quantum wells. The annealing time is 2 h for each
temperature.
FIG. 2. The difference between vertical lattice constant of Si1⫺x⫺yGexCy and Si substrate normalized with respect to Si lattice constant at different annealing temperature. Solid symbols indicate the annealing in nitrogen. The empty square indicates the oxidation.
FIG. 3. The concentration of the substitutional carbon reduction for various Si1⫺x⫺yGexCy samples processed at different temperature. The empty square indicates the oxidation.
2272 Appl. Phys. Lett., Vol. 75, No. 15, 11 October 1999 Liu, Tseng, and Huang
from the共400兲 rocking curves 共Fig. 4兲 and the substitutional carbon reduction increases from 0.009 to 0.013. This indi-cated that the interstitial silicon injection can kick out sub-stitutional carbon and reduce the concentration of the substi-tutional carbon. Please note that the concentration of interstitial silicon at thermal equilibrium is very low (1013cm⫺3 at 1000 °C兲.14 The interstitial silicon cannot be the sole source of the substitutional carbon reduction at ther-mal equilibrium. The substitutional carbon may jump out of the lattice site with its own kinetics, but it is clear that the interstitial silicon can enhance this process.
After further oxidation of the Si0.701Ge0.277C0.022sample at 1000 °C for 2 h, the oxidation reaches the Si0.701Ge0.277C0.022layer, and the layer thickness decreases to 14 from 40 nm estimated from the共400兲 rocking curves 共Fig. 4兲. The Ge content in this layer becomes approximately 0.66, assuming the negligible substitutional carbon content, and the layer was completely relaxed, obtained from the 共422兲 reflex. The Ge content will be even higher, if there is some residual substitutional carbon. This severe Ge enrichment ef-fect was not observed in the pure Si1⫺xGex control samples.
The oxidation of Si1⫺xGexalloys results in the Ge pile-up at
the oxide/Si1⫺xGex interface.15 The Ge diffusion into
Si1⫺x⫺yGexunderneath may be enhanced by the
interstitial-carbon-related defect10 and yields a Ge-enriched layer. The Fourier transform infrared spectrum of the 1000 °C-oxidized Si0.701Ge0.277C0.022 sample with reference to the as-grown sample reveals a decrease of 600 cm⫺1substitutional carbon vibration peak, and an increases of silicon-carbide-like ab-sorption peak, similar to the 3C silicon carbide abab-sorption spectrum共Fig. 5兲.16
The quantitative analysis of substitutional carbon reduc-tion in Si1⫺x⫺yGexCy at high temperature process was
per-formed. A maximum reduction of 0.009 was observed for
various samples for annealing below 1000 °C in nitrogen, but kinetics of the substitutional carbon reduction is not clear. The interstitial Si injection can enhance the substitutional carbon reduction to 0.013. The oxidation of Si1⫺x⫺yGexCy
can inject the Ge into the unoxidized layer and can form a Ge-enriched layer.
The assistance of x-ray diffraction measurement by Pro-fessor M. Y. Chern, National Taiwan University is highly appreciated. The authors would also like to thank the group of Professor James Sturm at Princeton University for supply-ing the samples. This work is supported by National Science Council 共NSC 88-2218-E-002-004兲.
1J. L. Regolini, F. Gisbert, G. Dolino, and P. Boucaud, Mater. Lett. 18, 57
共1993兲.
2C. W. Liu, A. St. Amour, J. C. Sturm, Y. R. J. Lacroix, M. L. W. Thewalt,
C. W. Magee, and D. Eaglesham, J. Appl. Phys. 80, 3043共1996兲.
3P. Boucaud, C. Francis, F. H. Julien, J.-M. Lourtioz, D. Bouchier, S.
Bodnar, B. Lambert, and J. L. Regolini, Appl. Phys. Lett. 64, 875共1994兲.
4A. St. Amour, C. W. Liu, J. C. Sturm, Y. Lacroix, and M. L. W. Thewalt,
Appl. Phys. Lett. 67, 3915共1995兲.
5
C. Y. Lin and C. W. Liu, Appl. Phys. Lett. 80, 1441共1997兲.
6L. D. Lanzerotti, A. St. Amour, C. W. Liu, J. C. Sturm, J. K. Watanabe,
and N. D. Theodore, IEEE Electron Device Lett. 17, 334共1996兲.
7I. M. Anteney, G. Lippert, P. Ashburn, H. J. Osten, B. Heinemann, G. J.
Parker, and D. Knoll, IEEE Electron Device Lett. 20, 116共1999兲.
8P. Warren, J. Mi, F. Overney, and M. Dutoit, J. Cryst. Growth 157, 414
共1995兲.
9H. J. Osten, D. Endisch, E. Bugiel, B. Dietrich, G. G. Fischer, M. Kim, D.
Kruger, and P. Zaumseil, Semicond. Sci. Technol. 11, 1678共1996兲.
10
C. W. Liu, Y. D. Tseng, M. Y. Chern, C. L. Chang, and J. C. Sturm, J. Appl. Phys. 85, 2124共1999兲.
11H. J. Osten, J. Griesche, and S. Scalese, Appl. Phys. Lett. 74, 836共1999兲. 12P. Boucaud, L. Wu, C. Guedj, F. H. Julien, I. Sajnes, Y. Campidelli, and
L. Garchery, J. Appl. Phys. 80, 1414共1996兲.
13C. W. Liu, Y. D. Tseng, and M. Y. Chern共unpublished兲.
14T. Sinno, Z. K. Jiang, and R. A. Brown, Appl. Phys. Lett. 68, 3028共1996兲. 15P.-E. Hellberg, S.-L. Zhang, F. M. d’Heurle, and C. S. Petersson, J. Appl.
Phys. 82, 5773共1997兲.
16
C. W. Liu and J. C. Sturm, J. Appl. Phys. 82, 4558共1997兲. FIG. 4. The high-resolution x-ray diffraction spectra of a 40 nm
Si/Si0.701Ge0.277C0.022/Si quantum well.
FIG. 5. The Fourier transform infrared spectrum of a 40 nm
Si0.701Ge0.277C0.022sample, oxidized at 1000 °C for 2 h. The spectrum of 3C
silicon carbide is also shown for reference.
2273 Appl. Phys. Lett., Vol. 75, No. 15, 11 October 1999 Liu, Tseng, and Huang