O
NLINEF
IRSTORIGINAL ARTICLE
The Prevalence of Hearing Impairment
and Associated Risk Factors
The Beaver Dam Offspring Study
Scott D. Nash, MS; Karen J. Cruickshanks, PhD; Ronald Klein, MD, MPH; Barbara E. K. Klein, MD, MPH; F. Javier Nieto, MD, PhD; Guan H. Huang, PhD; James S. Pankow, PhD, MPH; Theodore S. Tweed, MS
Objective:To estimate the prevalence of hearing im-pairment (HI) and evaluate the cross-sectional associa-tions of environmental and cardiovascular disease risk factors and HI in middle-aged adults.
Design:Data were collected as part of the Beaver Dam Offspring Study, an epidemiological cohort study of ag-ing. Hearing impairment was defined as a pure-tone av-erage (0.5, 1.0, 2.0, and 4.0 kHz) greater than 25 db hear-ing level in either ear. Word recognition in compethear-ing message (WRCM) was measured using the Northwest-ern University No. 6 word list. Questionnaire informa-tion about behaviors, environmental factors, and medi-cal history was also collected.
Participants: The participants (N = 3285) were off-spring of participants of the population-based Epidemi-ology of Hearing Loss Study and ranged in age from 21 to 84 years (mean age, 49 years).
Results:The prevalence of HI was 14.1%, and the mean (SD) WRCM score was 64% (15%). In a multivariate
model, after age, sex, education, and occupational noise were controlled for, a history of ear surgery (odds ratio [OR], 4.11; 95% confidence interval [CI], 2.37-7.15), a larger central retinal venular equivalent (OR, 1.77; 95% CI, 1.20-2.60 [fourth quartile vs first quartile]), and a higher hematocrit percentage (OR, 0.77; 95% CI, 0.63-0.95 [per 5%]) were independently associated with HI. Factors associated with lower WRCM scores were simi-lar but also included mean intima-media thickness (mean difference, −0.63%; 95% CI, −1.06% to −0.19%; P = .005 [per 0.1 mm]) and statin use (mean difference, −2.09%; 95% CI, −3.58% to −0.60%; P = .005).
Conclusions:Hearing impairment is a common condi-tion in middle-aged adults. Cardiovascular disease risk factors may be important correlates of age-related audi-tory dysfunction.
Arch Otolaryngol Head Neck Surg. 2011;137(5):432-439. Published online February 21, 2011.
doi:10.1001/archoto.2011.15
H
EARING IMPAIRMENT(HI)is one of the most com-mon chronic conditions in older adults, affecting at least 29 million Ameri-cans.1Population-based epidemiological prevalence estimates range from 20.6% in adults aged 48 to 59 years to 90% in adults older than 80 years.2The 10-year incidence of HI in these 2 age groups has been estimated to be 22% and 100%, re-spectively.3Furthermore, the severity of this condition has been shown to be as-sociated with a poorer quality of life, communication difficulties, impaired ac-tivities of daily living, dementia, and cog-nitive dysfunction.4,5
Besides older age and male sex, envi-ronmental factors such as loud noise, so-cioeconomic status, and ear infections have been associated with HI.1,3,6-8Traditional
cardiovascular disease (CVD) risk fac-tors may also be important contribufac-tors to worse hearing, although the findings from different epidemiological cohorts have been inconsistent. Associations have been found between HI and a history of smoking6,9; CVD, including myocardial in-farction and stroke6,10; higher blood pres-sure or hypertension10,11; and diabetes.6,12 Most data regarding the association of CVD risk factors and HI have come from the study of cohorts of older persons, after noise and occupational exposures have ceased. Fewer studies have focused on risk factors for HI in younger adults in whom there may be other competing expo-sures. Recent reports from the National Health and Nutrition Examination Sur-vey (NHANES) (age range, 20-69 years) have shown that persons with increased occupational and firearm noise expo-Author Affiliations:
Departments of Population Health Sciences (Mr Nash and Drs Cruickshanks and Nieto) and Ophthalmology and Visual Sciences (Drs Cruickshanks, R. Klein, and B. E. K. Klein), University of Wisconsin School of Medicine and Public Health, and Department of
Communicative Disorders, University of Wisconsin (Mr Tweed), Madison; Institute of Statistics, National Chiao Tung University, Hsinchu, Taiwan, Republic of China (Dr Huang); and Division of Epidemiology and Community Health, University of Minnesota School of Public Health, Minneapolis (Dr Pankow).
sure, increased pack-years of smoking, and diabetes are more likely to have HI.8,13
Epidemiological data are needed to characterize the burden of HI across all adult age groups, especially in those younger than 60 years. Also, to investigate associations between CVD risk factors and HI, both pure-tone and speech audiometry (word recognition in competing mes-sage [WRCM]) were used in analytic modeling, as there may be both peripheral and central dysfunction in HI. Identifying possible modifiable risk factors may allow early interventions to delay the onset of HI and to diminish the impact on quality of life.
METHODS
The Epidemiology of Hearing Loss Study is an ongoing popu-lation-based cohort study that was started in 1993 in Beaver Dam, Wisconsin, to measure hearing outcomes and their risk factors. The original cohort comprised 3753 participants rang-ing in age from 48 to 92 years who were then followed up ev-ery 5 years. In 2005, the offspring of the Epidemiology of Hear-ing Loss Study participants were enrolled in the Beaver Dam Offspring Study (BOSS), a study of multisensory impairments and aging. Of the 4965 eligible offspring, 3285 (66.2%) par-ticipated in BOSS, 1657 (33.4%) did not participate, and 23 (0.5%) died. Data collection occurred from 2005 to 2008. The analysis for this report used data from those 2837 participants with audiometric data (86.4% of participants). The BOSS meth-ods were approved by the internal review board of the Univer-sity of Wisconsin, Madison, and all participants provided writ-ten informed consent.
The hearing examination included otoscopy, tympanom-etry, and pure-tone air- and bone-conduction audiometry as well as word recognition in quiet and in competing message (WRCM). All examiners were trained and certified in all study protocols. An abnormal otoscopic examination result was de-fined as drainage, a bulging or retracted eardrum, a visible air-liquid line, or a perforated eardrum. Consistent with guide-lines of the American Speech-Language-Hearing Association,14
audiometric testing was conducted in a sound-treated booth (Industrial Acoustics Co, New York, New York) using a clini-cal audiometer (GSI-61; Grason-Stadler, Eden Prairie, Minne-sota). Headphones (TDH-50; Telephonics, Farmingdale, New York) were used for air-conduction testing, and insert ear-phones (E-A-Rtone 3A; Cabot Safety Corp, Indianapolis, Indi-ana) and masking were used when appropriate.
Air-conduction thresholds were determined for each ear at 0.5, 1.0, 2.0, 3.0, 4.0, 6.0, and 8.0 kHz. The clinical audiom-eter was calibrated every 6 months according to American Na-tional Standards Institute standards.15Ambient noise levels were
routinely measured throughout the study to ensure that test-ing conditions remained within American National Standards Institute standards.16A pure-tone average (PTA) was
calcu-lated using the thresholds from the 0.5-, 1.0-, 2.0-, and 4.0-kHz frequencies. Hearing impairment was defined as a PTA (0.5, 1.0, 2.0, and 4.0 kHz) greater than 25 dB hearing level (HL) in either ear (worse ear). In our cohort, 93% of the population was concordant for HI status between ears.
Tests of word recognition in quiet and WRCM were con-ducted in a sound-treated booth using the Northwestern Uni-versity Auditory Test No. 6.17A 25-word word list was
pre-sented to the better ear at 36 dB HL above the individual’s threshold at 2 kHz (using a single female voice).17A
compet-ing message (scompet-ingle male talker) was then added at a level 8 dB HL below the speaker’s level in the better ear.17The WRCM
results were reported as percentage correct.
Trained interviewers administered a hearing-related medi-cal history and a noise exposure questionnaire that included questions about ear-related medical history such as Meniere dis-ease, otosclerosis, ear infections, and ear surgery. A positive his-tory of occupational noise exposure was defined as self-reported occupational noise exposure (holding a full-time job that required speaking in a raised voice or louder to be heard) or having driven a farm tractor without a cab.
Data collection included blood pressure measurements (Dy-namap Procare 120; GE Medical Systems, Milwaukee, Wiscon-sin), with hypertension defined as systolic blood pressure greater than or equal to 140 mm Hg, diastolic blood pressure greater than or equal to 90 mm Hg, or a self-reported physician diag-nosis of hypertension and current use of antihypertensive medi-cation. Height and weight were measured to calculate body mass index.2Obesity was defined as a body mass index greater than
or equal to 30 (calculated as weight in kilograms divided by height in meters squared).
Serum total cholesterol levels were measured using a double enzymatic process that produces hydrogen peroxide (Roche Hi-tachi 911; Roche HiHi-tachi, Indianapolis, Indiana). After further treatment with peroxidase, 40-aminophenazone, and phenol, a colored product was produced and then measured at 505 nm. Serum high-density lipoprotein cholesterol was measured the same way after the other lipoprotein fractions were precipi-tated off. The white blood cell count and hematocrit percent-age were measured in a complete blood cell count at the time of the blood draw. Hemoglobin A1cwas measured from whole
blood using a glycohemoglobin analyzer (A1c 2.2 Plus; TOSOH Bioscience, San Francisco, California). Diabetes status was de-fined as a self-report of physician diagnosis or an elevated he-moglobin A1Clevel greater than or equal to 6.5% at the time of
the examination.
Participants were considered to have a history of CVD if they self-reported having had a physician-diagnosed stroke, myo-cardial infarction, or angina. Carotid intima-media thickness (IMT) was measured at 6 sites in each carotid artery using B-mode ultrasonography (Biosound AU4; Biosound Esaote, In-dianapolis, Indiana).18,19Retinal vessel caliber measures—the
central retinal arteriolar equivalent (CRAE) and the central reti-nal venular equivalent (CRVE)—were obtained using Ivan soft-ware (Fundus Photograph Reading Center, Department of Oph-thalmology and Visual Sciences, University of Wisconsin) from digital eye fundus images centered on the optic disc (Canon Dgi-45NM Fundus Camera; Canon Inc, Paramus, New Jersey).20
These retinal vessel measures have been associated with car-diovascular and cerebrovascular disease in numerous epide-miological studies.20It is thought that CRAE and CRVE
rep-resent different pathophysiologic phenomena, with a decreased CRAE linked to increased blood pressure and an increased CRVE associated with inflammation and endothelial dysfunction.21
The questionnaire captured data on the highest education level obtained, the longest held job, and water source at age 13 years (municipal vs well water). Smoking was defined as ever having smoked more than 100 cigarettes. Pack-years were cal-culated for smokers (number of cigarettes smoked per day di-vided by 20 and then multiplied by the number of years smoked). A history of heavy drinking was defined as ever having con-sumed 4 or more alcoholic beverages daily. Participants were considered physically active if they currently engaged in a regu-lar activity long enough to work up a sweat at least once a week. Participants self-reported their use of statins and nonsteroidal anti-inflammatory drugs.
All analyses were performed using SAS version 9.2 (SAS In-stitute, Cary North Carolina) and Stata version 11.1 (Stata-Corp LP, College Station, Texas). Participants with audiomet-ric data were compared with nonparticipants and with those without audiometric data using2tests for categorical
vari-ables and t tests for continuous varivari-ables. Participants with HI that was asymmetrical (PTA difference between ears⬎20 dB) were excluded from models evaluating associations with HI (n = 70). Logistic regression was used to estimate odds ratios (ORs) and to examine risk factor associations. Selected risk fac-tors included those associated with HI in published articles as well as well-known markers of or risk factors for CVD. Age-and sex-adjusted models were first run for each potential in-dividual risk factor. Those that were associated with HI (P⬍.20) were then entered into a multivariable model. At that stage, those with insignificant P values (P⬎.05) that did not substantially change the other variables coefficients (±20%) when removed were left out of the final model. The associations between ex-posure variables and HI were examined for possible interac-tions with age and sex. Multivariable least squares regression was also used to estimate mean WRCM scores and to test for associations between exposure variables and WRCM using the same modeling approach.
Analyses were then performed by running the final multivari-able model with least squares regression procedures using the worse ear PTA as a continuous outcome. To minimize heterogeneity from multiple causes of HI, the final model was rerun excluding par-ticipants with hearing loss that developed before the age of 30 years, a history of ear surgery, or conductive hearing loss as well as the original exclusion criterion based on asymmetrical hearing loss (n=110). Because there is most likely a heritable component to HI, and participants in BOSS were recruited from families, models were rerun using the generalized estimating equation (GEE) method to account for reported familial relationships and to determine whether these relationships affected the results of the study.
RESULTS
Participation in BOSS tended to be higher among eli-gible persons living closest to Beaver Dam, Wisconsin Table 1. Select Characteristics in the Beaver Dam Offspring Study, 2005-2008a
Variable All (N = 3285) Women (n = 1795) Men (n = 1490) Age, mean (SD), y 49.2 (9.9) 49.0 (9.9) 49.5 (9.9) Education level, y ⱕ12 981 (30.1) 509 (28.7) 472 (31.9) 13-15 1092 (33.5) 628 (35.4) 464 (31.3) ⬎16 1184 (36.4) 639 (36.0) 545 (36.8)
Longest held jobb 757 (24.3) 188 (11.2) 569 (39.5)
Municipal water as a child 2464 (75.7) 1344 (75.8) 1120 (75.6)
Noisy job 1439 (43.9) 544 (30.3) 895 (60.2)
History of CVDc 109 (3.4) 38 (2.1) 71 (4.8)
Diabetes mellitusd 206 (6.3) 95 (5.3) 111 (7.5)
Hypertensione 1130 (38.4) 517 (32.3) 613 (45.8)
Obesef 1258 (44.7) 620 (40.6) 638 (49.6)
History of heavy drinking 596 (18.3) 180 (10.1) 416 (28.2)
Current smoking 578 (17.7) 286 (16.1) 292 (19.7) Smoking, pack-years 0 1784 (55.6) 1063 (60.6) 721 (49.5) ⱕ11 701 (21.8) 403 (23.0) 298 (20.5) ⬎11 725 (22.6) 288 (16.4) 437 (30.0) Weekly exercise 2020 (62.1) 1102 (62.2) 918 (62.0)
Total serum cholesterol, mean (SD), mg/dL 203.3 (39.3) 204.6 (38.6) 201.9 (40.1)
HDL serum cholesterol, mean (SD), mg/dL 50.0 (14.8) 55.2 (15.1) 43.9 (11.8)
White blood cell count, mean (SD), /µL 7300 (2400) 7400 (2000) 7300 (2800)
Hematocrit, % 43.6 (3.6) 41.8 (3.0) 45.7 (3.1)
Mean IMT, mean (SD), mm 0.7 (0.1) 0.6 (0.1) 0.7 (0.2)
CRVE, right eye, mean (SD), µm 224.4 (20.1) 223.5 (20.1) 225.4 (20.0)
CRAE, right eye, mean (SD), µm 150.1 (14.6) 151.4 (14.7) 148.6 (14.3)
Statin use 431 (15.2) 171 (11.0) 260 (20.1)
NSAID use 1694 (59.5) 922 (59.5) 772 (59.6)
History of ear infection 1804 (57.9) 1053 (61.8) 751 (53.2)
History of ear surgery 143 (4.4) 70 (3.9) 73 (5.0)
Meniere disease 17 (0.5) 11 (0.6) 6 (0.4)
Otosclerosis 18 (0.6) 15 (0.8) 3 (0.2)
Abnormal otoscopic examination result 20 (0.8) 11 (0.8) 9 (0.8)
Word recognition in quiet, % 89.6 (9.2) 91.1 (8.6) 88.0 (9.7)
Word recognition in competing message % 63.5 (14.7) 66.2 (12.5) 60.5 (16.3)
Abbreviations: CVD, cardiovascular disease; CRAE, central retinal arteriolar equivalent; CRVE, central retinal venular equivalent; HDL, high-density lipoprotein; IMT, intima-media thickness; NSAID, nonsteroidal anti-inflammatory drug.
SI conversion factors: To convert cholesterol values to millimoles per liter, multiply by 0.0259; white blood cell count to⫻109/L, multiply by 0.001. aValues are expressed as number (percentage) unless otherwise indicated. The numbers may not add up to 3285 because of missing values. bProduction/labor/manufacturing.
cPhysician-diagnosed stroke, myocardial infarction, or angina. dPhysician diagnosis and treated diabetes or elevated hemoglobin A
1Clevel greater than 6.5% at the time of the examination.
eSystolic blood pressure greater than or equal to 140 mm Hg, diastolic blood pressure greater than or equal to 90 mm Hg, or physician diagnosis of hypertension and currently taking hypertensive medication.
(P⬍.001). Participants also tended to be slightly older (48 years vs 46 years, respectively; P⬍.001) and were more likely to be women (54.6% vs 44.4%; P⬍.001) than nonparticipants. After adjustment for age, sex, and lo-cation of residence, there was a statistically significant difference in parental history of HI (OR, 1.21; 95% con-fidence interval [CI], 1.05-1.39) between those partici-pants with hearing examination data and those without (including both participants and nonparticipants).
Participants in BOSS ranged in age from 21 to 84 years (mean age, 49 years); 45.6% of the cohort were men; and 69.9% had more than 12 years of education (Table 1). There was a low prevalence of Meniere disease, otosclero-sis, ear surgery, and abnormal otoscopic examination re-sults (0.5%, 0.6%, 4.4%, and 0.8%, respectively). The mean (SD) word recognition score in quiet was 89.6% (9.2%), and the mean (SD) WRCM score was 63.5% (14.7%).
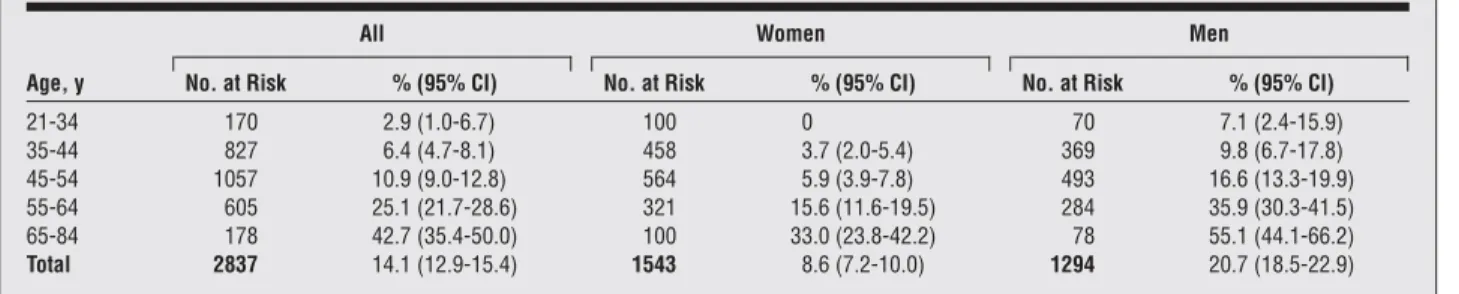
The overall prevalence of HI was 14.1% (95% CI, 12.9-15.4) and ranged from 2.9% in persons aged 21 to 34 years to 42.7% in those aged 65 to 84 years (Table 2). When analyses were run using the better ear instead of either ear (bilateral HI), the prevalence of HI was 6.8% (192 of 2837 participants) (95% CI, 5.8-7.7). After sex was con-trolled for, older age was associated with greater odds of HI (OR, 1.58; 95% CI, 1.48-1.67 [per 5-year increase]). Men were more likely than women to have HI after age was controlled for (OR, 3.0; 95% CI, 2.37-3.79).
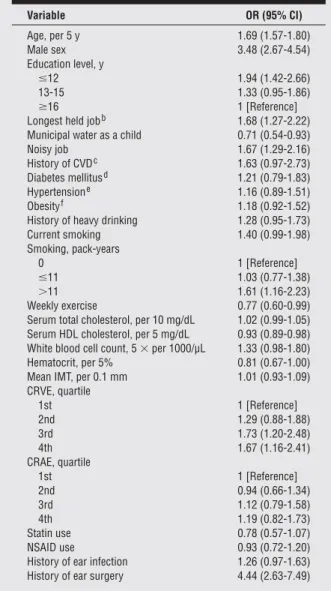
Age-sex-adjusted models for HI are shown inTable 3. Several traditional risk factors for CVD were signifi-cantly associated with HI, including pack-years of smok-ing (OR, 1.61; 95% CI, 1.16-2.23 [⬎11 vs 0 pack-years]). Hypertension, diabetes, and obesity were not associated with HI in this middle-aged cohort. Several environmental variables, such as having a noisy job, were associated with HI in age- and sex-adjusted models (OR, 1.67; 95% CI, 1.29-2.16).
In the final multivariable model, less education, a noisy job, a history of ear surgery, and a larger CRVE were as-sociated with an increased odds of HI. A higher hemat-ocrit percentage was associated with a decreased odds of HI (Table 4). Point estimates and CIs were essentially unchanged when the noisy job variable was limited to noise exposure at the participants’ primary job (exclud-ing tractor noise) and in GEE models account(exclud-ing for fa-milial relationships (results not shown).
Some individuals with HI reported a young age at on-set (ⱕ30 years) (n=116) or a history of ear surgery (n=44)
or had a measured conductive hearing loss (n=36). When the final model was rerun excluding this group (n = 110 with at least 1 condition), the results were similar to those in the whole cohort (Table 5). The main difference was that the hematocrit percentage was no longer statisti-cally significantly associated with HI.
After this model was evaluated using a continuous out-come (mean worse-ear PTA), the results were also simi-lar. Age (mean difference,⫹2.38; 95% CI, ⫹2.17 to ⫹2.58 [per 5 years]), male sex (mean difference,⫹5.86; 95% CI,⫹4.93 to ⫹6.79), lower levels of education (mean difference,⫹2.63; 95% CI, ⫹1.65 to ⫹3.60 [ⱕ12 years vsⱖ16 years]), a noisy job (mean difference, ⫹1.46; 95% CI,⫹0.64 to ⫹2.28), and a history of ear surgery (mean difference,⫹8.88; 95% CI, 6.87-10.89) were associated with a higher PTA, while the hematocrit percentage (mean difference, −0.82; 95% CI, −1.44 to −0.19 [per 5%]) was associated with a lower PTA.
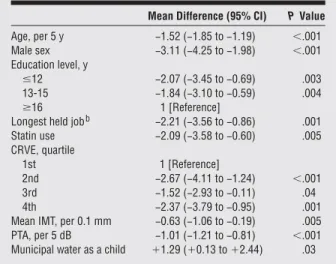
In a multivariable linear regression model with WRCM as a continuous outcome (Table 6), age; sex; education; PTA; reporting a longest held job in labor, production, or farming; statin use; a greater CRVE; and a greater mean IMT were statistically associated with lower mean WRCM scores. Participants who had municipal water as a child had higher scores than those who reported well water sources. The re-sults were similar in GEE models after familial relation-ships were accounted for (results not shown).
COMMENT
The prevalence of HI was 14.1% in this population of middle-aged adults. Although the prevalence of HI in BOSS was less than 10% among those younger than 45 years, it was substantially greater in older adults. Hear-ing impairment was more likely in men, in participants with lower education levels, and in those working in noisy occupations or with a history of ear surgery. Other tors associated with HI that could be considered risk fac-tors for CVD were a larger CRVE and a larger hemato-crit percentage. Central retinal venular equivalent (a microvascular measure), IMT (a macrovascular mea-sure), and statin use (a possible indicator of a clinician’s concern about high CVD risk) were associated with hear-ing measured by WRCM. These results suggest that there may be cardiovascular antecedents of HI, as measured by pure-tone or speech audiometry, which are detect-able even in middle age.
Table 2. Prevalence of Hearing Impairmentain the Beaver Dam Offspring Study, 2005-2008
Age, y
All Women Men
No. at Risk % (95% CI) No. at Risk % (95% CI) No. at Risk % (95% CI)
21-34 170 2.9 (1.0-6.7) 100 0 70 7.1 (2.4-15.9) 35-44 827 6.4 (4.7-8.1) 458 3.7 (2.0-5.4) 369 9.8 (6.7-17.8) 45-54 1057 10.9 (9.0-12.8) 564 5.9 (3.9-7.8) 493 16.6 (13.3-19.9) 55-64 605 25.1 (21.7-28.6) 321 15.6 (11.6-19.5) 284 35.9 (30.3-41.5) 65-84 178 42.7 (35.4-50.0) 100 33.0 (23.8-42.2) 78 55.1 (44.1-66.2) Total 2837 14.1 (12.9-15.4) 1543 8.6 (7.2-10.0) 1294 20.7 (18.5-22.9)
Abbreviation: CI, confidence interval.
The overall prevalence of HI in our study was similar to, although somewhat lower than, that in NHANES (16.1%), a nationwide estimate among adults younger than 65 years.1The small difference between this esti-mate of prevalence and ours could possibly be ex-plained by differences in the distributions of age, sex, race/ ethnicity, other characteristics related to HI, or sampling
variability. The Epidemiology of Hearing Loss Study, Framingham Heart Study, and Blue Mountains Hearing Study cohorts had similar prevalence estimates (46% in adults aged 48-92 years, 47% in adults 57-89 years, and 44.6% in adults aged⬎49 years, respectively).2,7,22
The most consistent cardiovascular factors associ-ated with worse hearing measured by PTA or WRCM in BOSS were microvasculature and macrovascular mea-surements. A larger CRVE was associated with both HI and WRCM, and a larger carotid artery IMT was associ-ated with WRCM. A few studies have examined the re-lationships between microvasculature and macrovascu-lar factors and HI. In the Blue Mountains Hearing Study, retinopathy was associated with HI in women, but wider retinal venular diameter and narrower retinal arteriolar Table 3. Age- and Sex-Adjusted Odds Ratios (ORs)
and 95% Confidence Intervals (CIs) for Hearing Impairmenta
in the Beaver Dam Offspring Study, 2005-2008
Variable OR (95% CI) Age, per 5 y 1.69 (1.57-1.80) Male sex 3.48 (2.67-4.54) Education level, y ⱕ12 1.94 (1.42-2.66) 13-15 1.33 (0.95-1.86) ⱖ16 1 [Reference]
Longest held jobb 1.68 (1.27-2.22)
Municipal water as a child 0.71 (0.54-0.93)
Noisy job 1.67 (1.29-2.16)
History of CVDc 1.63 (0.97-2.73)
Diabetes mellitusd 1.21 (0.79-1.83)
Hypertensione 1.16 (0.89-1.51)
Obesityf 1.18 (0.92-1.52)
History of heavy drinking 1.28 (0.95-1.73)
Current smoking 1.40 (0.99-1.98) Smoking, pack-years 0 1 [Reference] ⱕ11 1.03 (0.77-1.38) ⬎11 1.61 (1.16-2.23) Weekly exercise 0.77 (0.60-0.99)
Serum total cholesterol, per 10 mg/dL 1.02 (0.99-1.05) Serum HDL cholesterol, per 5 mg/dL 0.93 (0.89-0.98) White blood cell count, 5⫻ per 1000/µL 1.33 (0.98-1.80)
Hematocrit, per 5% 0.81 (0.67-1.00)
Mean IMT, per 0.1 mm 1.01 (0.93-1.09)
CRVE, quartile 1st 1 [Reference] 2nd 1.29 (0.88-1.88) 3rd 1.73 (1.20-2.48) 4th 1.67 (1.16-2.41) CRAE, quartile 1st 1 [Reference] 2nd 0.94 (0.66-1.34) 3rd 1.12 (0.79-1.58) 4th 1.19 (0.82-1.73) Statin use 0.78 (0.57-1.07) NSAID use 0.93 (0.72-1.20)
History of ear infection 1.26 (0.97-1.63)
History of ear surgery 4.44 (2.63-7.49)
Abbreviations: CVD, cardiovascular disease; CRAE, central retinal arteriolar equivalent; CRVE, central retinal venular equivalent; HDL, high-density lipoprotein; IMT, intima-media thickness; NSAID, nonsteroidal anti-inflammatory drug.
SI conversion factors: To convert cholesterol values to millimoles per liter, multiply by 0.0259; white blood cell count to⫻109/L, multiply by 0.001.
aPure-tone average (0.5, 1.0, 2.0, and 4.0 kHz) greater than 25 dB hearing level in either ear.
bProduction/labor/manufacturing vs management/technical/service. cPhysician-diagnosed stroke, myocardial infarction, or angina. dPhysician diagnosis and treated diabetes or an elevated hemoglobin A
1C level greater than 6.5% at the time of the examination.
eSystolic blood pressure greater than or equal to 140 mm Hg, diastolic blood pressure greater than or equal to 90 mm Hg, or physician diagnosis of hypertension and currently taking hypertensive medication.
fBody mass index greater than or equal to 30 (calculated as weight in kilograms divided by height in meters squared).
Table 4. Multivariate Odds Ratios (ORs) and 95% Confidence Intervals (CIs) for Hearing Impairmentain 2612 Participants
in the Beaver Dam Offspring Study, 2005-2008
Variable OR (95%CI) Age, per 5 y 1.70 (1.58-1.83) Male sex 3.80 (2.76-5.25) Education level, y ⱕ12 1.79 (1.27-2.52) 13-15 1.19 (0.83-1.70) ⱖ16 1 [Reference] Noisy job 1.57 (1.19-2.08)
History of ear surgery 4.11 (2.37-7.15) CRVE, quartile 1st 1 [Reference] 2nd 1.37 (0.93-2.03) 3rd 1.66 (1.14-2.42) 4th 1.77 (1.20-2.60) Hematocrit, per 5% 0.77 (0.63-0.95)
Abbreviation: CRVE, central retinal venular equivalent.
aPure-tone average (0.5, 1.0, 2.0, and 4.0 kHz) greater than 25 dB hearing level in either ear.
Table 5. Multivariate Odds Ratios (ORs) and 95% Confidence Intervals (CIs) for Sensorineural Hearing Impairmenta
in 2517 Participantsbin the Beaver Dam Offspring Study,
2005-2008 Variable OR (95% CI) Age, per 5 y 1.99 (1.81-2.19) Male sex 3.74 (2.55-5.50) Education level, y ⱕ12 1.77 (1.17-2.69) 13-15 1.18 (0.76-1.84) ⱖ16 1 [Reference] Noisy job 1.45 (1.03-2.04) CRVE, quartile 1st 1 [Reference] 2nd 1.40 (0.88-2.22) 3rd 1.59 (1.01-2.52) 4th 1.69 (1.06-2.69) Hematocrit, per 5% 0.81 (0.63-1.03) Abbreviation: CRVE, central retinal venular equivalent.
aPure-tone average (0.5, 1.0, 2.0, and 4.0 kHz) greater than 25 dB hearing level in either ear.
bExcludes participants with a hearing loss that developed before the age of 30 years, a history of ear surgery, conductive hearing loss, and hearing asymmetries greater than 20 dB.
diameter were not associated with HI in either men or women.23It is not known what accounts for the differ-ences between studies. The CRVE is associated with reti-nal tissue hypoxia, systemic inflammation, and high lipid and glucose levels. Some of these measures have been hy-pothesized to be involved in the pathogenesis of HI.12,13 Intima-media thickness is a subclinical measure of ath-erosclerosis, which predicts adverse cardiovascular out-comes.24Therefore, these results may add support to a possible cardiovascular link to HI.
Participants taking statin drugs had lower mean WRCM scores then those not taking statins. Statin drugs are mostly prescribed to persons with high cholesterol levels. Al-though serum cholesterol levels themselves were not as-sociated with WRCM scores in BOSS, individuals who were taking statins may represent the ones with the worst cholesterol level profiles. Lipids have been implicated in the atherosclerotic process and may indirectly influ-ence blood flow to both the brain and the microvascu-lature of the ear. The WRCM task may be capturing age-related changes in the central auditory cortex.
Participants with a higher hematocrit percentage were less likely to have HI, contrary to the expectation that the hematocrit is strongly correlated with, and can act as a marker of, blood viscosity.25Increased viscosity has been shown to be associated with increased blood pres-sure and ischemic heart disease as well as with dimin-ished oxygen levels in the cochlea in animal models.25-27 Gates et al10found no association between hematocrit and hearing thresholds in the Framingham cohort. Other stud-ies have shown that individuals with worse hearing or hearing loss had increased blood viscosity or hemato-crit levels.28The contradictory results of this study could be attributable to the possibility that (1) the hematocrit percentage is an imperfect surrogate for blood viscosity; (2) that blood vessels may be less atherosclerotic in middle-aged adults and therefore more resilient to in-creases in viscosity; or (3) that hematocrit levels in per-sons in this age range may be more a reflection of diet or vitamin use. Alternatively, low hematocrit levels could also damage hearing because of associated impairment in oxygen transport. Low hematocrit levels and anemia have been linked to CVD and cardiomyopathy.29,30
Socioeconomic status was associated with worse hear-ing when measured either by PTA (education) or by WRCM (longest held job, municipal water as a child). Municipal water as child (as opposed to well water) could be a marker of either increased socioeconomic status or decreased exposure to substances such as pesticides in drinking water. Prevalence and incidence studies from the Epidemiology of Hearing Loss Study2,3as well as na-tional prevalence estimates from NHANES have shown associations with HI and level of education and occupa-tion.1Although persons with lower levels of education may tend to work in occupations that have higher levels of noise exposure (such as production, labor, or manu-facturing), the education-HI association remained after occupational noise was controlled for. Low socioeco-nomic status may be associated with less healthy behav-iors and less access to health care and has been consis-tently shown to be associated with CVD and therefore may be associated with HI through a CVD pathway.31
Although several CVD risk factors were associated with HI in this study, smoking, diabetes, and hyperten-sion were not. The lack of associations may be attribut-able to the younger age of this cohort or to the fairly low prevalence of prevalent CVD (3.4%), diabetes (6.3%), and smoking exposure (17.7% current smokers; 22.6%⬎11 pack-years). Agrawal et al8used a much higher cut point for pack-years of smoking and had a higher prevalence of diabetes, which may have allowed them increased power for detecting an association in NHANES. Although 38.4% of the current cohort was considered hypertensive, data were not available to assess the duration of hypertension, and because of the young mean age in BOSS, these participants may not have had hypertension long enough to have affected hearing.
Participants with a history of a noisy job and a his-tory of ear surgery had increased odds of having HI. Relationships between occupational noise and worsen-ing hearworsen-ing have been shown in many contexts, includ-ing large population-based cohort studies.2,6,7A report using NHANES data showed that individuals with occupational loud noise exposure had a 60% increased odds of HI.8 Our assessment of occupational noise exposure was based on self-report, which may result in an underestimation of the effects of noise exposure. It is possible that there remained some residual confounding owing to noise in our multivariate models. Participants with ear surgery reported procedures such as tympano-plasty and mastoidectomy, which can have clear direct effects on hearing.
In this study, HI was defined by the PTA in the worse ear to avoid underestimation of the prevalence of HI. Al-though this definition may increase the heterogeneity of types of HI, it is a useful measure of the number of per-sons with HI in the cohort and has been used in other
Table 6. Multivariate Mean Differences and 95% Confidence Intervals (CIs) for Word Recognition in Competing Message in 2597 Participants in the Beaver Dam Offspring Study, 2005-2008a
Mean Difference (95% CI) P Value
Age, per 5 y −1.52 (−1.85 to −1.19) ⬍.001 Male sex −3.11 (−4.25 to −1.98) ⬍.001 Education level, y ⱕ12 −2.07 (−3.45 to −0.69) .003 13-15 −1.84 (−3.10 to −0.59) .004 ⱖ16 1 [Reference]
Longest held jobb −2.21 (−3.56 to −0.86) .001
Statin use −2.09 (−3.58 to −0.60) .005 CRVE, quartile 1st 1 [Reference] 2nd −2.67 (−4.11 to −1.24) ⬍.001 3rd −1.52 (−2.93 to −0.11) .04 4th −2.37 (−3.79 to −0.95) .001
Mean IMT, per 0.1 mm −0.63 (−1.06 to −0.19) .005
PTA, per 5 dB −1.01 (−1.21 to −0.81) ⬍.001
Municipal water as a child ⫹1.29 (⫹0.13 to ⫹2.44) .03 Abbreviations: CRVE, central retinal venular equivalent; IMT, intima-media thickness; PTA, pure-tone average (0.5, 1.0, 2.0, and 4.0 kHz).
aModel R2= 0.20.
epidemiological studies of HI.1-3,8,9,12In this cohort, 93% of the participants were concordant between ears.
Other studies have used other combinations of fre-quencies or other audiogram patterns to reduce the hetero-geneity inherent in cross-sectional studies of HI. How-ever, we have previously shown in population-based cohorts that most cases of HI have a typical sensorineu-ral pattern, with high frequencies affected more than, and before, lower frequencies.32There were too few individu-als with a flat hearing loss in the low range to support subset analyses (n = 16). To assess the impact of hetero-geneity of HI, we conducted subset analyses that ex-cluded cases in which the HI might be attributable to trauma or middle ear problems. In the subset of partici-pants (n = 2517) in which those with an onset of HI be-fore the age of 30 years, a history of ear surgery, or con-ductive or asymmetrical hearing loss were excluded, the risk factor model results were similar to those in the whole population.
There are few current epidemiological studies that have measured hearing in middle-aged adults.33The BOSS co-hort had a large sample size, data were collected using standardized protocols and accepted methodologies, and there were multiple hearing end points, allowing a clearer understanding of factors associated with HI. Using both pure-tone and speech audiometry measures, we found consistent evidence of associations between cardiovas-cular risk factors and HI. Responses to tone and speech audiometric tests reflect the function of the auditory sys-tem, including central processing, but the additional com-plexity of speech understanding may make these tasks better indicators of central processing. Our findings with tones and WRCM suggest that age-related changes in the cochlear and central auditory association areas may con-tribute to HI in adults.
This study was cross-sectional and could not demon-strate causal relationships. As described in the “Results” section, participants in BOSS had significantly higher odds of a parental history of HI than nonparticipants, and it has been shown that HI is highly heritable, with esti-mates ranging from 47% to 68%, depending on the sta-tistical adjustments for confounders.34 Therefore, our study may have an overestimated prevalence of HI in white adults. Overestimation was probably unlikely, how-ever, since the prevalence of HI in BOSS (14.1%) was close to, and even lower than, a national estimate from the NHANES for non-Hispanic whites (18.0%).1 Further-more, when GEE models were used to allow clustering of participants based on family structure, associations and their standard errors between risk factors and HI dif-fered only slightly. Despite biological plausibility and pre-defined statistical procedures, some of the associations found in multivariable modeling may have been attrib-utable to type 1 errors.
In conclusion, this study described the prevalence of HI in a cohort of adults ranging in age from 21 to 84 years and identified possible modifiable correlates (CRVE, he-matocrit percentage, statin use, and mean IMT) of audi-tory dysfunction measured by HI and WRCM, suggest-ing that HI, if detected early, may be a preventable chronic disease.
Submitted for Publication: April 29, 2010; final revi-sion received November 30, 2010; accepted December 9, 2010.
Published Online: February 21, 2011. doi:10.1001 /archoto.2011.15
Correpondence: Scott D. Nash, MS, Department of Popu-lation Health Sciences, University of Wisconsin School of Medicine and Public Health, 610 N Walnut St, Rm 1036 WARF, Madison, WI 53726 ([email protected]). Author Contributions: All authors had full access to all the data in the study and take responsibility for the in-tegrity of the data and the accuracy of the data analysis. Study concept and design: Nash and Cruickshanks. Ac-quisition of data: Nash, Cruickshanks, B. E. K. Klein, and Tweed. Analysis and interpretation of data: Nash, Cruick-shanks, R. Klein, Nieto, Huang, and Pankow. Drafting of the manuscript: Nash. Critical revision of the manu-script for important intellectual content: Nash, Cruick-shanks, R. Klein, B. E. K. Klein, Nieto, Huang, Pankow, and Tweed. Statistical analysis: Nash, Cruickshanks, and Huang. Obtained funding: Cruickshanks and Nieto. Ad-ministrative, technical, and material support: B. E. K. Klein and Tweed. Study supervision: Cruickshanks.
Financial Disclosure: None reported.
Funding/Support: This study was supported in part by R01AG021917 from the National Institute on Aging, the National Eye Institute, and the National Institute on Deaf-ness and Other Communication Disorders.
Disclaimer: The content is solely the responsibility of the authors and does not necessarily reflect the official views of the National Institute on Aging or the National Insti-tutes of Health.
Previous Presentation: This study was presented in part at the Annual American Auditory Society Meeting; March 7, 2009; Scottsdale, Arizona.
REFERENCES
1. Agrawal Y, Platz EA, Niparko JK. Prevalence of hearing loss and differences by demographic characteristics among US adults: data from the National Health and Nutrition Examination Survey, 1999-2004. Arch Intern Med. 2008;168(14): 1522-1530.
2. Cruickshanks KJ, Wiley TL, Tweed TS, et al. Prevalence of hearing loss in older adults in Beaver Dam, Wisconsin: the Epidemiology of Hearing Loss Study. Am
J Epidemiol. 1998;148(9):879-886.
3. Cruickshanks KJ, Nondahl DM, Tweed TS, et al. Education, occupation, noise exposure history and the 10-yr cumulative incidence of hearing impairment in older adults. Hear Res. 2010;264(1-2):3-9.
4. Dalton DS, Cruickshanks KJ, Klein BEK, Klein R, Wiley TL, Nondahl DM. The im-pact of hearing loss on quality of life in older adults. Gerontologist. 2003;43 (5):661-668.
5. Uhlmann RF, Larson EB, Rees TS, Koepsell TD, Duckert LG. Relationship of hear-ing impairment to dementia and cognitive dysfunction in older adults. JAMA. 1989; 261(13):1916-1919.
6. Helzner EP, Cauley JA, Pratt SR, et al. Race and sex differences in age-related hearing loss: the Health, Aging and Body Composition Study. J Am Geriatr Soc. 2005;53(12):2119-2127.
7. Mos´cicki EK, Elkins EF, Baum HM, McNamara PM. Hearing loss in the elderly: an epidemiologic study of the Framingham Heart Study Cohort. Ear Hear. 1985; 6(4):184-190.
8. Agrawal Y, Platz EA, Niparko JK. Risk factors for hearing loss in US adults: data from the National Health and Nutrition Examination Survey, 1999 to 2002. Otol
Neurotol. 2009;30(2):139-145.
9. Cruickshanks KJ, Klein R, Klein BEK, Wiley TL, Nondahl DM, Tweed TS. Ciga-rette smoking and hearing loss: the Epidemiology of Hearing Loss Study. JAMA. 1998;279(21):1715-1719.
10. Gates GA, Cobb JL, D’Agostino RB, Wolf PA. The relation of hearing in the el-derly to the presence of cardiovascular disease and cardiovascular risk factors.
Arch Otolaryngol Head Neck Surg. 1993;119(2):156-161.
11. Brant LJ, Gordon-Salant S, Pearson JD, et al. Risk factors related to age-associated hearing loss in the speech frequencies. J Am Acad Audiol. 1996; 7(3):152-160.
12. Dalton DS, Cruickshanks KJ, Klein R, Klein BEK, Wiley TL. Association of NIDDM and hearing loss. Diabetes Care. 1998;21(9):1540-1544.
13. Bainbridge KE, Hoffman HJ, Cowie CC. Diabetes and hearing impairment in the United States: audiometric evidence from the National Health and Nutrition Ex-amination Survey, 1999 to 2004. Ann Intern Med. 2008;149(1):1-10. 14. American Speech-Language-Hearing Association. Guidelines for manual pure tone
audiometry. ASHA. 1978;20(4):287-301.
15. American National Standards Institute. Specifications for Audiometers. New York, NY: ANSI; 1989:S3.6.
16. American National Standards Institute. Maximum Permissible Ambient Noise
Lev-els for Audiometric Test Rooms. New York, NY: ANSI; 1992:S3.1.
17. Wiley TL, Cruickshanks KJ, Nondahl DM, Tweed TS, Klein R, Klein BEK. Aging and word recognition in competing message. J Am Acad Audiol. 1998;9(3): 191-198.
18. The ARIC Study Group. High-resolution B-mode ultrasound scanning methods in the Atherosclerosis Risk in Communities Study (ARIC). J Neuroimaging. 1991; 1(2):68-73.
19. The ARIC Study Group. High-resolution B-mode ultrasound reading methods in the Atherosclerosis Risk in Communities (ARIC) cohort. J Neuroimaging. 1991; 1(4):168-172.
20. Knudtson MD, Lee KE, Hubbard LD, Wong TY, Klein R, Klein BE. Revised for-mulas for summarizing retinal vessel diameters. Curr Eye Res. 2003;27(3): 143-149.
21. Sun C, Wang JJ, Mackey DA, Wong TY. Retinal vascular caliber: systemic, en-vironmental, and genetic associations. Surv Ophthalmol. 2009;54(1):74-95. 22. Chia EM, Wang JJ, Rochtchina E, Cumming RR, Newall P, Mitchell P. Hearing
impairment and health-related quality of life: the Blue Mountains Hearing Study.
Ear Hear. 2007;28(2):187-195.
23. Liew G, Wong TY, Mitchell P, Newall P, Smith W, Wang JJ. Retinal
microvas-cular abnormalities and age-related hearing loss: the Blue Mountains Hearing Study. Ear Hear. 2007;28(3):394-401.
24. Lorenz MW, Markus HS, Bots ML, Rosvall M, Sitzer M. Prediction of clinical car-diovascular events with carotid intima-media thickness: a systematic review and meta-analysis. Circulation. 2007;115(4):459-467.
25. de Simone G, Devereux RB, Chien S, Alderman MH, Atlas SA, Laragh JH. Rela-tion of blood viscosity to demographic and physiologic variables and to cardio-vascular risk factors in apparently normal adults. Circulation. 1990;81(1):107-117.
26. Yarnell JWG, Baker IA, Sweetnam PM, et al. Fibrinogen, viscosity, and white blood cell count are major risk factors for ischemic heart disease: the Caerphilly and Speedwell collaborative heart disease studies. Circulation. 1991;83(3):836-844.
27. Hildesheimer M, Rubinstein M, Nuttal AL, Lawrence M. Influence of blood vis-cosity on cochlear action potentials and oxygenation. Hear Res. 1982;8(2): 187-198.
28. Gatehouse S, Gallacher JE, Lowe GD, Yarnell JW, Hutton RD, Ising I. Blood vis-cosity and hearing levels in the Caerphilly Collaborative Heart Disease Study. Arch
Otolaryngol Head Neck Surg. 1989;115(10):1227-1230.
29. Pereira AA, Sarnak MJ. Anemia as a risk factor for cardiovascular disease.
Kid-ney Int Suppl. 2003;64(87):S32-S39.
30. Hegde N, Rich MW, Gayomali C. The cardiomyopathy of iron deficiency. Tex Heart
Inst J. 2006;33(3):340-344.
31. Kaplan GA, Keil JE. Socioeconomic factors and cardiovascular disease: a review of the literature. Circulation. 1993;88(4 Pt 1):1973-1998.
32. Wiley TL, Chappell R, Carmichael L, Nondahl DM, Cruickshanks KJ. Changes in hearing thresholds over 10 years in older adults. J Am Acad Audiol. 2008;19 (4):281-292, 371.
33. Zhan W, Cruickshanks KJ, Klein BE, et al. Generational differences in the preva-lence of hearing impairment in older adults. Am J Epidemiol. 2010;171(2): 260-266.
34. Raynor LA, Pankow JS, Miller MB, et al. Familial aggregation of age-related hear-ing loss in an epidemiological study of older adults. Am J Audiol. 2009;18(2): 114-118.