國
立
交
通
大
學
資訊科學與工程研究所
碩
士
論
文
基於支援向量機之新生兒篩檢系統
Newborn Screening System Based on Support Vector Machine
研 究 生:吳建宏
指導教授:謝筱齡、鍾崇斌 教授
基於支援向量機之新生兒篩檢系統
Newborn Screening System Based on Support Vector Machine
研 究 生: 吳建宏 Student:Jian-Hong Wu
指導教授: 謝筱齡 Advisor:Sheau-Ling Hsieh
鍾崇斌 Chung-Ping Chung
國 立 交 通 大 學
資 訊 科 學 與 工 程 研 究 所
碩 士 論 文
A ThesisSubmitted to Institute of Computer Science and Engineering College of Computer Science
National Chiao Tung University in partial Fulfillment of the Requirements
for the Degree of Master
in
Computer Science Jan 2008
Hsinchu, Taiwan, Republic of China
i
基於支援向量機之新生兒篩檢系統
學生 : 吳建宏 指導教授 : 謝筱齡 教授
鍾崇斌 教授
國立交通大學資訊科學與工程研究所 碩士班
摘要
新生兒篩檢系統是用血液去檢驗新生兒新陳代謝相關的先天異常疾病,因為 這些先天異常的疾病若能及早診斷,並給予適當的治療或預防,使之不至於發病 造成身心永久性的傷害,例如智能不足等嚴重之後果。所以這些疾病可以利用新 生兒篩檢系統的功能來達到預防及早治療的目的,則病患就有正常成長的機會或 將此疾病的後遺症降至最低。 在本論文,我們提出一個基於支援向量機的新生兒篩檢系統。我們利用支援 向量機優異的資料分類功能,對於串聯質譜儀分析出的新陳代謝物濃度數據做預 測,評估此新生兒是否罹患先天性新陳代謝異常的疾病。在服務導向架構 SOA 下,我們將支援向量機的功能架構在分散式環境,,利用中介軟體 Web Services 整 合異質的平台、服務與資料庫。利用此系統來預測新生兒是否罹患甲基丙二酸血 症,它的敏感度 Sensitivity 可於由傳統 Cut-Off Value 方法的 76%提升到超過 99%。ii
Newborn Screening System Based on Support Vector Machine
Student : Jian-Hong Wu Advisor : Dr. Sheau-Ling Hsieh
Dr. Chung-Ping Chung
Institute of Computer Science and Engineering
College of Computer Science
National Chiao Tung University
Abstract
The clinical symptoms of metabolic disorders during neonatal period are often not apparent, if not treated early irreversible damages such as mental retardation may occur, even death. Therefore, practicing newborn screening is very important to prevent neonatal from these damages.
In this thesis, we propose the newborn screening system that using support vector machines (SVM) classification technique to evaluate the metabolic substances concentration raw data obtained from tandem mass spectrometry (MS/MS) and determine whether the newborn has some kind of metabolic disorder diseases. With concept of Service-Oriented Architecture, we design the system using Web Services technique which is suitable for integrating heterogeneous platforms, protocols and applications. In this system, the predicting accuracy (sensitivity) of MMA could be improved from 76% (cut-off value approach) to over 99%
Key words: Newborn Screening, Tandem Mass Spectrometry, Support Vector Machine, Web Services
iii
誌謝
首先感謝我的指導教授 鍾崇斌、 謝筱齡教授,在他們的諄諄教誨,辛勤指 導與勉勵下,得以順利完成此篇論文。 特別是感謝 謝筱齡教授,她有如對子女 般的照顧我們這些學生,不論是學業上,生活經濟上都給予最大的幫助,讓我心 中充滿了無限的感激與感謝。同時感謝我的口試委員 林正中、 陳延禎教授,在 他們的建議之下,使此篇論文更加完整。 感謝臺大醫院的 謝嵩淮學長,在整個研究過程,他總是不厭其煩的回答我 的疑問,並提供相當多寶貴的意見與資料,特別是在研究遇到困難時,他的開導 與鼓勵讓我有力量去面對。 另外感謝諸位同學和學弟妹們,你們的陪伴讓我的生活充滿歡樂;也讓我的 研究所生更加的多采多姿與充實。最後感謝我的家人,謝謝你們在我的求學過程 全心全意的支持、關懷與鼓勵我,對我來說,我想沒有人比你們更加重要了。 謹向所有交大的師長與同學,奉上我最誠摯的感謝與祝福,謝謝你們。iv
Table of Contents
摘要... i Abstract ... ii 誌謝... iii Table of Contents ... iv List of Figures ... viList of Tables ... viii
Chapter 1 Introduction... 1
1.1 Preface ... 1
1.2 Motivation and Objectives ... 3
Chapter 2 Background ... 5
2.1 Newborn Screening ... 5
2.2 Tandem Mass Spectrometry (MS/MS) ... 7
2.3 Cut-Off Value ... 8
2.4 NTUH Newborn Screening Information System ... 9
2.5 NTUH MS/MS Newborn Screening Analysis ... 12
Chapter 3 Methodology ... 14
3.1 Support Vector Machine ... 14
3.2 Service Oriented Architecture - Web Services Approach ... 21
Chapter 4 System Architecture and Design ... 26
4.1 System Architecture ... 26
4.2 Software Components ... 27
4.2.1 Screening Client ... 27
4.2.2 SVM Methods based on Web Services... 29
4.2.3 Newborn Screening Database ... 33
4.2.4 Data Access Web Services ... 33
4.3 Sequences and Dataflow Diagram ... 34
Chapter 5 Implementation ... 36
5.1 Data Schema ... 36
v
Chapter 6 Measurements & Experimental Results ... 43
6.1 Metabolic data ... 43
6.2 Evaluation of classifier’s accuracy and validation ... 43
Chapter 7 Conclusion and Future Work ... 48
vi
List of Figures
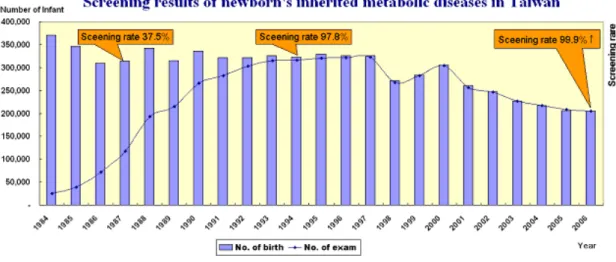
Figure 1.1 Screening Results of Newborn’s Metabolic Diseases in Taiwan ... 2
Figure 2.1 Tandem Mass Spectrometer Operating Sequence ... 7
Figure 2.2 Raw Data File of MS/MS ... 8
Figure 2.3 Cut-Off Value Method ... 9
Figure 2.4 Newborn Screening Process Flowchart ... 10
Figure 2.5 The Phlebotomy Filter Paper ... 11
Figure 2.6 Screenshot of The Specimen Collection Subsystem ... 11
Figure 2.7 The Mathematical Expressions Editor ... 13
Figure 3.1 Optimal Separating Hyperplane ... 14
Figure 3.2 Margin of Hyperplane ... 15
Figure 3.3 Mapping Data Vector into High-Dimensional Feature Space ... 16
Figure 3.4 Mapping Function ψ ... 16
Figure 3.5 Example of One Dimension Non Linearly Separable Data Vector ... 16
Figure 3.6 Support Vector Machine Operation Diagram ... 19
Figure 3.7 The 5-fold Cross-Validation Example ... 20
Figure 3.8 A Exhaustive Grid Search Example ... 20
Figure 3.9 NTUH SGNSISA... 21
Figure 3.10 Service Oriented Architecture Pattern ... 23
Figure 3.11 SOAP Message Structure ... 25
Figure 3.12 SOAP Binding: Passed Message Using an Underlying Protocol ... 25
Figure 4.1 SVM Newborn Screening Information System Architecture ... 27
Figure 4.2 Physician Site: Screening Client ... 28
Figure 4.3 SVM Engine Functionalities ... 29
Figure 4.4 SVM Training Web Services ... 30
Figure 4.5 Tuning Parameters (C,γ) to Optimize the Model Selection ... 31
Figure 4.6 SVM Predicting Web Services ... 32
Figure 4.7 SVM Scaling Web Services ... 32
Figure 4.8 Data Access Web Services ... 33
Figure 4.9 System Operational Scenarios and Sequences ... 34
Figure 5.1 Data Schema of Newborn Screening Database ... 36
Figure 5.2 The Format of Trained Model ... 37
Figure 5.3 Class Diagram of svm_train ... 38
Figure 5.4 Class Diagram of svm_predict ... 39
vii
Figure 5.6 Scaling Value From [min, max] to [lower, upper] ... 40 Figure 6.1 Flowchart of Grid-Search and Cross-Validation ... 46 Figure 6.2 Loose Grid Search on C = 2-5~215 and γ=2-15~23 ... 47
viii
List of Tables
Table 1 11 routine items of SGNS Program in Taiwan ... 6
Table 2 Overview of metabolites measured from MS/MS analysis ... 6
Table 3 Classification accuracy of three SVM approaches ... 44
Table 4 Comparison of Accuracy between Cut-Off Value and SVM ... 45
Table 5 Discriminatory Performance of Cut-Off Value and SVM ... 45
1
Chapter 1 Introduction
1.1 Preface
The clinical symptoms of metabolic disorders during neonatal period are often not apparent, if not treated early irreversible damages such as mental retardation will occur, even death. The permanent damages can be avoided if these diseases are able to be detected biochemically by newborn screening in the early stage of life, and treated immediately with relevant therapies and intervention. Therefore, practicing newborn screening can make difference between lifelong impairment and healthy development.
In Taiwan, method development pilot programs (including dried blood sample collecting, screening tests, confirmatory diagnostic procedures and treatments) were carried out in mental retarded children between 1982 and 1983. Based on the methods developed, the nationwide project to set up newbornl screening for congential hypothyroidism(CHT), phenylketonuria(PKU), maple syrup urine disease(MSUD), homocystinuria(HCU), and galactosemia(GAL) was started in January 1984. After the nationwide newborn screening system was established in July 1985, the method for screening of glucose-6-phosphate dehydrogenase (G6PD) deficiency was developed. The incidence of G6PD deficiency was estimated to be about 2% (male 3%, female 0.9%) in Taiwan based on the screening program. Since no MSUD was found from 200,000 newborns screened, after two year (1985-1987) pilot study on G6PD screening, MSUD was replaced by G6PD in the routine nationwide newborn screening program [1].
2 Newborn screening using tandem mass spectrometry (MS/MS) started in Taiwan in 2000. MS/MS is rapidly replacing these one-analysis, one-metabolite, one-disease classic screening techniques with a one-analysis, many-metabolites, many-diseases approach. Screening methodology using MS/MS, there are more than 20 inherited metabolic disorders can be detected simultaneously from a single blood spot by quantifying concentration of up to 35 metabolites.
In July 2006, the Second Generation Newborn Screening Program is applied nationwide in Taiwan, besides the 5 routine items should be kept, congenital adrenal hyperplasia (CAH), MSUD, medium chain acyl-CoA dehydrogenase deficiency (MCAD), glutaric aciduria Type I (GAI), methylmalonic aciduria (MMA) and isovaleric academia (IVA) were included as routine items.
Figure 1.1 presents the screening results of newborn’s inherited metabolic diseases in Taiwan from the previous years. Its screening rate improved from 6.4% in 1984 to reaching over 99.9% in the past few years.
3
1.2 Motivation and Objectives
NTUH (National Taiwan University Hospital) initiated its research on newborn screening in 1981, and has received and carried on the nation’s newborn screening for metabolic diseases since July, 1985. As medical science progressing, more and more advanced newborn screening tests are issued, required. To meet the demands, the hospital has developed and launched the Second Generation Newborn Screening Information System (SGNSIS) [2] to improve, enhance the effectiveness of the system while dealing with large and complex data as well as leading to faster and more accurate diagnoses.
As applying the SGNSIS nationwide in Taiwan, innovations and refinements of the screening methodology using modern tandem mass spectrometry (abbreviated as MS/MS) becomes increasingly important. MS/MS can quantify concentrations of up to 35 metabolites simultaneously from a single blood spot. Consequently, it leads to high dimensional data for each newborn. Thus, there are two issues raised.
First, the classic cut-off value screening technique cannot perform adequately or accurately while handling high dimensional data. Moreover, based on the technique, lower predicting accuracies for metabolic disorder diseases can occur. For instance, the sensitivity (Sn) of MMA (Methylmalonic Aciduria) is about 76%. The inadequate
accuracy can cause newborns losing the opportunities to be treated earlier if they have the metabolic disorder diseases.
Secondly, the initiation of a screening test is based on the past clinical experience for the targeted diseases. Undoubtedly, most screening programs including the MS/MS can detect mild variants of diseases. The natural history of these variant forms of diseases is still not clearly understood. Now MS/MS can provide large amount of data. Therefore, we can perform data mining process in order to retrieve, classify more knowledge about these variant diseases.
Machine learning techniques offer an obvious and promising approach to examine high dimensional data. Thus, the goal of the paper is to design, implement a newborn screening analysis system. The system utilizes machine learning techniques, i.e., SVM, and mining knowledge to construct the classification models for metabolic
4 disorders screening and diagnosis. The models possess high discriminatory power. In addition, the system has been developed based on middleware, SOA technologies, i.e., Web Services .NET. It can integrate diverse platforms, database as well as further merging, extending into NTUH Hospital Information System.
5
Chapter 2 Background
2.1 Newborn Screening
Newborn screening is the practice of testing every neonate for certain congenital metabolic disorders, often called “inborn errors of metabolism”. A child with any of these diseases usually appears normal at birth but would already be seriously ill by the time symptoms appeared. In general, these metabolic disorders can be addressed by effective therapies before they harm the infant. If not diagnosed or treated in time, it may lead to mental retardation, illness, and/or death in the affected children.
To check if the baby suffers from these congenital metabolic disorders, a nurse of a professional at the hospital/clinic of birth will pick the baby’s heel to collect several drops of blood after the baby is 48 hours old. The blood sample will be sent to a newborn screening center appointed by the Bureau of Health Promotion (BHP). Government offers subsides for the newborn screening of the metabolic disorders (listing in Table 1).
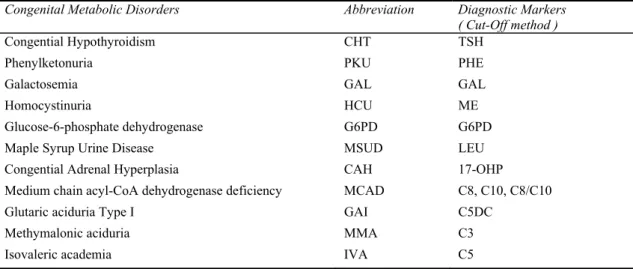
6 Table 1 11 routine items of Second Generation Newborn Screening Program in Taiwan
Congenital Metabolic Disorders Abbreviation Diagnostic Markers
( Cut-Off method )
Congential Hypothyroidism CHT TSH Phenylketonuria PKU PHE Galactosemia GAL GAL Homocystinuria HCU ME Glucose-6-phosphate dehydrogenase G6PD G6PD Maple Syrup Urine Disease MSUD LEU Congential Adrenal Hyperplasia CAH 17-OHP Medium chain acyl-CoA dehydrogenase deficiency MCAD C8, C10, C8/C10 Glutaric aciduria Type I GAI C5DC
Methymalonic aciduria MMA C3 Isovaleric academia IVA C5
New and refined screening methodologies based on tandem mass spectrometry of metabolites have been developed for routine deployment. Using tandem mass spectrometry, there are more than 20 metabolic disorders can be detected simultaneously from a single blood spot by quantifying concentrations of up to 35 metabolites (10 amino acids and 25 fatty acids , see Table 2) [3].
Table 2 Overview of metabolites measured from MS/MS analysis
Amino acids Fatty acids Fatty acids
Alanine (ALA) Free carnitine (C0) Decenoyl-carnitine (C10:1) Arginine (ARG) Acetyl-carnitine (C2) Dodecanoyl-carnitine (C12) Citrulline (CIT) Propionyl-carnitine (C3) Dodecenoyl-carnitine (C12:1) Glycine (GLY) Malonyl-carnitine (C3DC) Myristoyl-carnitine (C14) Leucine (LEU) Butyryl-carnitine (C4) Myristoleyl-carnitine (C14:1) Methionine (MET) Dicarboxyl-butyryl-carnitine (C4DC) Hydroxytetradecadienoyl-carnitine (C14OH)
Ornitine (ORN) Isovaleryl-carnitine (C5) Hexadecanoyl-carnitine (C16) Phenylalanine (PHE) Glutaryl-carnitine (C5DC) Hexadecenoyl-carnitine (C16:1)
Tyrosine (TYR) Hydroxy-isovaleryl-carnitine (C5OH) Hydroxypalmitoyl-carnitine (C16OH)
Valine (VAL) Hexanoyl-carnitine (C6) Octadecanoyl-carnitine (C18) Octanyl-carnitine (C8) Octadecenoyl-carnitine (C18:1)
Octenyl-carnitine (C8:1) Hydroxyoleyl-carnitine (C18:1OH) Decanoyl-carnitine (C10)
7
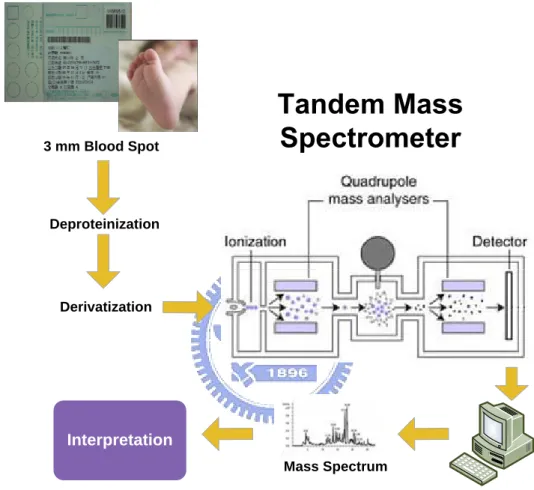
2.2 Tandem Mass Spectrometry (MS/MS)
The tandem mass spectrometry (MS/MS) is an analytical method that uses two mass analyzers to perform the separation and analysis of mixture components after ionizing them. The Operating Sequence shown in Figure 2.1.
Deproteinization
Derivatization 3 mm Blood Spot
Mass Spectrum
Interpretation
Figure 2.1 Tandem Mass Spectrometer Operating Sequence
A mass spectrometer separates ions based on their mass/charge (m/z) ratios. Characteristic patterns of fragments and relative peak intensities in the resulting spectrum allow qualitative as well as quantitative determination of chemical compounds. By coupling two mass spectrometers, usually separated by a reaction chamber or collision cell, the modern tandem mass spectrometry (MS/MS) allows simultaneous analysis of multi-compounds in a high-throughput process.
8 MS/MS has been used for several years to identify and measure carnitine ester concentrations in blood and urine of children suspected of having inborn errors of metabolism. Indeed, acylcarnitine analysis is a superior diagnostic test for disorders of fatty acid oxidation because abnormal levels of related metabolites are detected before the patient is acutely ill. More recently, MS/MS has been used in pilot programs to screen newborns for these conditions and for disorders of amino acid and organic acid metabolism as well. MS/MS thus permits very rapid, sensitive and, with internal standards, accurate quantitative measurement of many different types of metabolites by conversion of raw mass spectra into clinically meaningful results (concentrations, shown in Figure2.2) [4-7].
Figure 2.2 Raw Data File of MS/MS
2.3 Cut-Off Value
Depicted in Figure 2.3, Cut-Off value is a threshold of concentration value of metabolism. The samples, which exceed the cut-off values in the primary tests, are submitted to the confirmatory tests with the same cards. If the result is successively positive, the baby is required to recall on the maternity hospital and to send us the second sample.
9
Figure 2.3 Cut-Off Value Method
2.4 NTUH Newborn Screening Information System
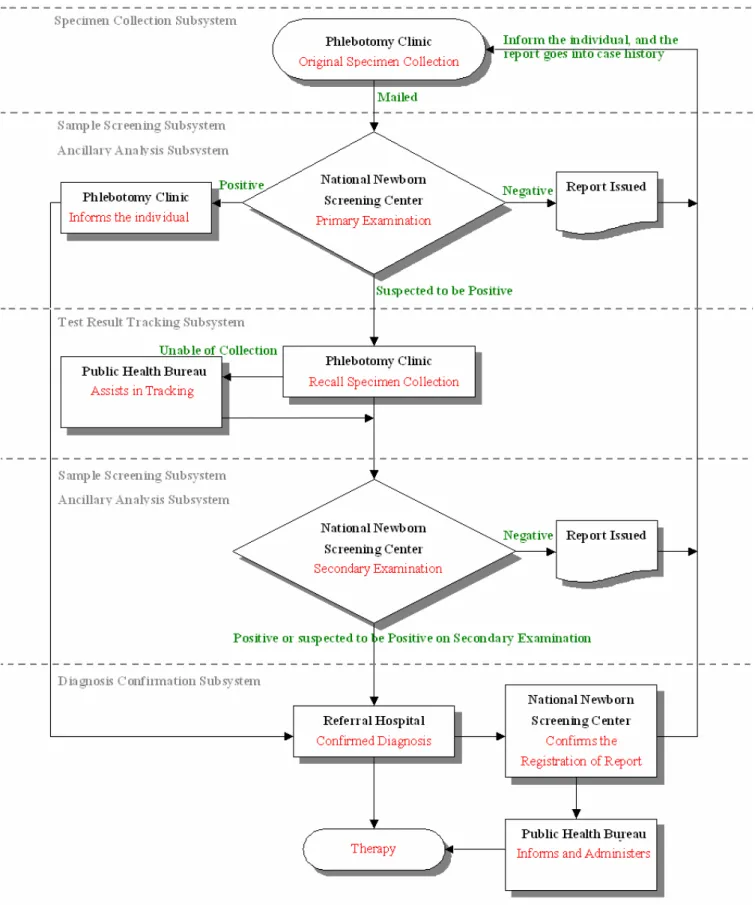
NTUH simultaneously holds the responsibilities of a national newborn screening center, phlebotomy clinic, and referral hospital; hence its subsystems include all procedures of a newborn screening process, from the very first phlebotomy to the eventual diagnosis (shown in Figure 2.4) [2]. There are four subsystems as the following:
Specimen Collection Subsystem
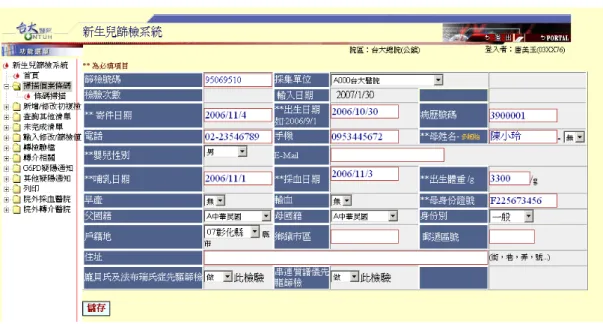
The phlebotomy clinics collects the specimen, registers the infant’s information online, prints out individual barcode label, places the label on the phlebotomy filter paper (Figure 2.5), and then delivers all newborns’ phlebotomy filter papers to the NTUH national newborn screening center every day via mail. As soon as the national newborn screening center receives them, laboratory serial numbers are assigned to each of them on the upper right side; meanwhile, the newborn’s information can be stored into the database through barcode scanning or manual input, completing a preliminary sample registration. The screenshot is illustrated in Figure 2.6. The phlebotomy clinic may also track the status of the samples by checking it on the subsystem, which may read as “received” or “not yet delivered”.
10
11
Figure 2.5 The Phlebotomy Filter Paper
Figure 2.6 Screenshot of The Specimen Collection Subsystem
Sample Screening Subsystem
Next, technicians place the specimens into experimental apparatus to analyze the blood compound and to obtain the raw data file of its concentration. The obtained data is examined by the subsystem to check whether its metabolic substances are within a normal range. If the result comes out negative, the certain case is directly stored into the database. Yet if the result comes out of borderline, for fear of instrumental misjudgment, the specimen will undergo a second examination on the following day, and create a new retest file to serve as the final result to go into the database. The
12 subsystem simultaneously creates a list of suspected positive casebooks for the doctors and technicians to interpret.
Test Result Tracking Subsystem
The corresponding preliminary test results of such suspected positive cases are checked and signed by the doctor and then sent back to the original phlebotomy clinic. The phlebotomy clinic is responsible for tracking cases and obtaining recall specimens and once again sending them to then national newborn screening center. Yet this time, if the result once again comes out positive, the subsystem will send an e-mail notice both to the phlebotomy clinic and the referral hospital regarding cases that have a positive result. Within three days, the parents of the newborns will be able to track online the information of test results and of the referral hospital.
Diagnosis Confirmation Subsystem
By this stage, the referral hospital is in charge of tracing the cases. The hospital provides the positive cases with preliminary precaution advice and confirmed diagnosis. Its duty also includes filling up the doctor-approved diagnosis and completing the result report under this subsystem. After filling them up, the result report will be delivered via e-mail to the national newborn screening center, public health bureau, and the original phlebotomy clinic, completing the whole newborn screening procedure.
2.5 NTUH MS/MS Newborn Screening Analysis
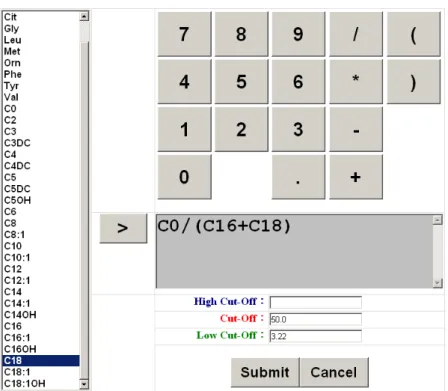
Mathematical tool
This tool provides a mathematical expressions editor that allow the creation of new expression markers ((C16+C18)/C0, for instance). This new expression marker will automatically process a mathematical operation on the newborn metabolic substances records in the database, and determine whether it is abnormal or not according to the cut-off value established by the editor.
13
Figure 2.7 The Mathematical Expressions Editor
Statistical tool
The MS/MS newborn screening analysis that NTUH is currently using establishes its cut-off value of the examined metabolic substances concentration according to the data of a certain month of the previous years, referring to the following rules:
1. Descriptive Statistics a. Mean value
b. Standard Deviation c. Percentile
2. The Incidence of Normal population 3. Disease value
a. Number of Suffering Cases
b. Number of Suffering Cases not revealed through examination c. Documental Reference Domestically and Internationally 4. Prediction according to Clinical Experience
14
Chapter 3 Methodology
In this chapter, we will introduce two techniques we used. One is Support Vector Machine (SVM) and the other is Web Services. We use SVM classifier to predict whether the newborn has the metabolic disorder disease. The SVM Methods are implemented using Web Services technique to integrate diverse platforms and database.
3.1 Support Vector Machine
Support Vector Machine (SVM) is a new generation learning system based on recent advances in statistical learning theory [8]. It has been widely and successfully applied to many real world classification problems such as text categorization, image detection, biochemical technology [9-11], etc. In the most cases, the generalization performance of SVM is outstanding. In this subsection, we will give a brief introduction.
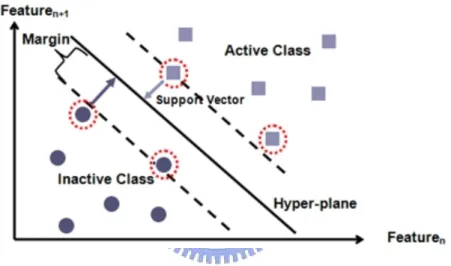
15 The basic idea of an SVM classifier is that the set of binary labeled training data vectors can be separated by a hyperplane. In the simplest case of a linear hyperplane there may exist many possible separating hyperplanes. Consider the example in Figure 3.1. Here there are many possible linear classifiers that can separate the data, but among them, the SVM classifier seeks the separating hyperplane that produces the largest separation margin (maximizes the distance between it and the nearest data point of each class, shown in Figure 3.2). This linear classifier is termed to the optimal separating hyperplane. The hyperplane with maximal margin is the ultimate learning goal in statistical learning theory, and will probably perform well in classifying the new data.
Figure 3.2 Margin: Distance Between Hyperplane and The Nearest Data Point of Each Class
Such a scheme is known to be associated with structural risk minimization to find a learning machine that yields a good trade-off between low empirical risk and small capacity.
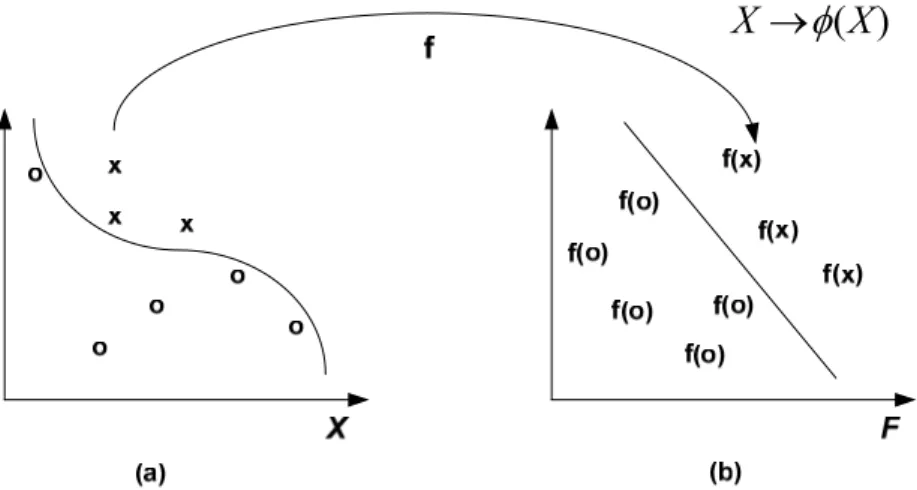
In the more general case in which the data points are not linearly separable in the input space (shown in Figure 3.3(a)), a non-linear transformation is used to map the data vector x into a high-dimensional feature space prior to applying the linear maximum-margin classifier (shown in Figure 3.3(b), Figure 3.4).
16
) (X
X →
φ
Figure 3.3 Mapping Not Linearly Separable Data Vector into High-Dimensional Feature Space
Φ Φ
Figure 3.4 Mapping Function ψ: Maps Samples into Higher Dimension Feature Space
17 As shown in Figure 3.5(a), it is a nonlinearly-separable one-dimension data vector. But after mapping the data vector by a mapping function into two dimension space, it become can separated by a linearly hyperplane (shown in Figure 3.5 (b)).
To avoid over-fitting in this higher dimensional space, an SVM uses kernel functions (polynomial and Gaussian radial basis kernels are the most common) in which the nonlinear mapping is implicitly embedded. With the use of a kernel, the decision function in a SVM classifier has the following form:
x α ,
where K(·,·) is the kernel function, xi are the so-called support vectors determined
from training data, LS is the number of support vectors, yi is the class indicator
associated with each xi , and αi , the Lagrange multipliers. In addition, for a given
kernel it is necessary to specify the cost factor c, a positive regularization parameter that controls the trade-off between complexity of the machine and the allowed classification error. More detail about SVM, please refer to the literatures [12-13]. To design an effective SVM model, values of parameters in SVM have to be chosen carefully in advance [14]. These parameters include the following.
1. A kernel function used in SVM, which constructs a non-linear decision hyperplane in an input space.
2. Regularization parameter C, which determines the tradeoff cost between minimizing the training error and minimizing the complexity of the model.
3. Parameter of the kernel function which define the nonlinear mapping from the input space to some high-dimensional feature space.
18
RBF Kernel
Because the mapping function ψ may be a very complicated expression, there is a computational problem working with very large vectors and a generalization theory problem curse of dimensionality. So we need to use kernels to solve the computational problem of working with many dimensions. They can make it possible to use infinite dimensions efficiently in time and space [15].
Though there are four common kernels, we used the SVM with its simplest case of a linear hyperplane and with radial basis function (RBF) kernel. Because the RBF kernel non-linearly maps samples into a higher dimensional space, it can handle the case when the relation between class labels and attributes in nonlinear. The second reason is the number of hyperparameters which influences the complexity of model selection. Finally, the RBF kernel has less numerical difficulties.
Model Selection
There are two parameters while using RBF kernels: C and γ. It is not known beforehand which C and γ are the best for one problem; consequently some kind of model selection (parameter search) must be done.
The goal is to identify good (C, γ) so that the classifier can accurately predict unknown data, i.e., testing data. Note that it may not be useful to achieve high training accuracy (i.e., classifiers accurately predict training data whose class labels are indeed known). Therefore, a common way is to separate training data to two parts of which one is considered unknown in training the classifier (shown in Figure 3.6). Then the prediction accuracy on this set can more precisely reflect the performance on classifying unknown data. An improved version of this procedure is k-fold cross-validation.
19
Figure 3.6 Support Vector Machine Operation Diagram
Cross-validation
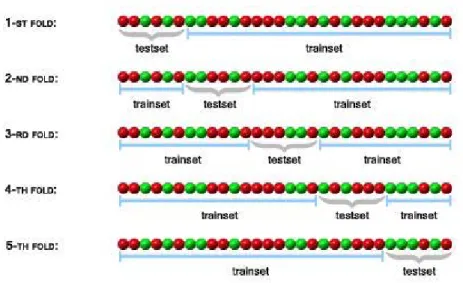
In k-fold cross validation, the training data is randomly split into k mutually exclusive subsets of approximately equal size. Sequentially one subset is tested using the classifier trained on the remaining k-1 subsets. This procedure is repeated k times and in this fashion each subset is used for testing once. The cross-validation accuracy is the percentage of data which correctly classified [16]. The Figure 3.7 is a 5-fold cross-validation example.
20
Figure 3.7 The 5-fold Cross-Validation Example
Except estimate methods, the mechanisms of searching for parameter sets that make SVMs resulting model perform well is important, too. The most common and reliable approach for model selection is exhaustive grid search method.
Grid-search
When searching for a good combination of parameters for C and γ, it is usual to form a two dimension uniform grid (say p × p) of points in a pre-specified search range (for example, C = 2-5, 2-3,…, 215, γ= 215, 2-13,…,23) and find a combination (point) that gives the least value for some estimate of generalization error. It is expensive since it requires the trying of p × p pairs of (C, γ). Figure 3.8 is a grid search example where p = 5.
21
Scaling
Scaling data vector before applying SVM is very important [17]. The main advantage is to avoid attributes in greater numeric ranges dominate those in smaller numeric ranges. Another advantage is to avoid numerical difficulties during the calculation. Because kernel values usually depend on the inner products of feature vectors, large attribute values might cause numerical problems.
3.2 Service Oriented Architecture - Web Services Approach
NTUH Second Generation Newborn Screening Information System (SGNSIS) is a 4–tier infrastructure and Service-Oriented Architecture (SOA) platform. The overall SGNSIS frameworks are depicted in Figure 3.9. So we choose SOA as our Newborn Screening System based on Support Vector Machine developing and deploying platform.
Figure 3.9 NTUH Second Generation Newborn Screening Information System Architecture
22 SOA is a software architecture where functionality is grouped around business processes and packaged as interoperable services. SOA also describes IT infrastructure that allows different applications to exchange data with one another as they participate in business processes.
The aim is a loose coupling of services with operating systems, programming languages and other technologies which underlying those applications [18]. These services inter-operate based on a formal definition (e.g., WSDL [21]). The interface definition hides the implementation of the language-specific service. SOA-based systems can therefore be independent of development technologies and platforms (such as Java, .NET etc.). Services written in C# running on .NET platforms and services written in Java running on Java EE platforms can both be consumed by a common composite application (client). Applications running on either platform can also consume services running on the other as Web Services.
SOA represents a model in which functionality is decomposed into small distinct units or services [19], which can be distributed over a network and can be combined together and reused to create business applications [20]. These services communicate with each other by passing data from one service to another, or by coordinating an activity between two or more services. SOA concepts are often seen as an evolution of distributed computing [19-20] and modular programming.
Web Services can be used to implement a SOA. A major focus of Web Services is to
make functional building blocks accessible over standard Internet protocols that are independent from platforms and programming languages. These services can be new applications or just wrapped around existing legacy systems to make them network-enable.
Each SOA building block can play one or more than three roles (depicted in Figure 3.10):
23 Service Provider
The service provider creates a Web Services and possibly publishes its interface and access information to the service registry. Each provider must decide which services to expose, how to make trade-offs between security and easy availability. The provider also has to decide what category the service should be listed in for a given broker service and what sort of trading partner agreements are required to use the service.
24 Service Registry
The service registry is responsible for making the Web Service interface and implementation access information available to any potential service requestor. The implementer of the broker decides about the scope of the broker. Public brokers are available through the Internet, while private brokers are only accessible to a limited audience, for example, users of a company intranet (NTUH as this case). Furthermore, the amount of the offered information has to be decided. Some brokers specialize in many listings. Others offer high levels of trust in the listed services. Some cover a broad landscape of services and others focus within an industry. There are also brokers that catalog other brokers. Depending on the business model, brokers can attempt to maximize look-up requests, number of listings or accuracy of the listings. The Universal Description Discovery and Integration (UDDI) [22] specification defines a way to publish and discover information about Web services.
Service Requestor
The service requestor or Web Service client locates entries in the broker registry using various find operations and then binds to the service provider in order to invoke one of its Web Services
Core Specifications of Web Services
Web services specifications compose together to provide interoperable protocols for Security, Reliable Messaging, and Transactions in loosely coupled systems. The specifications build on top of the core XML and SOAP standards.
XML
The Extensible Markup Language (XML) [23] is a general-purpose markup language. It is classified as an extensible language because it allows its users to define their own tags. Its primary purpose is to facilitate the sharing of data across different information systems, particularly via the Internet
25
SOAP
Simple Object Access Protocol (SOAP) [24] is a protocol for the exchange of information in a decentralized, distributed environment. It is an XML-based protocol that consists of three parts: an envelope that defines a framework for describing what is in a message and how to process it, a set of encoding rules for expressing instances of application-defined data types, and a convention for representing remote procedure calls and responses (shown in Figure 3.11). Depicted in Figure 3.12, SOAP can potentially be used in combination with a variety of other protocols like HTTP and SMTP.
Figure 3.11 SOAP Message Structure
26
Chapter 4 System Architecture
and Design
4.1 System Architecture
The system architecture contains three major portions: Client, Server (Engine) and Database. The Client Site, i.e., accessing by Physicians or medical staffs, provides a friendly graphical user interface as well as the logics interact with the Server Site and the Database. At the Server or Engine Site, we implement all the SVM functionalities, i.e., SVM Training, SVM predicting, SVM scaling and Data Access Logic, embedded under the Web Services .NET environment. The Database stores the Newborn Screening data collected from MS/MS and SVM classifiers, or Trained Models, generated by the Training Service. All components in the system use the XML (eXtensible Markup Language) format as exchanging messages, as well as the communication mechanism based on SOAP (Simple Object Access Protocol) over HTTP handling by the .NET environment internally.
27
Figure 4.1 Support Vector Machine Newborn Screening Information System Architecture
4.2 Software Components
The detailed descriptions of the components are provides in this Section.
4.2.1 Screening Client
The screening client is an application (shown in Figure 4.2). It provides a friendly graphical user interface. The application supports functionalities as listed below:
(a) Read or input the metabolic substances concentration data presented as an Excel file, generated by the Tandem Mass Spectrometry. The application concerts or transforms the file into a DataSet (the format required by .NET). The concentration data can be either a set of data retrieved from well known
28 metabolic diseases to establish SVM Trained Model (classifier) or a set of unknown data to be verified for diagnosis, analyzing later.
(b) Invoke the SVM Training Method and obtain the Trained Model, i.e., SVM classifier, as the return value. The Model is later stored into the Newborn Screening System Database.
(c) Pass a newborn’s Dataset and a Trained Model as parameters to the SVM Predicting Method; according to the Predicting result, determine whether the neonatal has metabolic disorder disease specified by the Trained Model. (d) Storing the result into the Newborn Screening System Database
Screening Client Tandem Mass
Sepctrometry
Excel File DataSet (Test or Verify) .NET Server Analyses & Diagnoses Screening Results DataSet (Construct model) Scaled Screening DataSet Network Classifier Model Training DataSet Scaled Training DataSet Training DataSet Classifier Model Newborn Screening Database SVM Predicting SVM Scaling SVM Training Grid Search Optimizer (C,γ)
29
4.2.2 SVM Methods based on Web Services
The Server, or the SVM Engine, supports the following functionalities, methods.
Figure 4.3 SVM Engine Functionalities
4.2.2.1 SVM Training Method
The main functionality (svm_train, indicated in Figure 4.3) of the method is to perform separating the metabolic substances dataset retrieved from the System Database, proceed optimizing, and generate the Trained Model (classifier). In the diagram, there are accessory functions to support the training processes as well.
After the SVM Engine receives a request from the Client to verify a set of testing data (as shown in Figure 4.4, (1)), the SVM Training Module, method, queries the System Database and obtains the Training DataSet (as indicated in Figure 4.4, (2) & (3)). Both the Testing DataSet and the Training DataSet need to be scaled before passing to the SVM Training and the SVM Predicting Modules (as shown in Figure 4.4, (2) & (5) respectively). According to the scaled, Trained DataSet (in Figure 4.4, (5)), the
svm_train function will generate, return a classifier, or Trained Model, and store the
30
Figure 4.4 SVM Training Web Services
While constructing the classifier, the optimization processes are performed repeatedly to increase the accuracy of the Model. The accuracy of the SVM Model is largely dependent on the selection of the model parameters, i.e., C and Gamma. A Grid Search and an RBF (Radial Basis Function) kernel function with two parameters C and Gamma are used to optimize the model selection (as shown in Figure 4.5). During the computational iteration, the ranges of parameters, C and Gamma, are resizing accordingly [16]. Therefore, the classifier, or Trained Model, can accurately predict an unknown dataset, or the Testing DataSet.
31
SVM classifier
Training Data RBF default (C,γ) Testing Data Accuracy calculation Termination Criteria Grid Algorithm Optimized (C,γ) New (C,γ) No YesFigure 4.5 Tuning Parameters (C,γ) to Optimize the Model Selection
4.2.2.2 SVM Predicting Method
SVM Predicting the module performs predicting of a scaled Testing DataSet (as shown in Figure 4.6, (2)) according to a Trained Model. The Trained Model is retrieved from the System Database, previously stored by the SVM Training Module (as shown in Figure 4.6, (7) & (8)). The Predicting Method returns the screening results, display them, and store them into the System Database for further analyses and diagnoses. The outcomes classify, or interpret the possibilities of metabolic disorder diseases.
32 .NET Server Analyses & Diagnoses Screening Results Scaled Screening DataSet Classifier Model Training DataSet Scaled Training DataSet Training DataSet Classifier Model Newborn Screening Database SVM Predicting SVM Scaling SVM Training Grid Search Optimizer (C,γ)
Figure 4.6 SVM Predicting Web Services
4.2.2.3 SVM Scaling Method
Depicted in Figure 4.7, The SVM Scaling method scales the Testing DataSet and Training DataSet into the same range, then return the Scaled DataSet. The SVM Scaling function is to avoid data attributes, either Testing DataSet or Training DataSet, in larger numeric ranges and induce calculating difficulties.
33
4.2.3 Newborn Screening Database
There are following data stored in Newborn Screening Database:
1. Newborn’s profile, which including elements like anamnesis id, name, date of birth, sex, parents, address, telephone number and so on
2. Each newborn’s concentrate of metabolites transformed by Screening Client 3. Congenital metabolic disorders list
4. Trained Model generated by SVM Training Method
5. Scaling Range for scaling the Training and Testing DataSet into the same range
4.2.4 Data Access Web Services
The Data Access Web Services provide interfaces to either Clients or the SVM methods Web Services accessing the Newborn Screening System Database.
34
4.3 Sequences and Dataflow Diagram
The sequence diagram of the SOA Newborn Screening System operational scenarios are depicted in Figure 4.9. The System has integrated SVM mechanisms, i.e., Training, Scaling, Predicting Modules, etc, under the Web Services .NET environment.
At beginning, our experimental dataset is collected according to anonymous and subset of all data obtained from the Newborn Screening Centre of NTUH between years 2001 and 2006. Blood samples, which have been taken within a few days after the newborns’ birth, have been analyzed by MS/MS in a high throughput process and the measured metabolic datasets (35 measured metabolites including amino acids, long fatty acid chains and acyl carnitines) have been saved in Excel files and stored in a database. In this study we focus on improving the accuracy of identifying the MMA (Methylmalonic Academia) metabolic disease primarily. The approaches can definitely extend to analyze other diseases as well.
Tandem Mass
Spectrometry SVM Training SVM Predicting Screening Clinet SVM Scaling Data Access Logic Get MS/MS result Excel file
Input Excel file Invoke SVM Training
ACK
Display Predicting Result
Return Predicting Result
Request Training Dataset
Return Training Dataset
Store Trained Model Scaling the Training Dataset
Return Scaled Training Dataset
Pass Dataset, invoke SVM
Predicting Request Trained Model
Store Max, Min Value of Marker
Return Trained Model Scaling DataSet
Return Scaled DataSet
Request Max, Min Value of Marker Return Max, Min Value of Marker
Confirmed case
Store Confirmed Case to DataBase
Newborn Screening Data
Base
35 In the diagram, after the experimental dataset, the Excel file, transformed into DataSet at the Screening Client site, the data are randomly selected to separate into two portions. One portion is the training data. They can be used for constructing the Trained Model. Another portion is used as testing data for the Predicting process. Both data are resided temporarily at the Client Site for training and predicting processes. The results can be analyzed and diagnosed to clarify the accuracy of the research. The approaches are depicted clearly in the diagram. First, invoking the SVM Training Service, additional optimization processes are proceeded repeatedly in order to obtain a higher accurate classifier. The classifier is utilized by the SVM Predicting Service as an input parameter. Before activated both Services, the input datasets, either the Training DataSet or the Testing DataSet for prediction, are scaled via the SVM Scaling Service to avoid data attributes in larger numeric ranges and induce calculating difficulties. Requests and responses among the associated components in the operational scenarios are clearly indicated in Figure 4.9.
36
Chapter 5 Implementation
In this Chapter, we present some strategies of implementation for prototype of the Newborn Screening System based on Support Vector Machine. The system is written in C# language running on .NET platform. We modify functions (svm_train,
svm_predict and svm_scale) provided from the LIBSVM 2.6 C# edition [25] as Web
Services. We first describe the Data Schema of the Newborn Screening Database.
5.1 Data Schema
37 There are four tables in the Newborn Screening Database:
svm_screening: it stores the concentrations of metabolites of one test. The primary key anamnesis_id is anamnesis id of each newborn, screening_id means that the newborn may do more than one test (i.e. primary test, confirmatory test), every test has respective screening_id.(shown in Figure 5.1 (a))
metabolic_disease: there are more than 20 metabolic disorders can be detected simultaneously using MS/MS. In our study, we focused on the metabolic disease MMA, so we use MMA as example. The Boolean stored in field MMA is the result that display whether the newborn has MMA disease. The primary key is
screening_id. (shown in Figure 5.1 (b))
trained_model: as we mention in Section 4.2.2.1, this table stores the Trained Model generated by the svm training function. Each metabolic disease has respective Trained Model, so we need the field metabolic_disease_name to store the disease name. abbreviate stores abbreviation of each metabolic disease name (for example, MMA is abbreviated from Methylmalonic Academia). Field model stores the Trained Model (the format shown in Figure 5.2) as Text. (shown in Figure 5.1 (c))
38 scaling range: it stores the range of training set attributes that able to restore
while scaling the testing set. min and max stores the minimum and maximum value of each metabolism (diagnosis marker). (shown in Figure 5.1 (d))
5.2 SVM Web Services
There are svm_train class, svm_predict class and scale class corresponding to the operation of SVM Training, SVM Predicting and SVM Scaling, respectively. Here, we will introduce the key parameters and functions of these classes.
SVM Training class
The svm_train class contains param svm_parameter to store the parameters that default defined or assigned by the user used for deciding which function svm_train will be. The svm_train class has svm_model to store the Trained Model. The constructor svm_train() can receive the DataSet passed from SVM Client. The function read_problem_from_ds() paring the DataSet and store the data in data type
prob for training.
39
SVM Predicting class
The svm_predict class constructor predict() receive the testing DataSet and Trained Model for predicting whether the newborn has metabolic disorder disease.
Figure 5.4 Class Diagram of svm_predict
SVM Scaling class
The scale class contains y_lower, y_upper, y_min and y_max to store scale range (lower and upper bound) and minimum, maximum value of label y, respectively. As shown in Figure 5.6, we scale the range from [min, max] to [lower, upper]. The v is the original value and v’ is the value after scaling.
′ lower upper lower min
max min
+svm_scaling(in ssDS : DataSet, in output_file_name : string, in is_save : int) : DataSet -atof(in s : string) : double
-atoi(in s : string) : int
-output_target(in value_y : double) : double -output(in index : int, in value_x : double) : double -lower : double = -1.0 -upper : double = 1.0 -y_lower : double -y_upper : double -y_scaling : int = 0 -max_index : int -feature_max : double[] -feature_min : double[]
-y_max : double = -System.Double.MaxValue -y_min : double = System.Double.MaxValue
libsvm::
40
Figure 5.6 Scaling Value From [min, max] to [lower, upper]
The array feature_max and feature_min store the maximum and minimum values of concentration values of each metabolism (diagnosis marker). The system default scale the concentration value of each metabolism to [lower, upper] ([-1, +1]). The scale class constructor svm_scaling() receive DataSet from SVM Training and SVM Predicting and return the scaled DataSet back.
We implement the system in C# language running on .NET platform. More information about C# Web Services, please refer to the book [26].
SVM Training Web Services
We created the SVM Training Web Services. The use of the WebMethod attribute in front of the method specifies that the method is accessible as a Web Services method.
[WebMethod]
public string SVM_Training() {
... }
localhost.Services1 ws1 = new localhost.Service1(); training_DataSet = ws1.SVM_Scaling(training_DataSet,1);
41 The method SVM_Training() invokes the Web Services SVM_Scaling and passes the
training_DataSet. After scaling, SVM_Scaling() return the Scaled training_DataSet.
It new a svm_train object st, and call st.train() then store the return Trained Model into model_str.
SVM Predicting Web Services
SVM_Preciting() invokes the Web Services SVM_Scaling and assign the return scaled
DataSet to screening_DataSet_sc.
It new a svm_predict object sp, and call sp.predict() then store the predicting result into msg.
svm_train st = new svm_train();
string model_str = st.train(training_DataSet);
[WebMethod]
public string SVM_Predicting(DataSet screening_DataSet) {
... }
DataSet screening_DataSet_sc = new DataSet();
localhost.Services1 ws2 = new localhost.Service1();
42
SVM Scaling Web Services
SVM_Scaling() receive the DataSet from SVM_Training() and SVM_Predicting(). It
new a scale object sc, and call sc.svm_scaling() then return the scaled DataSet back. svm_predict sp = new svm_predict();
string msg = sp.predict(screening_DataSet_sc, model_str);
[WebMethod]
public DataSet SVM_Scaling(DataSet inputDS, int is_save) {
DataSet scaled_DataSet = new DataSet(); scale sc = new scale();
scaled_DataSet = sc.svm_scaling(inputDS, is_save); return scaled_DataSet;
43
Chapter 6 Measurements &
Experimental Results
6.1 Metabolic data
Our experimental dataset was an anonymous and subset of all data gained from the Newborn Screening Centre of Nation Taiwan University Hospital between 2001 and 2006. Blood samples, which have been taken within a few days after the newborns’ birth, have been analyzed by MS/MS in a high throughput process and the measured metabolic datasets (35 measured metabolites including amino acids, long fatty acid chains and acyl carnitines) have been saved in a database.
In this study we focused on the metabolic disease: Methylmalonic Academia (MMA).
6.2 Evaluation of classifier’s accuracy and
validation
The discriminatory power of the models was evaluated from stating all true positive (TF), true negative (TN), false positive (FP), and false negative (FN) cases. The most frequently used evaluation measure in classification is accuracy (Acc) which describes the proportion of correctly classified instances: Acc = (TP + TN) / (TP + FP + TN + FN). Measures which consider more precisely the influence of the class size are sensitivity (Sn) or recall, specificity (Sp), positive predictive value (PPV) or
precision and negative predictive value (NPV). Sn = TP / (TP + FN) measures the
fraction of actual positive instances that are correctly classified; while Sp = TN / (TN
+ FP) measures the fraction of actual negative samples that are correctly classified. Sn
44 identifying normal. The PPV (or the reliability of positive predictions) is computed by PPV = TP / (TP + NP), the NPV is defined as NPV = TN / (TN + FN) [27].
The effectiveness of the classifiers is summarized in Table 3, 4, 5. As described above, the data were collected from NTUH Newborn Screening Center. There are 923 newborns; within them, 217 newborns have the MMA disorder; the rest are normal. According to these data, we conduct analyses based on the SVM Screening System we developed.
Table 3 Classification accuracy of three SVM approaches using different diagnosis markers for MMA
Diagnosis markers of MMA Sn (%) False-negative (No. of Cases) Sp (%) False-positive (No. of Cases) Acc (%) C3, C3/C2 94.93 11 100 0 98.81 C3, C4DC, C3/C2 94.93 11 100 0 98.81 All 99.54 1 100 0 99.89
Classification results are given in terms of sensitivity (Sn), specificity (Sp) and accuracy (Acc).
In the Table 3, three SVM approaches have applied using the System. In row 1, the NTUH classifies the MMA based on the markers: C3 & C3/C2. The SVM-2 (polynomial kernel, degree 2) led to Sn 94.93%. Similarly, in row 2, the Taipei Institute of Pathology classifies the MMA based on 3 metabolites: C3, C4DC, and C3/C2. The SVM-3 (polynomial kernel, degree 3) led to the same Sn value. However, the study selected all 36 features in the higher dimensional SVM classifier. The classification accuracy, Sn (99.54%) is higher. Obviously, higher dimensional selected features demonstrate better discrimination and increase the accuracy accordingly.
45 Table 4 Comparison of Classification Accuracy between Cut-Off Value and SVM
Disorder Classification model TP (No. of Cases) FP (No. of Cases) TN (No. of Cases) FN (No. of Cases)
MMA Cut-Off Value 165 1 705 52
SVM 216 0 706 1
Table 5 Discriminatory Performance of Cut-Off Value and SVM Applied to All Diagnosis Markers
Disorder Classification model Sn (%) Sp (%) PPV (%) NPV (%) Acc (%) MMA Cut-Off Value 76.03 99.86 99.40 93.13 94.26
SVM 99.54 100 100 99.86 99.89
In the Table 4, we compare the classification accuracy between Cut-off Value and SVM. Classification accuracy in terms of sensitivity (Sn), specificity (Sp), positive
predictive value (PPV), negative predictive value (NPV) and accuracy (Acc) is given in Table 5. Obviously, discriminatory performance of SVM is better than Cut-Off Value. The specificity (Sp) of Cut-Off Value is comparable to the SVM. Using SVM,
the number of FN cases could be reduced from 52 to 1 false negative cased compared to Cut-Off Value. The sensitivity of MMA could be improved from about 76 % to 99.54 %, this result is of high importance as ethical arguments and cost effectiveness related to an erroneous diagnosis are concerned. With higher sensitivity (Sn), it means
more the newborns that have MMA disease could be found earlier and addressed by effective therapies before MMA harm the infant.
Cross-Validation
An established methodology to evaluate the robustness of the classifier is to perform a cross-validation on the classifier. 10-fold cross-validation has been proved to be statistically good enough in evaluating the classification accuracy of the models [28].
As we mention in Section 3.1, we do a “grid-search” on C and γ using k-fold cross-validation. Depicted in Figure 6.1, basically pairs of (C, γ) are tried and the one with the best cross-validation accuracy is picked.
46
Figure 6.1 Flowchart of Grid-Search, Tuning The Parameter (C,γ), Estimated Accuracy by Cross-Validation
In the Table 6, we use the large dataset of MMA for cross-validation. There are 16655 newborns; within them, 235 newborns have the MMA disorder; the rest are normal. As the result shown in Table 6, cross-validation accuracy increased with the value k. According to [28], the credibly mean classification accuracy of our system is about 99.8%.
Table 6 k-fold Cross Validation Accuracy with varying folds
k-fold Cross-Validation Cross Validation Accuracy (%)
k = 5 99.8126
k = 10 99.8187
We func cros the 6.1) Fig integrate th ction to fi ss-validation whole train ). gure 6.2 Loo he software ind that th n rate 99.98 ning set is tr ose Grid Se tool grid.p he best (C 879% (show rained again earch on C y of LIBSV C, γ ) is wn in Figure n to generat C = 2-5~215 a VM [25] to (32768, 0. e 6.2). After te the final c and γ=2-15 in our syste .001220703 r the best (C classifier (s 5~23 em. We use 3125) with C, γ) is fo shown in Fi 47 e this the ound, gure
48
Chapter 7 Conclusion and Future
Work
In this study, we proposed a Newborn Screening System that predicts whether the newborn has metabolic disorder diseases based on modified Support Vector Machines (SVM) classifier. In this system, the predicting accuracy (sensitivity) of MMA could be improved from 76% (cut-off value approach) to over 99%.
Based on the Service-oriented Architecture (SOA) concept, we developed three main functions of SVM (i.e., training, predicting, scaling) using Web Services techniques. The design inherits the SOA flexibilities and will provide additional cooperation for further integration and deployment.
Up to date, MS/MS newborn screening in NTUH has accumulated around 400,000 pieces of data in five years. NTUH has dedicated the manpower to digitize those paper data. After data converted, thus, they enable the opportunities to apply the SVM-based Screening System for classifying other metabolic disorder diseases and induce higher discrimination accuracies. Ultimately, the System can replace the classic cut-off value screening technique.
49
Reference
[1] Hsiao KJ, Chiang SH., “Developments of Neonatal Screening in Taiwan”, International Conference on Genetic Medicine and Promoting Healthcare for Rare Disorder, Taipei, 2005; 255-8.
[2] Chien-Ming Tu, Hsing-Yu Chang, Mei-Yu Tang, Faipei Lai, et al.,” The Design
and Implementation of a Next Generation Information System for Newborn Screening”, HEALTHCOM 2007, June, 2007.
[3] Department of Medical Genetics, National Taiwan University Hospital, http://ntuh.mc.ntu.edu.tw/gene/index.htm
[4] Schulze A, Lindner M, Kohlmüller D, Olgemöller K, Mayatepek E, Hoffmann GF, “Expanded newborn screening for inborn errors of metabolism by
electrospray ionization-tandem mass spectrometry: results, outcome, and implications.”, Pediatrics, Vol. 111, No. 6, p.1399-1406, June 2003.
[5] Donald H. Chace, Theodore A. Kalas, and Edwin W. Naylor, “Use of Tandem
Mass Spectrometry for Multianalyte Screening of Dried Blood Specimens from Newborns”, Clin. Chem., Nov 2003; 49: 1797 - 1817.
[6] Liebl,B., Nennstiel-Ratzel,U., Roscher,A.A. and von Kries,R., “Data required
for the evaluation of newborn screening programmes.” Eur. J. Pediatr.,
162(Suppl. 1), 57–61, 2003.
[7] Millington,D.S., Terada,N., Kodo,K. and Chace,D.H., “A review: carnitine and
acylcarnitine analysis in the diagnosis of metabolic diseases: advantages of tandem mass spectrometry. In Matsumoto,I. (ed). Advances in Chemical Diagnosis and Treatment of Metabolic Disorders.” JohnWiley & Sons, New
York, Vol 1, pp. 59–71, 1992.
[8] Scholkopf, B. and Smola, A.J., “Statistical Learning and Kernel Methods”, Cambridge, MA, 2000.
[9] Joachims, T. “Text categorization with Support Vector Machines”, In Proceedings of European Conference on Machine Learning (ECML), 1998.
50 [10] Pontil, M. and Verri, A., “Support Vector Machines for 3D Object Recognition.”, IEEE Trans. on Pattern Analysis and Machine Intelligence, 20, 1998, pp.637-646.
[11] M. Brown, W. Grundy, D. Lin, N. Cristianini, C. Sugnet, T. Furey, M. Ares & D. Haussler, 1999, “Knowledge-base analysis of microarray gene expression data
using support vector machines”, Technical report, University of California in
Santa Cruz.
[12] Vapnik,V., “Statistical Learning Theory.”, Wiley, New York, 1998.
[13] Cortes,C. and Vapnik,V. ”Support vector network”, Mech.Learning, 20, 273–297, 1995.
[14] Duan. K., Keerthi. S. S., and Poo, A. N. “Evaluation of Simple Performance
Measures for Tuning SVM Hyperparameters”, Neurocomputing, Vol.51, 2003,
pp.41-59.
[15] C.J.C. Burges. Geometry and invariance in kernel based methods. In B. Sch¨olkopf, C.J.C. Burges, and A.J. Smola, editors, “Advances in Kernel
Methods: Support Vector Learning”, pages 89–116. MIT Press, 1999.
[16] Ron Kohavi.,”A Study of Cross-Validation and Bootstrap for Accuracy
Estimation and Model Selection.”, IJCAI1995.1137-1145.
[17] Sarle, W. S., “Neural Network FAQ”, Periodic posting to the Usenet news-group comp.ai.neural-nets, 1997.
[18] Newcomer, Eric; Lomow, Greg. “Understanding SOA with Web Services.” Addison Wesley, 2005.
[19] Bell, Michael. "Introduction to Service-Oriented Modeling", Service-Oriented
Modeling: Service Analysis, Design, and Architecture. Wiley & Sons, 3, 2008.
[20] Erl, Thomas. Service-oriented Architecture: Concepts, Technology, and Design. Upper Saddle River: Prentice Hall PTR, 2005.
[21] Web Services Description Language (WSDL), http://www.w3.org/TR/wsdl [22] Universal Description, Discovery and Integration (UDDI), http://www.uddi.org [23] Extensible Markup Language (XML), http://www.w3.org/XML/
[24] Simple Object Access Protocol (SOAP), http://www.w3.org/TR/soap/
[25] Chih-Chung Chang and Chih-Jen Lin, LIBSVM: a library for support vector machines, 2001, Software available at http://www.csie.ntu.edu.tw/~cjlin/libsvm
51 [26] Banerjee, Ahish., “C# Web Services : building Web services with .NET remoting
and ASP.NET”, Wrox Press, 2001
[27] Salzberg,S., “On comparing classifiers: a critique of current research and
methods.”, Data Min. Knowl. Disc., 1, 1-12, 1999.
[28] Witten, I.H. and Frank, E., “Data Mining-Practical Machine Learning Tools and
Techniques with Java Implementations.”, Morgan Kaufmann, San Francisco,