Infrared brazing of Ti
50
Ni
50
shape memory alloy using pure
Cu and Ti – 15Cu – 15Ni foils
T.Y. Yang
a, R.K. Shiue
b, S.K. Wu
c,*
a
Department of Mechanical Engineering, Kuang Wu Institute of Technology, Taipei 112, Taiwan, ROC
b
Department of Materials Science and Engineering, National Dong Hwa University, Hualien 974, Taiwan, ROC
cDepartment of Materials Science and Engineering, College of Engineering, National Taiwan University, 1 Roosevelt Road Sec 4, Taipei 106, Taiwan, ROC
Received 1 July 2003; accepted 3 March 2004 Available online 20 May 2004
Abstract
Infrared brazing of Ti50Ni50using two brazing filler metals was investigated in the study. Three phases, including Cu-rich, CuNiTi (D) and
Ti(Ni,Cu), were observed in the Ti50Ni50/Cu/Ti50Ni50joint after brazing at 1150 8C. The Cu-rich phase was rapidly consumed in the first 10 s
of brazing, and the eutectic mixture of CuNiTi and Ti(Ni,Cu) phases were subsequently observed in the joint. Samples brazed for longer time resulted in less CuNiTi and more Ti(Ni,Cu) phases in the joint. The existence of CuNiTi phase deteriorated the shape memory effect of the joint, but Ti(Ni,Cu) could still preserve shape memory behavior even alloyed with a large number of Cu. Therefore, higher shape recovery ratio was observed for specimens brazed for a longer time period. Extensive presence of Ti2(Ni,Cu) phase was observed in
Ti50Ni50/Ticuni w
/Ti50Ni50joint upon brazing the specimens up to 1150 8C. The bending test could not be performed due to the inherent
brittleness of Ti2(Ni,Cu) matrix. Moreover, the stable Ti2(Ni,Cu) phase was difficult to be removed completely by increasing either brazing
time and/or temperature.
q2004 Elsevier Ltd. All rights reserved.
Keywords: A. Intermetallics, miscellaneous; B. Shape-memory effects; C. Joining; D. Microstructure; E. Phase diagram
1. Introduction
The importance of TiNi-based shape memory alloys (SMAs) is increasing due to their superior behavior in shape memory effect, superelasticity, and high corrosion resist-ance compared with many other SMAs[1 – 6]. The maturity of various manufacturing processes plays an important role in the applications of TiNi-based SMAs, and rolling, drawing as well as joining have been extensively studied
[7 – 12].
Brazing is an economical fabrication method of complex assemblies among all joining methods [13]. Although there is no melting of the base metal during brazing, the heating can still affect the properties of the materials being joined[13]. It will be highly preferred that minimum heating is introduced during brazing in order to avoid deterioration of the base metal. The rapid infrared joining technique has been originally developed at
the University of Cincinnati for high temperature materials [14]. Infrared brazing is a novel technique featured with rapid thermal cycle in comparison with the traditional furnace brazing [15]. With the aid of infrared energy generated by heating a tungsten filament in a quartz tube, the infrared furnace can provide rapid heating rate up to 3000 8C/min [15]. Therefore, the infrared brazing is highly suitable for studying the mechanism of early-stage reaction kinetics in the joint, and many reports are already available in literatures [16 – 19]. Infrared brazing has become an important method in studying the microstructural evolution of the brazed joint.
The primary challenge in brazing TiNi-based SMAs is to preserve its shape memory characteristics across the joined interface. Conventional furnace brazing with slow heating rates is probably not suitable in bonding TiNi-based SMAs, because the base metal experiences elevated temperatures for a long time. The reaction of Ti with other elements at elevated temperatures may deteriorate many featured properties of TiNi-based SMAs. Consequently, the inves-tigation of brazing TiNi SMA is very limited[11].
0966-9795/$ - see front matter q 2004 Elsevier Ltd. All rights reserved. doi:10.1016/j.intermet.2004.03.020
www.elsevier.com/locate/intermet
* Corresponding author. Tel.: 7846; fax: þ886-2-2363-4562.
It is reported that Ni atoms can be replaced by a large number of Cu atoms in Ti50Ni50 alloy and Ti50Ni502xCux
(x % 30 wt.%) SMAs can still exhibit shape memory behavior [20,21]. Consequently, both pure Cu and Ti – 15Cu – 15Ni foils are selected as brazing filler metals in joining Ti50Ni50SMA. It is well known that the properties
of the bonding interface between filler metal and base metal are strongly related to the interfacial microstructure. The morphology, quantity and species of the phases at the interface play crucial roles in evaluating the brazed joint. The main purpose of this study is aimed to infrared brazing Ti50Ni50 SMA using two filler metals, pure Cu and
Ti – 15Cu – 15Ni, respectively. With the aid of fast infrared heating rate, the early-stage of microstructural evolution in the joint will be studied extensively. The shape recovery character of an infrared-joined Ti50Ni50 SMA is also
discussed.
2. Experimental procedures
Ti50Ni50in atomic percent was used as the base metal in
this study. The master alloy was prepared by vacuum arc remelting using high-purity pellets under protective argon atmosphere. The TiNi ingot was firstly cut into approximate 10 mm £ 5 mm £ 1 mm specimens. Brazed surfaces of each TiNi specimen were polished by a SiC paper of 600 grit, and subsequently cleaned well in an ultrasonic bath prior to infrared brazing. Pure copper foil and Ticuniwfoil
of thickness 25 mm as well as 50 mm were used as the brazing filler metals. Ticuniw foil is a commercial product
of Wesgo company, and its chemical composition in weight percent is 70Ti – 15Cu – 15Ni. Ticuniw
is a clad-laminated brazing filler metal [22]. It has an inner Cu50Ni50 (wt.%)
alloy layer and two pure outer Ti layers. The solidus and liquidus temperatures of Ticuniw
foil are 910 and 960 8C, respectively.
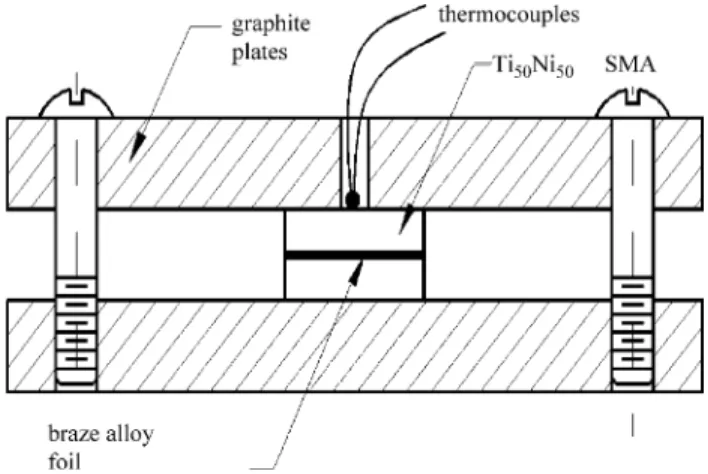
The brazing filler foil was sandwiched by two pieces of Ti50Ni50 base metal. To enhance infrared absorption of
the brazed specimen, all specimens were clamped between two graphite plates, and a thermocouple was kept in contact with the specimen as shown in Fig. 1 to measure the temperature. An ULVAC SINKO-RIKO RHL-P610C infrared furnace with an Ar flow rate of 200 cm3/min was used throughout the experiment.Table 1
summaries all process variables used in this study. The specimen was cut by a low speed diamond saw. A standard metallographic procedure was applied to the specimen before the microstructural observation. Their cross-sections were first ground by SiC papers, and subsequently polished by 0.3 mm alumina powder. Kroll’s reagent with 2 ml HF, 4 ml HNO3 and 100 ml
H2O was selected as an etching solution. The etched
cross-sections of the brazed specimens were examined using a Philips XL30 scanning electron microscope (SEM) with energy dispersive X-ray spectroscopy
(EDS). Quantitative chemical analysis was also per-formed using a JEOL JXA-8600SX electron probe microanalyzer (EPMA) equipped with a wavelength dispersive spectrometer (WDS) operated at 15 kV with a probe current of 100 nA.
The shape memory effect (SME) was measured by the bending test to evaluate the shape recovery ratio of infrared brazed joint[23].Fig. 2displays a schematic diagram of the bending test. The initially flat brazed Ti50Ni50/Cu/Ti50Ni50
and Ti50Ni50/Ticuniw/Ti50Ni50 specimens were machined
into a size of approximately 20 mm £ 5 mm £ 0.5 mm. Then, it was bent into an angleuiat the temperature of 77 K
(liquid nitrogen). After the temperature was raised to various temperatures of up to 130 8C, ui was recovered to
uf; which was temperature dependent. The shape recovery
ratio of the joint was determined by ðui2ufÞ=ui: The
detailed measurement of the shape-recovery characteristics has been presented elsewhere [23]. A pure Ti50Ni50
specimen with the same dimension of the above infrared brazed sample was also tested for the purpose of comparison.
Fig. 1. The schematic diagram showing geometry of graphite fixture used in the test.
Table 1
Process variables used in infrared brazing
Temperature (8C) Ti50Ni50/Cu/Ti50Ni50(s) Ti50Ni50/Ticuni w /Ti50Ni50(s) 960 – 12 960 – 30 960 – 120 960 – 300 1000 – 30 1050 – 30 1100 – 30 1150 2 – 1150 10 – 1150 30 30 1150 60 – 1150 300 –
3. Results and discussion
3.1. Infrared brazing of Ti50Ni50/Cu/Ti50Ni50Joint
The heating of substrate may result in changes of its properties, particularly if the alloy is heated above its annealing temperatures. Where mechanical properties are obtained by heat treatment, e.g. quench and temper, they may be altered by the brazing operation. In contrast, the alloy in the annealed condition will generally experience no appreciable change due to brazing [24]. It is expected that brazing has little effect on the mechanical properties of TiNi substrate. Additionally, one of the significant
Fig. 2. The schematic diagram of the bending test.
base metal interactions which have been used in determining the behavior of brazed joint is alloying. The extent of interaction varies greatly depending on the compositions of the base metal, the brazing filler metal and thermal cycle[24]. A short thermal cycle can usually minimize the alloying effect during brazing. Compared with the traditional furnace brazing, infrared brazing is featured with a very rapid thermal cycle, so higher infrared brazing temperature will do less damage to the base metal. However, high brazing temperature can greatly speed up the microstructural evolution of the brazed joint in the study.
The melting point of pure Cu is 1084.9 8C, so 1150 8C was the chosen as the brazing temperature throughout
the experiment. Fig. 3 displays backscattered electron images (BEIs) of the interface infrared-brazed specimen at 1150 8C for 2, 10, 30, 60 and 300 s. Numbers 1 – 7 shown in the figure are the chemical analyses of the selected areas, and the results are listed inTable 2. According toTable 2, there are three phases observed in the joint, including: Cu-rich phase, CuNiTi (D) phase and Ti(Ni,Cu) phase[25]. Residual Cu can be initially found in the joint, but it is completely consumed in 10 s as shown inFig. 3(a) and (b). In Fig. 3(a), the central Cu-rich phase (marked by 1) is alloyed with minor Ti and Ni, and a CuNiTi phase (marked by 2) is intermediated between the Cu-rich phase and Ti50Ni50base metal. The dissolution of Ti50Ni50base metal
into molten Cu-rich braze results in the formation of CuNiTi phase. The ternary CuNiTi (D) intermetallic compound with a stoichiometry Cu30Ni36.5Ti33.5 has been reported in the
literature [25]. The microstructure displayed in Fig. 3(b)
exhibits the eutectic structure of CuNiTi and Ti(Ni,Cu). It was reported that high solubility of Cu was found in Ti50Ni50, with Ni being replaced by Cu[20,21].
Fig. 4shows the isothermal section of Cu – Ni – Ti system at 800 8C in atomic percent[25]. According toFig. 4, TiNi has a huge solubility for Cu, and it is consistent with our experimental result. There are two major regions between TiNi and Cu in Fig. 4, including a region mixed with
Table 2
Chemical analyses of the selected areas inFig. 3
No. Composition (at.%) Remarks 1 4.7Ti – 2.6Ni – 92.7Cu Cu-rich phase 2 34.8Ti – 35.5Ni – 29.7Cu CuNiTi (D) phase 3 34.8Ti – 38.1Ni – 27.0Cu CuNiTi (D) phase 4 48.2Ti – 40.8Ni – 11.0Cu Ti (Ni,Cu) phase 5 37.4Ti – 39.0Ni – 23.5Cu CuNiTi (D) phase 6 48.2Ti – 44.1Ni – 7.7Cu Ti (Ni,Cu) phase 7 50.6Ti – 48.2Ni – 1.2Cu Ti (Ni,Cu) phase
Ti(Ni,Cu) and CuNiTi (NiTi þ D), and a region mixed with CuNiTi and Cu-rich phase (D þ g). The dissolution Ti50Ni50substrate into the molten braze is strongly related
to the final microstructure of the joint. With the increment of brazing time, both the diffusion of Cu atoms into Ti50Ni50
substrate and Ni atoms into the braze are greatly enhanced. The formation of CuNiTi phase in the braze results in the disappearance of Cu-rich phase in the joint, so the eutectic Ti(Ni,Cu) and CuNiTi phase, instead of eutectic CuNiTi and Cu-rich phase, is observed in the experiment. Additionally, the amount of CuNiTi phase in the joint is gradually decreased with the increment of brazing time, because the TiNi substrate has a huge solubility of Cu. The consumption of Cu from the CuNiTi phase cause shrinkage of CuNiTi in the infrared brazed joint as illustrated in Fig. 3(c) – (e). According to the experimental observations, it is expected that CuNiTi phase can be completely dissolved into Ti50Ni50substrate if the brazing time is long enough.
The infrared brazing Ti50Ni50using pure Cu consists of
several major stages, including: melting of the braze alloy (Cu), dissolution of the Ti50Ni50 into the Cu-rich melt,
saturation of the melt, isothermal solidification of the molten braze alloy and homogenization of the brazed joint through diffusion of the solute atoms into the base metal[26]. It is similar to the process of transient liquid phase bonding (TLPB)[26 – 28]. The melting of Cu during infrared brazing is very rapid as demonstrated inFig. 3(a). In contrast, the isothermal solidification and homogenization are not completed during infrared joining. Blue proposes an estimation of the time for isothermal solidification at various specified joining temperatures [26]. However, there is no further calculation in this research due to insufficient diffusion data of Cu and Ti atoms in Ti50Ni50 substrate.
Accordingly, it needs further study in the future.
Table 3 summaries the result of the bending test. The shape recovery ratio of the original Ti50Ni50 strip is
95% at 80 8C, and it increases to 99% as the specimen heated to 130 8C. Higher recovery ratio can be obtained for all specimens heated to a higher temperature. According to
Table 3, the recovery ratio of the specimen brazed for 300 s is better than that of specimens brazed for 60 s. There are two different thickness of the Cu foils used in the test,
including 50 and 25 mm. Both thicknesses of the Cu fillers demonstrate similar tendency of the test.
According to the aforementioned result, specimens brazed for longer time result in less CuNiTi phase and more Ti(Ni,Cu) phase in the joint. It is reasonable to conclude that the existence of CuNiTi phase deteriorates the shape memory effect of the joint. Moreover, Ti(Ni,Cu) still preserves the shape memory behavior even though it is alloyed with Cu [20,21]. The amount of CuNiTi phase is greatly decreased in the joint as the brazing time is increased. Therefore, it is expected that
Table 3
Shape memory recovery of Ti50Ni50/Cu/Ti50Ni50joint
Specimen Shape recovery at 80 8C (%) Shape recovery at 130 8C (%) 50 mm Cu foil, 60 s 60 83 53 81 50 mm Cu foil,300 s 87 . 99 84 . 99 25 mm Cu foil, 60 s 64 81 25 mm Cu foil,300 s 98 . 99
Ti50Ni50Base metal 95 . 99 Fig. 5. The SEIs and EPMA line scan profiles of the interface infrared
higher shape recovery ratio can be obtained for specimens brazed for a longer time period.
Specimens after bending test were subsequently examined by an SEM. It was confirmed that there was no cracks observed in the Ti50Ni50/Cu/Ti50Ni50 joint.
Conse-quently, the use of pure Cu in brazing Ti50Ni50 has the
potential in engineering applications.
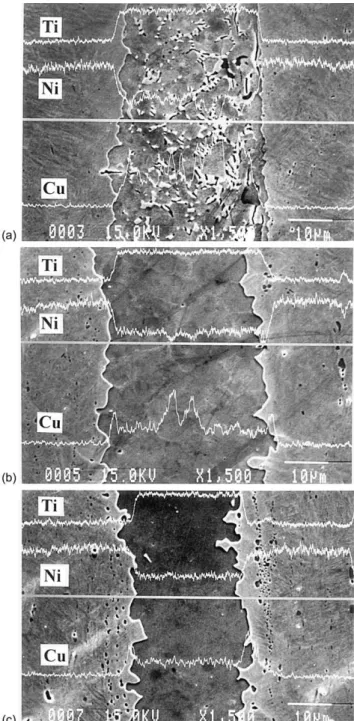
3.2. Infrared brazing of Ti50Ni50/Ticuniw/Ti50Ni50Joint Fig. 5displays the secondary electron images (SEIs) and EPMA line scan profiles of the interface infrared brazed at 960 8C for 12, 120 and 300 s. The brazed joint initially contains two phases, the matrix and the angular phase. Upon increasing the brazing time, only the matrix phase is left in the joint. Meanwhile, the line scan profiles demonstrate that the chemical composition of the braze becomes homogeneous upon increasing the brazing time. Chemical analysis using EPMA or EDS is necessary in order to further quantify these phases.
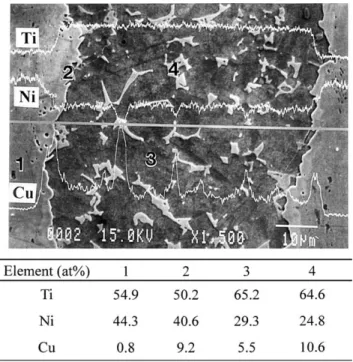
Fig. 6displays SEM image and EDS chemical analyses of the specimen brazed at 960 8C for 30 s. It is noted that no interfacial reaction phase between Ti50Ni50base metal and
the braze alloy is observed. According to EDS analyses, the chemical composition of base metal is close to Ti50Ni50as
marked by 1 inFig. 6. The base metal near the interface is alloyed with more Cu (marked by 2 in Fig. 6), and its stoichiometry is close to Ti50(Ni,Cu)50. Unlike
aforemen-tioned Ti50Ni50/Cu/Ti50Ni50 bonding, the current brazed
joint is primarily comprised of Ti2(Ni,Cu) phase (marked
by 3 in Fig. 6). Meanwhile, the chemical composition of
the angular phase in the joint is still close to Ti2(Ni,Cu) as
shown in Fig. 6 (marked by 4). The major difference between the matrix and the angular phase is the copper content in Ti2(Ni,Cu). The copper content in the matrix is
lower than that in the angular phase. The Cu atoms can replace the Ni atoms in Ti2Ni phase, so Ti2(Ni,Cu) is formed
during brazing.
Both Ti and Cu diffuse from braze alloy into Ti50Ni50,
and Ni diffuses from Ti50Ni50 into braze driven by the
concentration gradient of the joined alloys. According to
Fig. 4, the isothermal section in the Cu – Ni – Ti system at 800 8C demonstrates that Ti2Ni phase can dissolve Cu up to
8 at% [25]. Additionally, there is no intermediate phase between Ti50Ni50 and Ti2Ni as displayed in Fig. 4. It is
consistent with our experimental observations. The atomic composition of Ti – 15Cu – 15Ni is 74.8Ti – 12.1 Cu – 13.1Ni as marked by A in Fig. 4 [25]. Both Ti50Ni50 and Ti2Ni
phases can dissolve Cu, so Ti(Ni,Cu) and Ti2(Ni,Cu) phases
are observed in the experiment.
Fig. 6. The BEI and EDS chemical analyses of the specimen brazed at 960 8C for 30 s.
Fig. 7. The SEM images (a) SEI, (b) BEI, and EPMA chemical analyses of the specimen brazed at 1000 8C for 30 s.
Fig. 7 shows the SEM images and EPMA chemical analyses of the Ti50Ni50/Ticuniw/Ti50Ni50joint at 1000 8C
for 30 s. The result of EPMA chemical analyses is similar to that brazed at 960 8C for 30 s. Upon increasing the brazing temperature, the amount of angular phase in the joint decreases since the interdiffusion between the molten braze and Ti50Ni50substrate is greatly enhanced at higher brazing
temperatures. The consumption of Cu in the molten braze increases at 1000 8C. Consequently, the angular phase with higher Cu content is decreased.Fig. 8shows the SEM images and EPMA chemical analyses of the Ti50Ni50/Ticuniw/
Ti50Ni50 joint at 1050 8C for 30 s. The angular phase is
almost disappeared, and the width of Ti2(Ni,Cu) matrix is
further decreased. The depletion of Ti in the braze results in the diminishing of Ti2(Ni,Cu) phase. Similar observation
can be found for Ti50Ni50/Ticuniw/Ti50Ni50 specimens
brazed at 1100 8C for 30 s, as displayed inFig. 9.
The bending test could not be performed due to the inherent brittleness of the infrared brazed joint. Ti50Ni50/Ticuniw/Ti50Ni50 was broken at the joint after
the specimen was bent. The direction of crack propagation was along the braze joint. It was resulted from the extensive presence of brittle Ti2(Ni,Cu) matrix in the
joint. In Ti50Ni50/Cu/Ti50Ni50 bonding, the joint was
primarily comprised of eutectic Ti(Ni,Cu) and CuNiTi phase. It was reported that Ti(Ni,Cu) phase still preserved SMA even alloyed with , 30 wt% Cu [20,21]. However, Ti(Ni,Cu) phase was absent from Ti50Ni50/
Ticuniw
/Ti50Ni50 joint after infrared brazing. Moreover,
Ti2(Ni,Cu) phase was still observed in Ti50Ni50/Ticuniw/
Ti50Ni50 for specimens infrared brazing up to 1150 8C.
Consequently, the brittle and stable Ti2(Ni,Cu) phase was
difficult to be completely removed by increasing either brazing time or temperature.
Fig. 8. The SEM images (a) SEI, (b) BEI, and EPMA chemical analyses of the specimen brazed at 1050 8C for 30 s.
Fig. 9. The SEM images (a) SEI, (b) BEI and EPMA chemical analyses of the specimen brazed at 1100 8C for 30 s.
4. Conclusions
1. Infrared brazing of Ti50Ni50/Cu/Ti50Ni50 was
investi-gated in the study. Three phases, including Cu-rich, CuNiTi (D) and Ti(Ni,Cu), were observed in the joint after infrared brazing at 1150 8C. The Cu-rich phase was rapidly consumed within the first 10 s of brazing. Thereafter, eutectic mixture of CuNiTi and Ti(Ni,Cu) phases was observed in the bond. With the increase of brazing time, the amount of CuNiTi phase decreased due to the consumption of Cu in the joint.
2. The shape recovery ratio of the original Ti50Ni50 strip
was 95% at 80 8C and 99% at 130 8C in the bending test. The shape recovery ratio of Ti50Ni50/Cu/Ti50Ni50 joint
could reach 99% at 130 8C for the specimen infrared brazed at 1150 8C for 300 s. Samples brazed for longer time resulted in less CuNiTi phase and more Ti(Ni,Cu) phase in the joint. The existence of CuNiTi phase deteriorated the shape memory effect of the joint, but Ti(Ni,Cu) still preserved the shape memory behavior even alloyed with a large number of Cu.
3. Extensive presence of Ti2(Ni,Cu) phase was observed in
Ti50Ni50/Ticuniw/Ti50Ni50 joint for specimens
infrared brazed up to 1150 8C for 30 s. The bending test could not be completed due to the inherent brittleness of Ti2(Ni,Cu) matrix in the joint. Moreover, the stable
Ti2(Ni,Cu) phase was difficult to be removed by
increasing either the brazing temperature or time.
Acknowledgements
The authors gratefully acknowledge the financial support of this research by the National Science Council (NSC), Republic of China under grant No: NSC 89-2216-E002-002.
References
[1] Otsuka K, Shimizu K. Inter Metal Rev 1986;31:93. [2] Miyazaki S, Otsuka K. ISIJ Int 1989;29:353. [3] Waymam CM. Mater Sci Forum 1989;56 – 58:1.
[4] Lin HC, Wu SK, Chou TS, Kao HP. Acta Metall 1991;39:2069. [5] Oshida Y, Miyazaki S. Corrosion Eng 1991;40:1009.
[6] Saburi T. In: Otsuka K, Wayman CM, editors. Shape memory materials. Cambridge: Cambridge University Press; 1998. p. 58.
[7] Miyazaki S, Imai T, Igo Y, Otsuka K. Metall Trans 1986;17A:115. [8] Liu Y, McCormick PG. Acta Metall Mater 1990;38:1321. [9] Lin HC, Wu SK. Acta Metall Mater 1994;42:1623. [10] Wu SK, Lin HC, Yen YC. Mater Sci Eng 1996;215A:113. [11] Gale WF, Guan Y. J Mater Sci 1997;32:357.
[12] Hsu YT, Wang YR, Wu SK, Chen C. Metall Mater Trans 2001; 32A:569.
[13] Schwartz M. Brazing: for the engineering technologist. New York: Chapman and Hall; 1995. p. 1.
[14] Blue CA, Lin RY. Joining and adhesion of advanced inorganic materials. MRS Symp Proc 1993;314:143.
[15] Shiue RK, Wu SK, O JM, Wang JY. Metall Mater Trans A 2000;31A: 25 – 7.
[16] Shiue RK, Wu SK, Chen SY. Acta Mater 2003;51:1991.
[17] Shiue RK, Wu SK, Hung CM. Metall Mater Trans A 2002;33A: 1765.
[18] Yang TY, Wu SK, Shiue RK. Intermetallics 2001;9:341. [19] Lee YL, Shiue RK, Wu SK. Intermetallics 2003;11:187. [20] Mercier O, Melton KN. Metall Trans 1979;10A:387. [21] Bricknell RH, Melton KN. Metall Trans 1979;10A:1541. [22] Hoffman EK, Bird RK, Dicus DL. Welding J 1995;74:378s. [23] Lin HC, Wu SK. Scripta Metall Mater 1992;26:59.
[24] Schwartz M. Brazing. Metals Park, OH: ASM International; 1987. p. 39.
[25] Gupta KP, Phase diagrams of ternary nickel alloys, Calcutta: Indian Institute of Metals; 1990. p. 258.
[26] Blue CA, Sikka VK, Blue RA, Lin RY. Metall Mater 1996;27A:1. [27] Tuah-Poku I, Dollar M, Massalski TB. Metall Mater 1988;19A:
675.

![Fig. 4 shows the isothermal section of Cu – Ni – Ti system at 800 8C in atomic percent [25]](https://thumb-ap.123doks.com/thumbv2/9libinfo/8874174.249539/4.918.74.436.212.359/fig-shows-isothermal-section-cu-ni-atomic-percent.webp)