國
立
交
通
大
學
資訊科學與工程研究所
碩
士
論
文
運
用
記
憶
體
保
護
機
制
增 進 資 料 監 控 點 檢 查 之 效 能
Using Memory Protection Techniques to
Improve Data Watchpoint Checking Efficiency
研 究 生:王士瑜
指導教授:黃世昆 教授
運用記憶體保護機制增進資料監控點檢查之效能 Using Memory Protection Techniques to
Improve Data Watchpoint Checking Efficiency
研 究 生:王士瑜 Student:Shih-Yu Wang 指導教授:黃世昆 Advisor:Shih-Kun Huang 國 立 交 通 大 學 資 訊 科 學 與 工 程 研 究 所 碩 士 論 文 A Thesis
Submitted to Institute of Computer Science and Engineering College of Computer Science
National Chiao Tung University in partial Fulfillment of the Requirements
for the Degree of Master
in
Computer Science
June 2009
Hsinchu, Taiwan, Republic of China
運用記憶體保護機制增進資料監控點檢查之效能 學生:王士瑜 指導教授:黃世昆 國立交通大學資訊與科學工程研究所碩士班 摘 要 利用資料監控點之機制檢查在記憶體上與控制流程相關位置,為保 護程式不被攻擊並執行惡意程式碼的方法之一,但是這樣的方法必須 常態性的檢查監控點的正確性。傳統的方法必須在程式執行中不斷的 去確認監控點是否有被修改,因此當監控點數量增加,即使它們完全 未被更動,我們仍要做非常多次的主動檢查,這也是此類方法效能低 落的原因。 針對此類問題,我們提出利用現有硬體所提供之記憶體保護機制, 來實做非同步式的檢查。也就是只有當該監控點有被實際寫入修改, 我們才需要檢查其修改之正確性。這樣可以去除不必要的主動檢查, 使效能大幅提升。我們實做的方法稱之為 DupWrite,目標是減輕在動 態監控機制裡的運算負擔,並且可以有效率的檢查堆積上的記憶體目 標。 在結果分析裡面我們用不同的角度,去探討以及證明我們所提出的 方法,對於寫入到程式堆疊以外記憶體位置比例較低的程式,有著顯 著的效能提升。我們同時提出具體改善方法,可以在未來去除執行一 般程式時的效能瓶頸,讓這個方法更為實用化。 關鍵字:程式控制流程劫奪,資料監控點,記憶體分頁保護
Using Memory Protection Techniques to Improve Data Watchpoint Checking Efficiency
Student:Shih-Yu Wang Advisors:Prof. Shih-Kun Huang
Institute of Computer Science and Engineering National Chiao Tung University
ABSTRACT
Because of the heavy overhead introduced by the massive security related memory watchpoints during program execution, the runtime efficiency is greatly influenced and the deployment of such watchpoints is not applicable for real world applications. Current approaches utilize software solutions to dynamically instrument checking functions to the data watchpoints.
We have developed a new method using existing hardware mechanisms such as page protection to achieve asynchronous detection of watchpoint modification and improve the overall performance. Our method is called DupWrite, which focuses on reducing the overhead in instrumentation and checking the targets on heap efficiently.
The evaluation section is consist of various kind of analysis and proves that our method does very well when the memory reference percentage to the non-stack region is low, and it can be further improved to speed up the checking in general cases.
誌謝 首先感謝我的指導教授,黃世昆老師。無論是從前修老師的課,到後 來進入實驗室,由老師指導研究方向,我都從中獲益良多。能夠順利的拿 到碩士學位,實在是因為有老師的用心指導。另外也要感謝我的口試委員, 馮立琪老師和孔崇旭老師,對這篇論文所提出的指導和建議。 接著要感謝在實驗室兩年期間認識的大家。尤其感謝昌憲學長,從我 剛進實驗室就相當的照顧我,給我很多的建議以及參考資料、學習方向。 並且在放假期間,特地抽空幫我檢視以及修改論文,補足我許多不足的知 識,讓我這兩年的研究生涯以及口試進行的相當順利,以後也受用無窮。 立文學長則有相當淵博的知識以及深厚的系統和實作功力,也是我學習的 目標和榜樣。友祥學長、彥廷學長、琨瀚學長、文健學長,和你們一起打 拚畢業的經驗,相當難忘。還要感謝泳毅學長以及慧蘭學姐,雖然相處的 時間不多。感謝佑鈞處理許多實驗室的系統事務,感謝世欣在我擔任課程 助教期間替我分擔了不少工作。 再次感謝老師以及實驗室的所有成員創造了 SQLAB 這樣優良的研究 學習環境,不論是研究也好、擔任課程助教也好,在兩年過程之中獲得的 啟發,對我未來的人生,扮演著舉足輕重的角色。我會懷念在實驗室討論 的時光,在老師辦公室以及會議室開會的時光,還有大家一起在工三和二 餐路上買飯聊天的時光。 最後感謝我的父母及所有家人,還有同學朋友們,謝謝你們的關懷及 鼓勵,我的每一部分都來自於你們的貢獻,由衷感謝。
Contents
Chinese Abstract i English Abstract ii Acknowledgements iii Contents iv List of Tables viList of Figures vii
1 Introduction 1
1.1 Background . . . 1
1.2 Different Types of Memory Corruption . . . 1
1.2.1 Stack Buffer Overflow . . . 1
1.2.2 Heap Buffer Overflow . . . 1
1.3 Defining Memory Targets . . . 2
1.4 Performance Analysis of Beagle . . . 2
1.5 Problem Description . . . 3
2 Related Work 5 2.1 Memory Watchpoint . . . 5
2.1.1 How to Do A Million Watchpoints: Efficient Debugging Using Dynamic Instrumen-tation (EDDI) . . . 6
2.2 Memory Corruption Detection . . . 6
2.2.1 Detection and Diagnosis of Control Interception (Beagle) . . . 7
2.2.2 Automated Security Debugging Using Program Structural Constraints (CBones) . 7 2.3 Combination . . . 8
3 Method 9 3.1 Memory Write Notification via Page Protection by mprotect . . . 9
3.1.1 Steps . . . 9
3.1.2 Two Stage Signal Handling . . . 10
3.1.3 Pros and Cons . . . 11
3.2 Duplicated Write Operation to Trap Page (DupWrite) . . . 13
3.2.1 Assumption . . . 13
3.2.2 Memory Layout Example . . . 13
3.2.3 Trap Address Encoding . . . 14
3.2.4 Steps . . . 15
4 Implementation 17 4.1 Basis . . . 17
4.2 DWARF Debugging Standard . . . 17
4.2.1 debug info . . . 17
4.2.2 Function Prologue and debug frame . . . 18
4.3 Epilogue Scanner . . . 20
4.3.1 Epilogue Type 1 . . . 20
4.3.2 Epilogue Type 2 . . . 21
4.3.3 Special Case: Thread Termination . . . 21
4.4 DupWrite . . . 22
4.4.1 Code Instrumentation . . . 22
4.4.2 Fault Skipping . . . 23
4.4.3 Valgrind’s SIGSEGV Handling . . . 25
4.4.4 Write Across Two Words . . . 25
4.4.5 Modification to Valgrind’s Signal Handling Function . . . 27
5 Evaluation 30 5.1 Modifying Objects on Stack / Heap . . . 30
5.1.1 Modifying Objects on Stack Only . . . 30
5.1.2 Signal Handler Overhead . . . 31
5.1.3 Number of Chunks – Non-Stack Write-Op Relationship . . . 31
5.2 WsMp3d Webserver . . . 32 5.2.1 Throughput . . . 32 5.2.2 Profiling . . . 33 5.3 NetKit Telnetd . . . 36 5.3.1 Fault Detection . . . 36 5.3.2 Corrupt-Crash Distance . . . 37 5.4 NxN Matrix Multiplication . . . 37
5.4.1 NxN Matrix Multiplication Time . . . 37
6 Discussion 39 6.1 Architecture Dependancy . . . 39
6.2 Address Space Layout Randomization . . . 39
6.3 Signal Handling Overhead . . . 40
6.3.1 Write Target Analysis . . . 41
6.3.2 Merged Checking . . . 41
6.3.3 Hybrid Solution . . . 43
6.4 Trap Address Conflict . . . 45
6.4.1 64-bit Environment Memory Layout . . . 46
6.4.2 Common Factor of the Most Significant Bytes . . . 47
6.4.3 Write to Library Page Fault Elimination . . . 47
7 Conclusion 48 Bibliography 49 A Appendix 53 A.1 Evaluation 1’s Simplified Code . . . 53
A.2 Evaluation 4: Matrix Multiplication’s Simplified Code . . . 54
List of Tables
1 Monitored Memory Targets . . . 2
2 Experiment Environment . . . 30
3 Corrupt-Crash Distance . . . 37
List of Figures
1 An Overview of Beagle’s Framework . . . 3
2 Beagle’s Evaluation Result . . . 4
3 Working Flow of Method 3.1 . . . 11
4 Memory Layout Example . . . 14
5 Trap Address Encoding . . . 15
6 Example debug frame Section of Dwarfdump . . . 19
7 Simplified DupWrite Instrument Code . . . 23
8 Code Instrumentation Comparison . . . 24
9 Write Across Two Words . . . 26
10 DupWrite’s Example Fault Skipping Code . . . 28
11 Write Across Two Words Detection . . . 29
12 Flowchart of Signal Handling . . . 29
13 Modifying Objects on Stack Only . . . 31
14 Signal Handler Overhead . . . 32
15 Number of Chunks – Non-Stack Write-Op Relationship . . . 33
16 Throughput Measurement . . . 34
17 Profiling Result . . . 35
18 Fault Detection of NetKit Telnetd . . . 36
19 NxN Matrix Multiplication Time . . . 38
20 ASLR Activated . . . 40
21 Write Target Analysis . . . 42
22 Beagle2 No-Library Instrumentation Optimization . . . 44
1
Introduction
1.1
Background
Many researchers work on detecting various bugs that cause memory errors, e.g., buffer overflows, format string vulnerabilities, and integer over-flows. However, they usually tackle one class of the bug, leaving others unde-tected. We had implemented a tool on top of Valgrind [1], an instrumentation framework for building dynamic analysis tools, to fulfill this purpose named Beagle [2] . Beagle uses a “Backup and Verify” technique, which means to backup every desired target when they are created, and verify the correctness of the target constantly to achieve completeness, soundness, and immediacy.
1.2
Different Types of Memory Corruption
1.2.1 Stack Buffer Overflow
Stack buffer overflow, as known as stack smashing, has been a major security risk since the 1990s [3] [4]. The cause of this kind of vulnerability is that the saved registers including the return address is pushed onto the stack, and buffer overrun on the stack will corrupt the saved registers. If the saved register is control-related, like return address or last frame pointer, then by designing the overflow input carefully, the control sequence can be hijacked to execute arbitrary code.
1.2.2 Heap Buffer Overflow
Heap is where the dynamic allocated memory chunks are located at. Most of the C Libraries’ dynamic memory allocator, like the well known
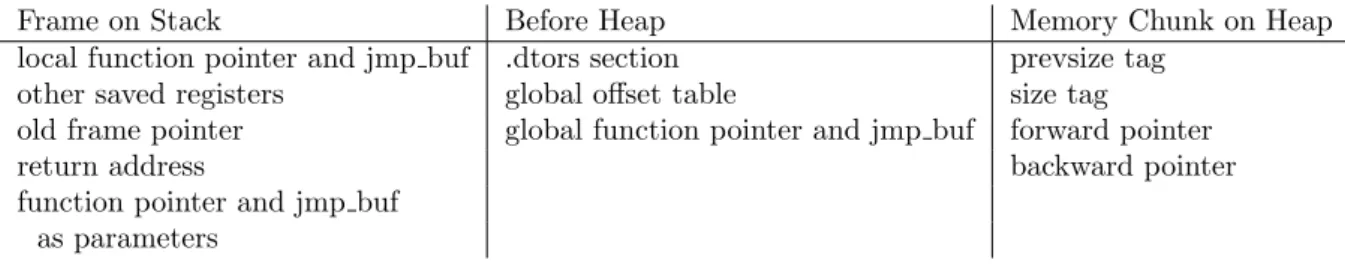
Table 1: Monitored Memory Targets
Frame on Stack Before Heap Memory Chunk on Heap local function pointer and jmp buf .dtors section prevsize tag
other saved registers global offset table size tag
old frame pointer global function pointer and jmp buf forward pointer
return address backward pointer
function pointer and jmp buf as parameters
dlmalloc [5], store the metadata in front of each chunk. Overflow on the heap causes the metadata to be overwritten. Although it is not intuitive that this could be a serious security risk, many research has been done to explore the exploitability of the non-control data hijacks [6] [7] [8] [9].
1.3
Defining Memory Targets
Table 1 lists the critical targets which have been proven that can be modified and led to arbitrary code execution. Most of the targets lie on the stack, and the rest on and before the heap. .dtors section is called when a program exits, and global offset table (GOT) is used as the entry points to dynamically linked library functions. If they are modified, when the function is called, the program can be redirected to execute the shellcode fed from user input.
1.4
Performance Analysis of Beagle
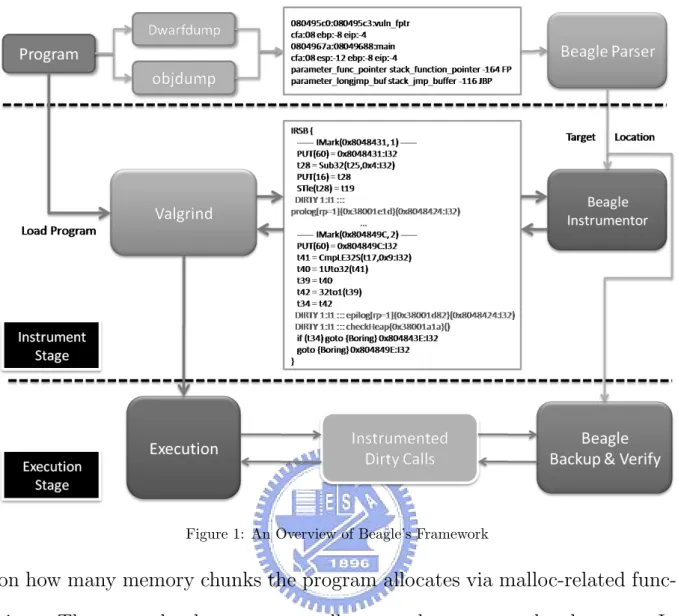
By using OProfile [10] , a system-wide profiler for Linux systems, we find out that Beagle spend most of its execution time verifying the correct-ness of the heap targets. Around 95% of time maximum Beagle is running the “checkHeap” function, which traverses and verifies every chunk’s meta-data the program has allocated. So the actual overhead is greatly depending
Figure 1: An Overview of Beagle’s Framework
on how many memory chunks the program allocates via malloc-related func-tions. The more chunks a program allocates, the more overhead we get. In contrast, memory targets on stack like return address or saved frame pointer are usually limited by the number of frames, which rarely exceeds 10 (except for recursive functions).
1.5
Problem Description
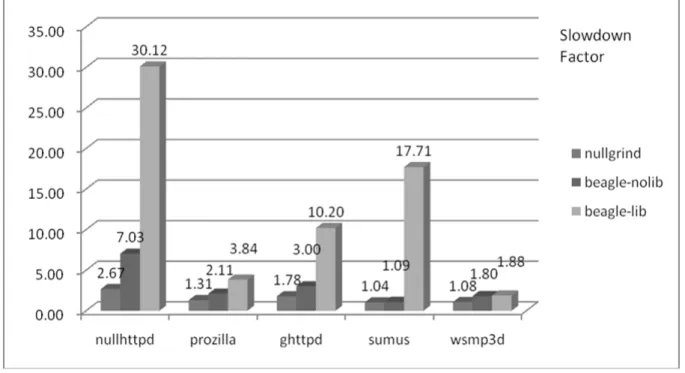
Because of the heavy overhead introduced by the massive security re-lated memory watchpoints during program execution, the runtime efficiency is greatly downgraded and not capable of real world applications. Current ap-proaches utilize software solutions to dynamically instrument checking func-tions to the data watchpoints. Our primary objective is to develop a new
Figure 2: Beagle’s Evaluation Result
method using existing hardware mechanisms such as page protection and debugging registers to achieve asynchronous detection of watchpoint modi-fication and improve the overall performance. Thus, we can practically use the tool in real world scenario to perform online-detection or to combine with fuzzers for software testing.
The thesis is organized as follows. In chapter 2, we introduce the related work in this field. Our method and implementation are covered in chapter 3 and 4. Chapter 5 contains the evaluation results, and finally, we present the discussion and conclusion part in chapter 6 and 7.
2
Related Work
2.1
Memory Watchpoint
According to GNU’s GDB Debugger’s definition, a watchpoint is which stops the program whenever the value of a variable or expression changes [11]. And a breakpoint stops the program whenever a particular point in the program is reached. So breakpoints are control-oriented, and watchpoints are data-oriented. Data watchpoint is related to our work because when the security targets we protect are changed, we have to stop the program and examine if the alteration is legal or not.
Breakpoints can be easily registered with hardware support, because we only have to watch the program counter. Data watchpoints in contrast, has limited hardware support. For example, the x86 architecture has debug registers to monitor at most four memory locations. GDB uses the debug register feature to accelerate watchpoint monitoring under four sites, and in older version it has to switch to single-step mode and lookup a watchpoint list when there are more than four watchpoints, so the overhead will be relatively high.
Researches have been done to extend the capability of hardware-assisted data watchpoints. It is suggested that the page protection mechanism on modern computer systems can be used to monitor the watchpoints. By set-ting the watchpoint’s located page as read-only, we can be notified when it is modified on page-level granularity [12] [13] [14] [15]. Newer version of GDB on some systems like HP-UX and MAC OS X has implemented this feature and the performance is better than single-stepping watchpoints.
2.1.1 How to Do A Million Watchpoints: Efficient Debugging
Using Dynamic Instrumentation (EDDI)
Our main idea of using memory protection mechanism comes from this work by Zhao et al. [16]. It mainly describes how to implement efficient data structures to hold the addresses of the watchpoints, and a few optimiza-tion for software watchpoint via dynamic instrumentaoptimiza-tion to make watch-point monitoring scalable. Their full instrumentation injects checkers to all memory write operations, and the partial instrumentation is based on the page protection mechanism. Asynchronous checking is triggered because the watchpoint’s located page is read-only and the checking procedure is called in the segmentation fault handler.
2.2
Memory Corruption Detection
Memory corruption detection aims at finding out invalid modification to specific memory locations in a sound and complete manner, so it can be treated as an application of memory watchpoint. This technique is usually used to combat attacks on critical targets we defined in Table 1.
The detector must have the knowledge about whether the modification is valid or not. For example, stack smashing modifies the saved frame pointer, and after function epilogue, the location of the saved frame pointer of the last frame will be reused and modified, so we have to differentiate an attack from normal operations.
StackGuard [17] uses a canary approach. A canary is a word which has a special value placed in front of the return address on the stack. The canary will be overwritten before the saved registers are modified. Prior to
function return, the canary is verified to see if the saved registers are safe. Modern version of GCC has integrated the stack protector into itself and provide an option to enable it, and the canary is place before the saved registers. However, if the overwrite action is not sequential, the canary can be bypassed easily.
Backup-and-verify is another approach to justify the correctness of saved registers. When the registers are pushed onto stack, their value is also saved to another safe region. Before the function returns, the saved register’s value is compared to the backup value. Stack Shield [18] uses such method to detect memory corruption.
2.2.1 Detection and Diagnosis of Control Interception (Beagle)
Our previous work Beagle also uses the backup-and-verify method to detect the memory corruption errors. The difference is that Beagle uses dynamic instrumentation and inserts checker calls at the end of each basic block of the dynamic instrumentor’s intermediate representations. In this way we can provide more accuracy with respect to the actual location of the memory corruption site. It is useful for debugging because finding out that the saved registers are corrupted at the end of a long function may be too far away from the bug which causes the corruption.
2.2.2 Automated Security Debugging Using Program Structural
Constraints (CBones)
CBones is similar to Beagle, and the modification to memory targets is a subset of CBones’ program structural constraints [19]. It implements a two-stage approach: at the first level, insert the constraint checkers before
function return like Stack Shield to reduce overhead. If any constraint vio-lation is found, then re-run the program and instrument checkers after each write operation to provide more accurate debugging information. Although the coarse-to-fine manner helps on increasing the performance, if the pro-gram input is from outside, like network propro-grams, and not repeatable, then it can only report the error spot at the end of the function where the checker is. Also, CBones does not cover all the memory targets we defined in Table 1.
2.3
Combination
By combining data watchpoint optimization and memory corruption detection together, we can build a robust and cost-effective detector for se-curity or debugging purpose.
3
Method
3.1
Memory Write Notification via Page Protection
by mprotect
The mprotect() function is used to change the protection status of a designated memory region. Most machine architectures provide the memory protection mechanism on page level. A memory page can be set to read-only, write-only, read and write capable, or no access. When a page is read only, any modification to it is treated as an invalid operation, and the hardware’s memory management unit (MMU) will generate an exception to inform the operating system. The kernel will send out a SIGSEGV signal to the access violating process. If we install a SIGSEGV handler, then we can monitor the memory modification to specific regions by setting the regions as read only.
3.1.1 Steps
We generalize our idea as the following steps:
1. In the malloc() function wrapper, use mprotect() to set the allocated chunk’s page to read-only.
2. Write to the read-only page will cause a segmentation fault.
3. Verify the correctness of the metadata in the SIGSEGV signal handler.
4. In the signal handler:
- If the metadata is corrupted, halt the program execution and print backtrace message for debugging.
3.1.2 Two Stage Signal Handling
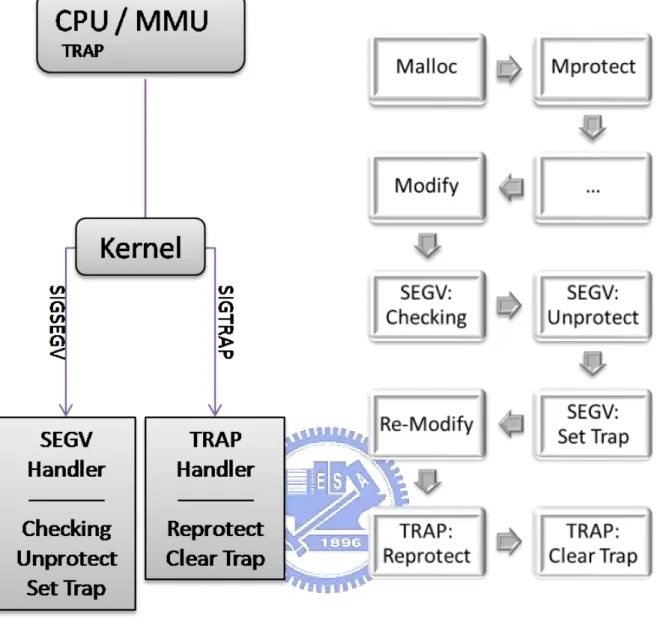
When fault happens, typically the reason of the fault should be fixed in the related signal handler. After the signal handler returns, the fault instruction will be restarted. In the SIGSEGV handler, if we do not unprotect the page, then the fault instruction will continue to generate a new fault, which forms an endless loop. So we have to unprotect the page to make it writable. But after the write instruction is executed, the following write instructions to the same page will not generate faults anymore because the page is now writable, and the asynchronous mechanism simply stops working. Apparently the page should be again read only immediately after the write operation is done. A way to achieve that is to put the CPU into single-step mode. Single-single-step mode is usually used for debugging purpose. Many CPU architectures support this feature. In x86 architecture, there is one bit in the EFLAGS register indicating the on / off status of single-step mode called TRAP flag. When TRAP flag is set, CPU will issue a SIGTRAP signal after each instruction is executed. We can use this feature to reprotect the page in the SIGTRAP handler, and then clear the TRAP flag to leave single-step mode.
Two stage signal handling consists of the first stage’s SIGSEGV han-dling, and the second stage’s SIGTRAP handling. Figure 3 shows the flow chart of this method. Very similar method was proposed in VAX DEBUG by Beander et al. [12] back in 1983, but it has not been popular and widely implemented on mainstream debuggers until this decade when computing power is faster enough to make the overhead from signal handling compara-tively lower. For example, not until the release of Mac OS X 10.1 in 2001, the
Figure 3: Working Flow of Method 3.1
page protection watchpoint has been implemented on Mac OS X’s gdb [20].
3.1.3 Pros and Cons
In the method proposed above, there are some good perspectives with respect to other methods. First of all, we do not have to do read / write redirection. In EDDI’s partial instrument, it creates shadow pages and in-struments read / write operations to be redirected to access the shadow area. And the memory usage overhead is twice. In contrast, our method do not allocate extra memory space. Also, we can implement this method by using
only function wrappers to replace the original malloc-related functions, and we do not have to deal with the dirty assembly instrumentation job. So the solution is pretty portable.
Though this method looks promising, it has several severe disadvantages. The overhead in signal handling is too high, because one write operation triggers two signals, and four context switches happen. Not to mention that mprotect() is used twice in the signal handlers. Second, Valgrind just ignores the trap flag set in the CPU’s context, so it is not easy for us to integrate this method into our existing Beagle framework.
3.2
Duplicated Write Operation to Trap Page
(DupWrite)
Instead of using mprotect() to protect the pages, we develop another method to achieve asynchronous hardware-assisted checking, by playing a trick based on the existing memory layout convention.
3.2.1 Assumption
Our method focuses on reducing the checking time on heap targets, which accounts for most of the overhead in Beagle. The basic assumption is that, typically a program access objects on stack more often than objects on heap. We use a method to redirect the reference to heap to a trap area, while reference to stack remains the same by the “Trap Address Encoding” scheme. First, we take a look at an example of memory mapping.
3.2.2 Memory Layout Example
Figure 4 shows a process’s memory mapping ran by Valgrind with our Beagle plug-in. The top section is for dynamically loaded libraries. In this example we see libc.so there. The following space is an unmapped gap between the dynamic library section and the program. The area af-ter 0x08048000 is where we are familiar with: a program’s text section, data section, bss section, and before the next gap, the heap section. A little differ-ence here between this case and running normal applications is that an extra section is mapped for our Valgrind plug-in. The process’s stack is located in the bottom of the memory under 0xbfeb0000.
Figure 4: Memory Layout Example
3.2.3 Trap Address Encoding
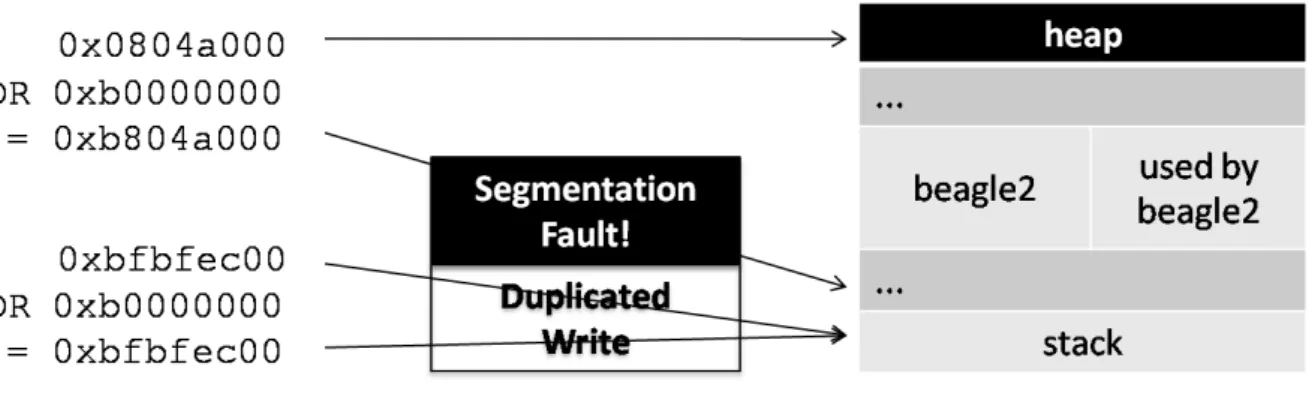
This is a simple and intuitive idea we proposed to redirect non-stack references to unmapped regions. And we call the redirected address a “Trap Address”, because any write to that unmapped address will trigger a seg-mentation fault. Trap address encoding is done by logically ‘ORing’ the upper byte of the target address with the upper address byte (UAB) of the stack region. Any address pointed to the stack OR the UAB of the stack region will produce the same address. Similar encoding method is proposed by Wahbe et al. to isolate the fault in software-based manner [21]. In our method, addresses pointed to heap or other region after encoding will point to somewhere before the stack, and it is likely to be unmapped and inaccessible. Figure 5 is an example of the encoding result. We derive the stack’s starting address,which is 0xbfeb6000, from the memory map of Figure 4. The most significant byte is 0xb, so we will OR all the write target ad-dress with 0xb0000000. An adad-dress 0xbfbfec00 points to the stack, and
Figure 5: Trap Address Encoding
0xbfbfec00 OR 0xb0000000 is still 0xbfbfec00 in a legal area. Another ex-ample address 0x0804a000 points to the heap, and ORing it with 0xb0000000 produces 0xb804a000. Look up the address 0xb804a000 in Figure 4, and we cannot find any mapped region covers that address. Obviously it points to the gap in front of the stack region, so any non-stack target address will be redirected to an unmapped area by the encoding process.
3.2.4 Steps
Now we can describe the steps needed to implement the DupWrite method:
1. Monitor all write-to-memory operations.
2. Before the write operation:
- Compute a new target address by the trap address encoding scheme.
- Insert a new write operation to the computed target address.
3. The new instruction will write to an unmapped page and trigger a seg-mentation fault.
4. Check the correctness of heap targets in the segmentation fault handler.
5. Jump through the fault instruction and continue to execute the original write instruction.
Note that by the trap address encoding scheme, references to stack re-mains the same, so we cannot deploy the asynchronous monitoring on stack objects. This is all right because the major part of the overhead that we want to reduce comes from checking the heap targets. The old method mon-itoring the control-related targets on stack is fairly good enough. If we use the DupWrite method to watch the stack targets, the total signal handling penalty would be too high. It is also suggested that not to use page protection watchpoints on stack or it will work very poorly.
4
Implementation
During the evaluation stage of Beagle, a new version of implementation is forked and named Beagle2. Beagle2 is a complete rewrite of Beagle. With the experience we learned from Beagle, Beagle2 is better designed with signif-icant performance increase, cleaner code and additional useful features. And the DupWrite method for asynchronous heap target checking is integrated into Beagle2.
4.1
Basis
Valgrind version 3.3.1 is our dynamic instrumentation back-end for Beagle2. The up-to-date version of Valgrind is 3.4, which provides more functionality. But in our implementation of Beagle2, the 3.3.1 version is sufficient for our purpose.
4.2
DWARF Debugging Standard
DWARF is a debugging file format defined by the DWARF Standards Committee [23]. The debugging information is generated by compilers when compiling a program and stored in the debug * sections. It can be used by debuggers to generate various useful information for debugging purpose. The current version of DWARF is 3.0.
4.2.1 debug info
Beagle2 can use two classes of DWARF information: debug info’s LO-CAL SYMBOLS and debug frame. In LOLO-CAL SYMBOLS, we can derive
the targets’ locations, like the offset to the frame pointer when a target is on the stack, or the absolute address when the target is a global variable. Then when the program is running and the function’s frame is created, our monitor can know where exactly the protected targets’ locations are. It is primary used for the variable targets such as function pointers, and jmp bufs.
4.2.2 Function Prologue and debug frame
Debug frame is the information about how compilers wind the activation record. The sequence of pushing the return address, last frame pointer, and other saved registers onto stack is called prologue. The info can be used for debuggers to unwind the frame. In the past many checkers use the saved frame pointers to traverse the frames. But nowadays many programs use the omit frame pointer optimization option in the compiler, and the frame pointer register can be used for general purpose. Without using the frame pointer register, there are no saved frame pointers on the stack.
Fortunately the debug frame information provides a solution for us. We treat the return address and the last frame pointer the same as other saved registers. And in the debug frame section, their positions are all relative to a virtual pointer named Call Frame Address (CFA). It provides an offset from a fixed register to the CFA, and then we can find out the other saved regis-ters’ locations. This is how we work to conquer the frame pointer omitting situation. By backing-up the saved registers’ value after stack winding is done, we can verify the correctness of them before they are poped.
4.2.3 Parsers
< 0><0x8048484:0x8048545><multiply><fde offset 0x14 length: 0x14><eh offset none> 08048484: <off cfa=04(esp) > <off eip=-4(cfa) >
08048485: <off cfa=08(esp) > <off ebp=-8(cfa) > <off eip=-4(cfa) > 08048487: <off cfa=08(ebp) > <off ebp=-8(cfa) > <off eip=-4(cfa) >
Figure 6: Example debug frame Section of Dwarfdump
standalone program dwarfdump. Because the API is a little complicated to use, instead we build a parser to parse the output from dwarfdump, and then the result will be read during the initialization stage of Beagle2.
Figure 6 is how the dwarfdump’s debug frame section looks like. First line provides the information about the function, which is multiply() in the example. Under the first line is the stack winding process instruction by instruction. We can see at first, the instruction pointer eip is pushed. Then in the next instruction, the frame pointer ebp is pushed. The third step moves the stack pointer by adding the frame’s size, so we can see that the reference location of CFA changes from the stack pointer register esp to the current frame pointer register ebp.
We fetch the function’s start address, the end address, and the address where function prologue is done for Beagle2. When executing a program, if Beagle2’s instrumentor meets an instruction after a function’s prologue is done, Beagle2 inserts a dirty call to the backup function of Beagle. The backup function will record the value of the saved registers according to the offset information that we derived from dwarfdump before program execu-tion, and save them in our backup saved register stack.
4.3
Epilogue Scanner
We have the function prologue knowledge from the debugging info, with the prologue’s start addresses. Every function will do exactly one prologue process after it is invoked, but a function may have multiple exit points. The stack unwinding process is called the epilogue of a function. In DWARF 3.0, it is defined that a function epilogue’s start addresses should be written in the debugging info.
Unfortunately gcc does not generate the epilogue info yet to meet the standard, which is mentioned in a technical report Reversible Debugging [25]. Thus we build a epilogue scanner to scan through the disassembled code. By recognizing special epilogue assembly patterns, we can find out where epilogue happens in the function. MSDN Library has an article about the software conventions on the x64 architecture, which includes x64’s prolog and epilog convention [26]. The prolog and epilog convention on x64 is very similar to the one on x86, and in the following section we describe different types of common C language epilogue in the x86 architecture.
4.3.1 Epilogue Type 1
leave ret
The ‘leave’ instruction does the inverse of the ‘enter’ instruction, which adjust the stack pointer to the location of the saved frame pointer, and then pop the saved frame pointer. It is equivalent to:
pop %ebp ret 4.3.2 Epilogue Type 2 add $0x20,%esp pop %ecx pop %ebx pop %ebp lea -0x4(%ecx),%esp ret
The first step of this type’s epilogue is to adjust the stack pointer to pop all the fixed-allocation-size local variables in the current frame. Then pop the saved registers in reverse order of the pushes in prologue. To recognize this type of epilogue, we scan through the instruction from the ‘ret’ instruction. Keep going upwards and ignore the ‘pop’ and ‘lea *,%esp’ stack adjusting instructions until we reach the first step of epilogue, the ‘add *,%esp’ instruc-tion. If we encounter instructions which are not related to ‘pop’ or stack adjusting, the previous instruction of that is the start of the epilogue process because sometimes there are no saved registers and only a ‘ret’ instruction presents the whole epilogue.
4.3.3 Special Case: Thread Termination
When a thread terminates, it need not return to the thread creator function, thus it does not have the epilogue action. But we still have to know where the thread terminates in order to pop our own backup stack,
so we use a pthread exit() wrapper to insert the stack-pop function after the thread is terminated.
4.4
DupWrite
Here we describe the detail when we implement the DupWrite method. Although the method looks straight forward, there are still some challenges we have to conquer.
4.4.1 Code Instrumentation
Valgrind3 translates all host machine’s instructions in a basic block into its VEX IRs (Intermediate Representations), and then convert them back to the host instructions to execute. It provides us a window to peek at and instrument on the translated VEX IRs.
All write-to-memory instructions are transformed into VEX’s store IR. Because libVEX produces static single assignment (SSA) IRs, the IR writes the data into the target address in a temporary register used only once in a basic block allocated by Valgrind.
STle(t3)=t0
The example IR above means that: store (ST ) the value in the tempo-rary register t0 to the target address in t3 in little endian order (le).
VEX library translates the x86 instruction
8048466: c6 00 6b movb $0x6b,(%eax)
into:
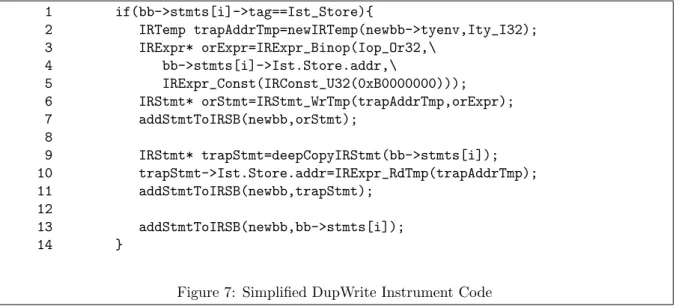
1 if(bb->stmts[i]->tag==Ist_Store){ 2 IRTemp trapAddrTmp=newIRTemp(newbb->tyenv,Ity_I32); 3 IRExpr* orExpr=IRExpr_Binop(Iop_Or32,\ 4 bb->stmts[i]->Ist.Store.addr,\ 5 IRExpr_Const(IRConst_U32(0xB0000000))); 6 IRStmt* orStmt=IRStmt_WrTmp(trapAddrTmp,orExpr); 7 addStmtToIRSB(newbb,orStmt); 8 9 IRStmt* trapStmt=deepCopyIRStmt(bb->stmts[i]); 10 trapStmt->Ist.Store.addr=IRExpr_RdTmp(trapAddrTmp); 11 addStmtToIRSB(newbb,trapStmt); 12 13 addStmtToIRSB(newbb,bb->stmts[i]); 14 }
Figure 7: Simplified DupWrite Instrument Code
The move-a-byte instruction is translated to storing a 8-bit immediate which is 0x6b to the target address stored in temporary register t14.
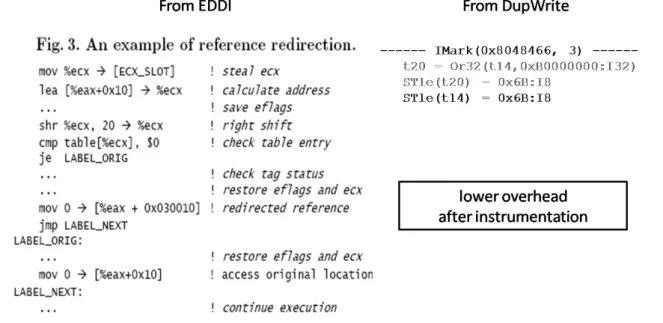
Figure 7 is DupWrite’s code in Beagle2’s instrument function. On line 1 we check whether the current statement (bb->stmts[i] ) is a store IR. If yes, then we tell Valgrind to allocate a temporary register on line 2. From line 3 to line 7 we insert a logical OR statement to store the encoded trap address to the newly allocated register. Line 9 duplicates the original write statement by the deepCopyIRStmt() function, but instead write to the original target address, we replace it with the encoded trap address stored in the new register on line 10. Finally we insert the duplicated write statement in front of the original write statement on line 11 and line 14, respectively. Figure 8 shows the comparison between EDDI Partial Instrument’s reference redirection and our DupWrite method. Apparently there are less instrumented instructions in the DupWrite method.
4.4.2 Fault Skipping
Figure 8: Code Instrumentation Comparison
be resolved in the signal handler, and the fault instruction will be restarted after returning from the signal handler. But how do we fix the fault? There are several registers that x86 write instructions use as the target index. We have to do a lot of work to find out which register stores the target address by looking at the machine code, and then directly modifies the value of the target address to fix the fault.
The way to modify the target address requires too much effort, so we only examine the length of the write instruction, and add the length as the jump offset to the instruction pointer in the signal handler. Instead of restarting the fault instruction, the modified instruction pointer now points to the next instruction, which is the original write instruction before instrumentation. The actual write action is done by the original instruction, and the fault instruction we insert is only a trap, if the target points to a non-stack area. On the other hand, if the target address points to the stack area, the write to the same address happens twice with no side-effect and only negligible
overhead.
4.4.3 Valgrind’s SIGSEGV Handling
When a SIGSEGV signal happens, Coregrind, which is the core part of Valgrind, receives the signal from the host because the signal is caused by a fault instruction. In Coregrind, the sync signalhandler() function is the handler of SIGSEGV. It first calls the fault catcher function set in our Beagle2 plug-in, and provides the fault catcher various information just like the siginfo structure does. We have to do the heap target checking in Beagle2’s fault catcher. The reason that we cannot implement the checking in Coregrind’s sync signalhandler() is that the code in Coregrind cannot access the data structures in the Beagle2 plug-in.
After returning from the fault catcher, Coregrind checks that if the segmentation fault is caused by the need to automatically growing the stack. This is Valgrind’s implementation issue and results in some performance overhead. After the checking is done, if the fault instruction is generated by Valgrind, which means that it is the output after a program’s instruction is translated and instrumented, then finally Coregrind delivers the signal to the running program. We have to add the fault skipping part right before SIGSEGV is delivered to the running program, or it will just halt execution because there is no SIGSEGV handler in the running program and the default action of SIGSEGV is abort.
4.4.4 Write Across Two Words
Under UNIX environment, it is defined that when a signal occurs, the signal handler installed by sigaction() will receive a pointer to a siginfo t
Figure 9: Write Across Two Words
structure. If the signal is SIGSEGV, the siginfo t structure will contain a member named si addr, which is the address of the faulting memory refer-ence.
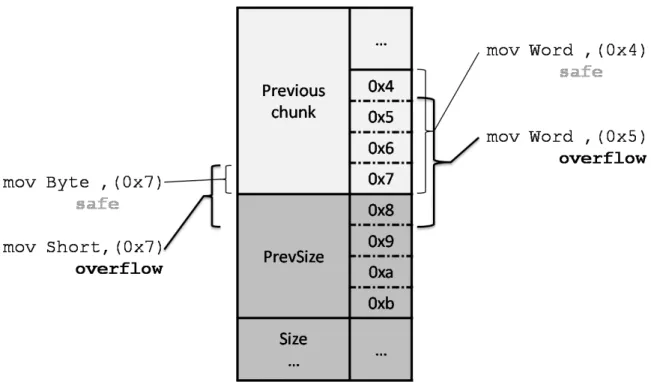
From the previous section, we know that Coregrind’s signal handler will first consult the fault catcher registered in our Beagle2 plug-in. Coregrind will also send the faulting address to the fault catcher, and in our fault catcher we use the faulting address to query if it points to a heap chunk’s metadata. Derived from dlmalloc, GNU glibc’s malloc aligns a memory chunk’s head to a multiple of 8, because the last three bits of a memory chunk’s size tag are used for status flags, thus it is guaranteed that chunk heads are aligned to 32-bit words [9]. A problem arises when writing memory of different sizes. Figure 9 shows the scenarios of the problem.
The grey chunk starting from 0x8 in the figure is a chunk next to the previous allocated chunk. The 32-bit word at 0x8 is the chunk’s prevSize
tag. In our fault catcher, if we get a faulting address which is 0x7, it is not overlapped with the next chunk, but we cannot differentiate how long the instruction will write. If it is a move byte instruction, then it will not write to the next chunk. If the write length is over a byte, for example, a short or a word, then overflow occurs.
From another perspective, considering two instructions writing a word to 0x4 and 0x5, the one write to 0x4 is safe, and the one write to 0x5 will overflow to the next chunk. Both 0x4 and 0x5 is not in the range of the next chunk, so we must add some information in the faulting address to inform our heap target validator in the fault catcher about how long the instruction is trying to write.
The solution comes from the same idea of using the last three bits of a chunk’s size tag as status flags in various memory allocators. We use the last bit of the faulting address only. If the last bit of the faulting address is set, then the next word will be affected, and we will do an extra query to see if the next word of the faulting address is in the range of metadata or not, and the precision problem is solved.
4.4.5 Modification to Valgrind’s Signal Handling Function
Combining section 4.4.2 and 4.4.4 together, we patch the sync signalhandler() function in Coregrind. The following code snippet is a simplified example to show how our implementation works.
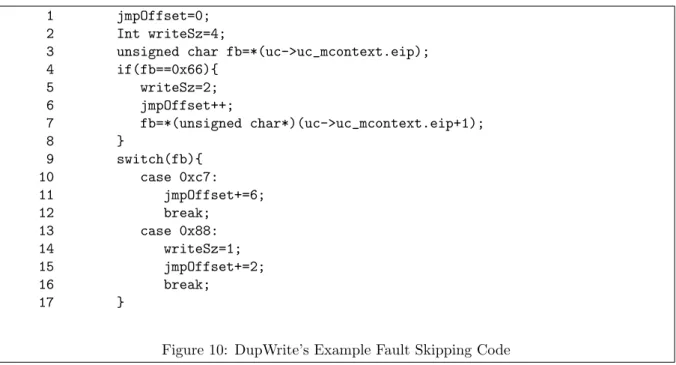
On line 1 of Figure 10, jmpOffset denotes the length of the fault instruc-tion. Then writeSz is how long the instruction is trying to write. The default write length is a 32-bit word, which is 4 bytes. We fetch the first byte of
1 jmpOffset=0; 2 Int writeSz=4;
3 unsigned char fb=*(uc->uc_mcontext.eip); 4 if(fb==0x66){ 5 writeSz=2; 6 jmpOffset++; 7 fb=*(unsigned char*)(uc->uc_mcontext.eip+1); 8 } 9 switch(fb){ 10 case 0xc7: 11 jmpOffset+=6; 12 break; 13 case 0x88: 14 writeSz=1; 15 jmpOffset+=2; 16 break; 17 }
Figure 10: DupWrite’s Example Fault Skipping Code
the machine instruction in line 3. From line 4 to line 8, if the first byte is 0x66, it is a special opcode prefix to change the write length from 32-bit to 16-bit [27], and we have to set the writeSz from 4 bytes to 2 bytes accord-ingly. The length of the instruction includes the prefix byte, so jmpOffset is increased by one.
After checking the prefix byte, we look at the opcode byte. The instruc-tion length varies between different kinds of operainstruc-tions. For instance, 0xc7 writes a 16-bit / 32-bit immediate to the target memory location, and the whole instruction occupies 6 bytes. Another example is that 0x88 write the 8-bit section value of a register to a target byte. So we set the writeSz to 1 byte and the instruction’s length is two bytes.
We then use the information to call our fault catcher. Line 1 of Figure 11 checks if the faulting address is not a multiple of 4. If it is a multiple of 4, then it will not overflow to the next word no matter it writes a byte or a word, so we can just simply call the fault catcher in line 10. Otherwise we have to consider the write size and set the last bit.
1 if((off=((Addr)info->VKI_SIGINFO_si_addr & 0x3))){ 2 if((off+writeSz)>4) 3 (*fault_catcher)(sigNo,\ 4 ((Addr)info->VKI_SIGINFO_si_addr & 0xFFFFFFFC)+1); 5 else 6 (*fault_catcher)(sigNo,\ 7 ((Addr)info->VKI_SIGINFO_si_addr & 0xFFFFFFFC)); 8 } 9 else 10 (*fault_catcher)(sigNo, (Addr)info->VKI_SIGINFO_si_addr); Figure 11: Write Across Two Words Detection
Figure 12: Flowchart of Signal Handling
uc->uc_mcontext.eip+=jmpOffset;
After the fault catcher returns, we just add the offset to the instruction pointer in the machine context and the fault skipping is done. Figure 12 is the flowchart of the signal handling process. When the trap page is accessed, the operating system sends a SIGSEGV signal to Coregrind asynchronously. Then the fault address si addr is modified from the write-across-two-word detection. The new fault address is sent to Beagle2’s checker. If the write is legal, the instruction pointer is modified and the program will execute the original instruction to write the target.
5
Evaluation
This chapter is divided into four sections to evaluate Beagle2 with our DupWrite method in different aspects. The experiment environment is describe in Table 2.
5.1
Modifying Objects on Stack / Heap
We develop a small program that takes arguments to adjust the number of memory chunk to allocate, the number of write operations to heap targets, and the number of write operations to stack targets. Then we run the eval-uation program with both Beagle and Beagle2, and compare the execution time, which is the shorter, the better. The program’s source code is listed in Appendix 1.
5.1.1 Modifying Objects on Stack Only
Figure 13 is the comparison result of modifying objects on stack only, and the control variable is the number of allocated chunks. The none line represents the result with the Nullgrind plug-in, which does no instrumenta-tion. We can see that in this case, Beagle2 is as good as Nullgrind regardless of the number of allocated chunks. But the execution time of Beagle, which
Table 2: Experiment Environment
CPU Intel(R) Pentium(R) 4 CPU 3.40GHz stepping 03
Memory 2GB
Linux Kernel 2.6.26
Linux Distribution Fedora Core 8 Compiler gcc 4.1.2
Figure 13: Modifying Objects on Stack Only
uses a active checking mechanism on heap targets, grows linearly with the amount of allocated chunks.
5.1.2 Signal Handler Overhead
Next, we run Beagle2 alone and adjust the number of write operations on heap targets. As expected, when the percentage of non-stack writing is high, the SIGSEGV handler is invoked more often and the overhead on signal handling adds up to the total execution time. Figure 14 shows the impact from signal handling.
5.1.3 Number of Chunks – Non-Stack Write-Op Relationship
Figure 15 is the result that we take the two sections above into consid-eration. The right horizontal axis represents the number of allocated chunks, and the left horizontal axis represents the non-stack writing percentage, in logarithm scale. The vertical axis is the execution time, also in logarithm
Figure 14: Signal Handler Overhead
scale. As we can see, when non-stack writing percentage is low, Beagle2 with asynchronous checking outperforms Beagle. Only when the non-stack writ-ing percentage is too high, Beagle2 spends more time on signal handwrit-ing and only does better than Beagle when there are a lot of allocated chunks to be verified.
5.2
WsMp3d Webserver
WsMp3d is a media streaming daemon to broadcast mp3 music files, and it also includes a small httpd to provide a web interface to access the files. In this section we measure the average throughput to get a 12MB file 20 times and compute the average from the simple httpd ran by Beagle2 and Beagle separately. The version of WsMp3 we use is 0.0.9.
5.2.1 Throughput
Figure 15: Number of Chunks – Non-Stack Write-Op Relationship
throughput, which means it performs better than Beagle2. In this experiment Beagle2 is about two times slower. From the previous evaluation, we can deduce that the overhead is mainly from signal handling.
5.2.2 Profiling
In this part we do profiling to examine the performance bottleneck of Beagle and Beagle2. The profiler we use is OProfile 0.9.4. In Figure 17, the right chart is the profiling result of Beagle, and the left chart is the result of Beagle2.
We have indicated that the checkHeap() function accounts for 95% of execution time in the introduction chapter. 95% is when we do instrumen-tation to insert heap checking in library function’s basic blocks. We have improved Beagle’s performance by assuming that the library function’s be-havior is correct and we will do the verification upon returning from outside
Figure 16: Throughput Measurement
library functions, and there is no instrumentation during running library functions.
Despite the fact that Beagle’s performance has been greatly improved by the no-library instrumentation optimization, from Figure 17 we can notice that the heaviest loading still comes from the checkHeap() function. About half of the execution time Beagle is checking the heap targets.
In Beagle2’s profiling chart, sync signalHandler() is the signal handler we patched in Coregrind, and handler() is the registered fault catcher which does heap target checking in the Beagle2 plug-in. The checking function is implemented efficiently and only introduces little overhead. The verify() function provides the same functionality compared to Beagle’s epilog() func-tion, which does the checking on stack objects. Running time in doRegister-Allocation() slightly increases because of DupWrite’s Trap Encoding Scheme, which need to allocate an extra register to store the encoded trap address.
Figure 17: Profiling Result
we believe that the extra overhead resides in the ‘other’ ’s slice.
1.4132% anon (tgid:13526 range:0x626bf000-0x634d2000)
The line above is from OProfile’s report. It states that 1.4132% of time is in an anonymous code area ranging from 0x626bf000 to 0x634d2000. We investigate Coregrind and find out that the area is where the JIT compiler put the output native instruction transformed from the instrumented VEX IRs. Different basic block’s output may be placed on different areas, so the total amount of time of executing anonymous areas is the execution time of the original program plus the instrumented operations. In this case, the instrumented operations is the Trap Encoding and Duplicated Write operations. And the overhead from context switching may be hidden as well. There are too many anonymous areas being executed, and OProfile can-not combine them altogether. We cancan-not directly get the total time of exe-cuting the anonymous area but we can guess that the total amount of time is
[BEAGLE2] attempt to write heap chunk 0x805D008’s prevSize tag! [BEAGLE2] error encountered: thread 1’s stack:
==32088== at 0xA6EE39: _IO_default_xsputn (in /lib/libc-2.7.so) ==32088== by 0x804943F: recv_ayt (telnetd.c:1161)
==32088== by 0x804BCEB: telrcv (state.c:176) ==32088== by 0x804E2BA: ttloop (utility.c:122) ==32088== by 0x804A2B4: main (telnetd.c:429)
Figure 18: Fault Detection of NetKit Telnetd
remarkable. Because this evaluation continuously pull files from the httpd, and it does write operations a lot and duplicating the write operations will enlarge the overhead. If a program only does write instructions, the over-head will be at least twice because of the write operations are twice. As a matter of fact, in write-intensive programs, Beagle2’s runtime overhead will also increase, so the throughput slowdown is reasonable.
5.3
NetKit Telnetd
NetKit Telnetd is a telnet daemon derived from BSD source code. It has a heap overflow vulnerability according to CERT Advisory CA-2001-21 [28]. The code size is about 6300 lines.
5.3.1 Fault Detection
We run a exploit code to trigger the heap overflow vulnerability in NetKit Telnetd. Figure 18 is the output result from Beagle2. Beagle2 founds that an allocated chunk at 0x0805D008’s prevSize tag is being overwritten and go to the backtrace function. The backtrace function uses the saved re-turn addresses information stored in our backup stack to print the complete backtrace. The first instruction at 0xA6EE39 is the faulting instruction which causes the overflow.
Table 3: Corrupt-Crash Distance Tool Distance Beagle2 0 Beagle 230
5.3.2 Corrupt-Crash Distance
Table 3 is the distance between the corrupt site and the crash site. The corrupt site is where the target we protect to be corrupted, and the crash site is where the data corruption cause the program to crash. The distance is how many instructions are executed between the two sites.
As shown in Table 3, the distance of Beagle is 230 instructions. Because Beagle only calls the checker at the end of a basic block, a few instructions will still be executed until the checker finds out that the target is corrupted. Beagle2 on the other hand, identifies the corruption immediately in the signal handler. It is useful that the immediacy will provide the accuracy in the backtrace for user debugging.
5.4
NxN Matrix Multiplication
In section 5.2, we evaluate Beagle2’s writing performance by measuring the throughput of a write-intensive program. In this section, we run a N by N Square Matrix Multiplication program to evaluate the computing per-formance when running Beagle2. The program computes C = AB, where matrices A,B, and C are dynamically allocated on the heap. The simplified source code is listed in Appendix 2.
Figure 19: NxN Matrix Multiplication Time
Figure 19’s horizontal axis is the array’s width. Only when N is less than 10, Beagle does better than Beagle2. When N increases, Beagle’s execution time grows dramatically, while Beagle2’s execution time only rises a little. The main reason is that the program allocate a chunk for each column of a matrix. When N becomes larger, more chunks are allocated and their metadata needs to be verified after each basic block in Beagle.
Beagle2’s asynchronous checking only does the verification upon finish-ing computfinish-ing an element of matrix C and writfinish-ing it to the heap storage. The row to column multiplication’s temporary value are all stored on the stack. Our DupWrite method is specially optimized for memory reading and stack writing, so the performance difference between Beagle2 and Beagle is huge.
6
Discussion
In this chapter, we will talk about the limitations of the DupWrite method and some possible solutions of them.
6.1
Architecture Dependancy
Beagle2 lies on top of Valgrind. By now, Valgrind supports linux with four different architectures: x86, x86-64, PPC32, and PPC64. OSX and BSD support are under development. Currently Beagle2 cannot run on platforms other than the x86 architecture because the epilogue scanner and the instruc-tion skipping calculainstruc-tion we meninstruc-tioned in the implementainstruc-tion chapter refer to x86 instructions. However, the algorithms we described are generic and can be easily ported to other architectures as long as the instruction sets of different architecture are studied carefully.
6.2
Address Space Layout Randomization
Address Space Layout Randomization (ASLR) is a security technique developed to prevent the injected shellcode being executed [29]. Without ASLR, every time a program is executed, the variables’ locations are fixed, so there are tools, like the Metasploit Project [30], can easily generate an exploit input. With ASLR, the buffer’s location will be different all the time and the target shellcode address cannot be predicted. This makes the ordinary exploit scheme useless.
Figure 20 is an example memory layout of two running instances of the same program. The mapping is slightly different. However, it does not make
$ cat /proc/20436/maps |grep stack
bf8d1000-bf8e6000 rw-p bffeb000 00:00 0 [stack] $ cat /proc/20436/maps |grep heap
090da000-090fb000 rw-p 090da000 00:00 0 [heap] $ cat /proc/20437/maps |grep stack
bff50000-bff65000 rw-p bffeb000 00:00 0 [stack] $ cat /proc/20437/maps |grep heap
09077000-09098000 rw-p 09077000 00:00 0 [heap] Figure 20: ASLR Activated
a big difference and the most significant byte does not change at all. If it really changes, given that stack still remains at the bottom of the memory, and heap on the top, we can extract the UAB (Upper Address Byte) after the memory mapping is done by querying the proc filesystem’s maps information of the process.
ASLR is implemented and enabled on linux systems since the 2.6.12 kernel. Windows Vista, OpenBSD, and Mac OS X also has some support for ASLR. Note that Valgrind manages the memory layout by itself and bypasses ASLR, so the stack position is fixed and we do not have to deal with this problem as long as our tool is depend on Valgrind.
6.3
Signal Handling Overhead
From Figure 14 in section 5.1.2, we learned that the overhead from signal handling is proportional to the number of non-stack write operations. It seems inevitable that not all programs write to stack at a higher rate than to heap or other areas. For instance, if the program uses a lot of global variable to record its states, then the modification to the global variables will generate heavy overhead.
6.3.1 Write Target Analysis
We do a little modification to Beagle2 to classify the write target ad-dresses while running a real program. There are three categories: stack, heap, and other. The ‘other’ section is when we write a value to areas like global data, library buffers, or other mapped areas. We run the modified version of Beagle2 to record the target classification result. The analysis chart is shown in Figure 21.
First we inspect the result of running WsMp3d Webserver introduced in section 5.2. Even though the heap writing percentage is only 4.22%, the other area’s writing percentage is 34.72%, and the two kinds of writing both trigger segmentation faults. Only stack writing will not cause a segmentation fault. Around 40% of non-stack writing will cause signal handler to be called more often. Recall in Figure 15, we can find the fact that 40% of non-stack writing’s performance is not too good.
Finally, we look at the analysis result when running a 10x10 matrix multiplication. Almost all of the write targets reference variables on stack. Thus the segmentation fault happens rarely. The larger the matrix is, the higher the percentage of stack writing is, and we can overlook the overhead generated from signal handling. This is the optimal situation in asynchronous checking by the DupWrite method.
6.3.2 Merged Checking
Another issue is that, programs usually write many bytes sequentially to buffers. Writing a 32 byte long string to a buffer will generate 8 segmenta-tion faults, assuming that the compiler or the library funcsegmenta-tion called divide
Figure 21: Write Target Analysis
the 32-byte write operation into 8 32-bit word write operations. Thus it is not efficient to check the sequential write operations. If we can predict the consecutive memory reference behavior and get the range out of it, then the checks can be merged together and the overhead can be reduced substantially. Merged checking is an optimization technique mentioned in LIFT by Qin et al. [31]. It scans through the whole program to perform memory reference analysis. By building a data dependency graph (DD Graph) and examine it, unnecessary checking to the same or consecutive reference area can be eliminated. For sure we can apply this technique to reduce the redundant checking, but then we cannot benefit from the clean and straightforward lower overhead instrumentation of our Trap Address Encoding and DupWrite method, because querying which write operations ought to be instrumented and which should not will be time consuming.
6.3.3 Hybrid Solution
A hybrid solution may exist to solve the problem. Currently the Dup-Write method instruments all memory write accesses no matter that the write operation is in user’s program, libc function or other external library’s func-tions. The hybrid method means that, we do not instrument the duplicated write in external library function functions including libc functions, and use a function wrapper to do the write range validation beforehand.
It is relatively easy for us to accomplish this method, and there is no demand to do an analysis on data dependency in advance. In the instru-mentor, we can look at the current instrumenting instruction. If the write instruction’s code address is not located in the program’s .text section, then we do not instrument it. This is the method we used for the no-library in-strumentation optimization back in Beagle. From Figure 2 in chapter 1, we can see the impact on performance from no-library instrumentation.
Without the instrumentation, any write operations happen in the exter-nal library will not generate a segmentation fault. The asynchronous mecha-nism thus is not deployed on external libraries, and we need active checking to make sure that the operation will not overwrite the protected targets. A possible way to achieve that is to use function wrappers to wrap critical and widely used library functions, for example, strcpy() and memset(), and do a bound checking to see whether the write region is overlapped with the protected targets or not, before the function is actually called. This method is very similar to Libsafe, proposed by Baratloo et al. [32], which also does bound checking before the function is executed.
Figure 22: Beagle2 No-Library Instrumentation Optimization
there are many library functions to be wrapped to do bound checking. Al-though we do not implement this method, we redo the throughput evaluation of WsMp3d in section 5.2.1, and this time without instrumenting the library functions to show the possible performance enhancement from the hybrid solution. The evaluation result is shown in Figure 22.
Beagle2’s original throughput is about 24.5 MB/s. After removing the library write instrumentation, the transmission rate is approximately twice faster, to 51.34 MB/s. Beagle-all is the throughput when running Beagle with instrumentation in library functions, so we can see that actually Beagle2 is only a bit slower than Beagle. The extra overhead between Beagle2 and Beagle comes from the segmentation faults generated from writing global variables in user program. The performance of Beagle2 will be slower if bound checking is implemented, but it will still be faster than entering signal handlers all the time.
Table 4: Trap Address Conflict Original Address Encoded Trap Address 0x08048a00 0xb8048a00 0x18048a00 0xb8048a00 0x48048a00 0xf8048a00 0x88048a00 0xb8048a00 0xb8048a00 0xb8048a00 0x0fbfed00 0xbfbfed00 0xbfbfed00 0xbfbfed00
it continuously after an amount of time, the throughput become lower and lower. By running memcheck provided by Valgrind, it reports that there are many memory leak spots in the webserver. Appendix 3 is the output record from memcheck to prove that the memory leakage problem in WsMp3d Webserver exists. Beagle spends more and more time on checking the unfreed garbage on the heap, which is the reason of the slowdown. On the other hand, the asynchronous method we use in Beagle2 does not suffer from memory leakage, because the garbage chunks will not be modified at all. This is another good aspect to support asynchronous checking.
6.4
Trap Address Conflict
Trap address encoding is not a one-to-one mapping operation. It “com-presses” a 32-bit address range into 28-bit range. Table 4 shows that dif-ferent addresses can be encoded into the same address. A typical address
0x08048a00 to the heap is redirected to 0xb8048a00. If the UAB ORing operation produces the same result, then the addresses will overlap, and we cannot derive the original reference address to perform target checking because there are many possible choices.
If the heap or stack grows too large, the conflict situation will happen. That is why Valgrind places its and the plug-in’s code and data section on
00400000-00402000 r-xp 00000000 fd:03 21749773 /root/test/a.out 00601000-00602000 r--p 00001000 fd:03 21749773 /root/test/a.out 00602000-00603000 rw-p 00002000 fd:03 21749773 /root/test/a.out 2b82a4a98000-2b82a4ab3000 r-xp 00000000 fd:03 50733174 /lib64/ld-2.6.1.so 2b82a4ab3000-2b82a4ab4000 rw-p 2b82a4ab3000 00:00 0 2b82a4ac0000-2b82a4ac1000 rw-p 2b82a4ac0000 00:00 0
2b82a4cb2000-2b82a4cb3000 r--p 0001a000 fd:03 50733174 /lib64/ld-2.6.1.so 2b82a4cb3000-2b82a4cb4000 rw-p 0001b000 fd:03 50733174 /lib64/ld-2.6.1.so 2b82a4cb4000-2b82a4dea000 r-xp 00000000 fd:03 50733061 /lib64/libc-2.6.1.so 2b82a4dea000-2b82a4fe9000 ---p 00136000 fd:03 50733061 /lib64/libc-2.6.1.so 2b82a4fe9000-2b82a4fed000 r--p 00135000 fd:03 50733061 /lib64/libc-2.6.1.so 2b82a4fed000-2b82a4fee000 rw-p 00139000 fd:03 50733061 /lib64/libc-2.6.1.so 2b82a4fee000-2b82a4ff4000 rw-p 2b82a4fee000 00:00 0 7fff05ffc000-7fff06012000 rw-p 7fff05ffc000 00:00 0 [stack] ffffffffff600000-ffffffffff601000 r-xp 00000000 00:00 0 [vdso]
Figure 23: 64-bit Example Memory Layout
the 0x6******* and 0x3******* region, to avoid overlapping with heap and stack when they grow. When running programs with Beagle2, the conflict situation will not happen only if the heap’s bottom is not over 0x0f000000, because 0x0f000000 OR 0xb0000000=0xbf000000 is probably mapped by the stack. Similarly, stack cannot grow too large (large buffer allocation / recursive calls) or it will bump into the trap area. Heap’s size cannot exceed approximate 100MB in our experiment environment, which may be insufficient for memory-consuming programs.
6.4.1 64-bit Environment Memory Layout
Although Valgrind supports the x86-64 architecture, Beagle2 currently runs on 32-bit x86 machines only. But there is no restriction that forbid us to port it to the 64-bit architecture. Figure 23 is a memory layout example from a x86-64 Gentoo Linux machine. The difference between Figure 23 (64-bit) and Figure 4 (32-bit) is that the dynamic libraries are placed after the heap section in the 64-bit memory layout. And due to larger addressing space, memory mapping becomes very sparse.
6.4.2 Common Factor of the Most Significant Bytes
How can we benefit from the sparse memory in the 64-bit environment? Apparently the large gap below the heap section will allow the heap to grow larger without the trap address conflict problem, so we can run some large and memory-consuming programs. And because the dynamic loaded libraries are now placed much more close to the stack, we can AN D the stack and the library section’s most significant common byte together. The AN D result will be the UAB we use in the trap address encoding process. Addresses pointed to the dynamic library and the stack OR with the UAB will remain the same, which means that they will not write to trap pages.
6.4.3 Write to Library Page Fault Elimination
In current version of 32-bit Beagle2, write to the locations in the dy-namic libraries will cause segmentation faults. That is because the libraries are located at lower memory part, and we cannot find a common UAB from the stack and the library section. In Figure 21, which we have analyzed in section 6.3.1, the ‘other’ part of running WsMp3d Webserver is around 36%. A few of the write operations access the global data before the heap and most of them write to the buffers in libraries. If we can use the technique men-tioned above in the 64-bit environment, then we can eliminate the redundant segmentation faults from writing the library section, which accounts for most of the overhead.
7
Conclusion
We propose a simple and novel method to redirect non-stack memory reference to trap areas to achieve asynchronous memory modification veri-fication. The overhead of our reference redirection is relatively lower than other mechanisms, which must perform a table look-up. The overall perfor-mance enhancement is remarkable when objects on stack region are accessed more often than other area. To reduce the signal handling overhand when accessing non-stack area, a hybrid solution exists which can do active bound checking with external library functions and bypass the redundant segmen-tation faults. In addition, with asynchronous checking, memory leakage of dynamic allocated chunks will not slow the whole process down. This proves that the control interception detection tool with our optimization applied is suitable for online detection, fuzz testing, or being configured as a monitor to filter successful penetration exploit data.
Bibliography
[1] N. Nethercote and J. Seward. Valgrind: A framework for heavyweight dynamic binary instrumentation. In Proceedings of the 2007 PLDI con-ference, volume 42, pages 89–100. ACM New York, NY, USA, 2007.
[2] C.H. Tsai and S.K. Huang. Detection and Diagnosis of Control Inter-ception. Lecture Notes in Computer Sciencs, 4861:412, 2007.
[3] C. Cowan, P. Wagle, C. Pu, S. Beattie, and J. Walpole. Buffer overflows: Attacks and defenses for the vulnerability of the decade. Foundations of Intrusion Tolerant Systems, 2003 [Organically Assured and Survivable Information Systems], pages 227–237, 2003.
[4] A. One. Smashing the stack for fun and profit. Phrack magazine, 49(7), 1996.
[5] D. Lea and W. Gloger. dlmalloc: A memory allocator, 2000.
[6] S. Chen, J. Xu, E.C. Sezer, P. Gauriar, and R.K. Iyer. Non-control-data attacks are realistic threats. USENIX Security Symposium, 2005.
[7] C.H. Tsai and S.K. Huang. Testing Heap Overflow Bugs Caused by Integer Overflows. 2006 ICS Conference, 2006.
[9] J. Ferguson. Understanding the Heap by Break-ing It. https://www.blackhat.com/presentations/bh-usa-07/Ferguson/Whitepaper/bh-usa-07-ferguson-WP.pdf, 2007.
[10] J. Levon and P. Elie. Oprofile: A system profiler for linux. http://oprofile.sourceforge.net, 2005.
[11] GNU. GNU’s GDB Debugger. http://www.gnu.org/software/gdb/.
[12] B. Beander. VAX DEBUG: An interactive, symbolic, multilingual de-bugger. ACM SIGSOFT Software Engineering Notes, 1983.
[13] R. Wahbe, S. Lucco, and S.L. Graham. Practical data breakpoints: Design and implementation. ACM SIGPLAN Notices, 28(6):1–12, 1993.
[14] G.W. Thelen. Debugging using virtual watchpoints, June 28 2005. US Patent App. 11/169,235.
[15] C.P. Chen, J.V. Olivier, J.P. Hoeflinger, and B.R. Brett. Manage-ment of watchpoints in debuggers, September 30 2005. US Patent App. 11/241,606.
[16] Q. Zhao, R. Rabbah, S. Amarasinghe, L. Rudolph, and W.F. Wong. How to do a million watchpoints: Efficient Debugging using Dynamic Instrumentation. Lecture Notes in Computer Science, 4959:147, 2008.
[17] C. Cowan, C. Pu, D. Maier, H. Hinton, J. Walpole, P. Bakke, S. Beattie, A. Grier, P. Wagle, and Q. Zhang. StackGuard: Automatic adaptive detection and prevention of buffer-overflow attacks. In Proceedings of the 7th USENIX Security Conference, volume 78. San Antonio: USENIX Press, 1998.