ACCEPTED MANUSCRIPT • OPEN ACCESS
Global greenness in relation to reducing the burden of cardiovascular
diseases: ischemic heart disease and stroke
To cite this article before publication: Aji Kusumaning Asri et al 2020 Environ. Res. Lett. in press https://doi.org/10.1088/1748-9326/abbbaf Manuscript version: Accepted Manuscript
Accepted Manuscript is “the version of the article accepted for publication including all changes made as a result of the peer review process, and which may also include the addition to the article by IOP Publishing of a header, an article ID, a cover sheet and/or an ‘Accepted Manuscript’ watermark, but excluding any other editing, typesetting or other changes made by IOP Publishing and/or its licensors” This Accepted Manuscript is © 2020 The Author(s). Published by IOP Publishing Ltd.
As the Version of Record of this article is going to be / has been published on a gold open access basis under a CC BY 3.0 licence, this Accepted Manuscript is available for reuse under a CC BY 3.0 licence immediately.
Everyone is permitted to use all or part of the original content in this article, provided that they adhere to all the terms of the licence https://creativecommons.org/licences/by/3.0
Although reasonable endeavours have been taken to obtain all necessary permissions from third parties to include their copyrighted content within this article, their full citation and copyright line may not be present in this Accepted Manuscript version. Before using any content from this article, please refer to the Version of Record on IOPscience once published for full citation and copyright details, as permissions may be required. All third party content is fully copyright protected and is not published on a gold open access basis under a CC BY licence, unless that is specifically stated in the figure caption in the Version of Record.
View the article online for updates and enhancements.
1
Global Greenness in Relation to Reducing the Burden of Cardiovascular Diseases:
1
Ischemic Heart Disease and Stroke
2
Aji Kusumaning Asri 1, Chia-Pin Yu2,3, Wen-Chi Pan4, Yue Leon Guo5,6, Huey-Jen Su7, Shih-Chun Candice
3
Lung 8,9,10, Chih-Da Wu1,6, *, John D. Spengler3
4
1 Department of Geomatics, National Cheng Kung University, Tainan 70101, Taiwan;
5
[email protected] and [email protected] (A.K.A., and C.-D.W.)
6
2 School of Forestry and Resource Conservation, National Taiwan University, Taipei, 10617, Taiwan;
7
[email protected] (C.-P.Y.)
8
3 Department of Environmental Health, Harvard T.H. Chan School of Public Health, Boston, 02115, USA;
9
[email protected] and [email protected] (C.-P.Y., and J.D.S.)
10
4 Institute of Environmental and Occupational Health Sciences, National Yang Ming University, Taipei, 11221,
11
Taiwan; [email protected] (W.-C.P.)
12
5 Department of Environmental and Occupational Medicine, National Taiwan University (NTU) and NTU
13
Hospital, Taipei, 10055, Taiwan; [email protected] (Y. L.G.)
14
6 National Institute of Environmental Health Sciences, National Health Research Institutes, Miaoli 350, Taiwan;
15
[email protected] and [email protected] (C.-D.W., and Y. L.G.)
16
7 Department of Environmental and Occupational Health, National Cheng Kung University, Tainan 70101,
17
Taiwan; [email protected] (H.-J.S.)
18
8 Research Center for Environmental Changes, Academia Sinica, Taipei, 11529, Taiwan;
19
[email protected] (S.-C.-C.L)
20
9 Department of Atmospheric Sciences, National Taiwan University, Taipei, 10617, Taiwan;
21
[email protected] (S.-C.-C.L)
22
10 Institute of Environmental Health, School of Public Health, National Taiwan University, Taipei, 10055,
23
Taiwan; [email protected] (S.-C.-C.L)
24
* Correspondence: [email protected] (C.-D.W.); Telephone: +886-6-275-7575 (ext. 63841); Fax:
25 +886-6-237-5764. 26 3 4 5 6 7 8 9 10 11 12 13 14 15 16 17 18 19 20 21 22 23 24 25 26 27 28 29 30 31 32 33 34 35 36 37 38 39 40 41 42 43 44 45 46 47 48 49 50 51 52 53 54 55 56 57 58 59 60
Accepted Manuscript
2
Abstract This ecological study aimed to identify the association between greenness and
1
cardiovascular diseases in terms of ischemic heart disease (IHD) and stroke in 183 countries
2
worldwide. The country-level disability-adjusted life year (DALY) database provided by the
3
WHO was used to represent the health burden due to IHD and stroke for the study countries.
4
Normalized Difference Vegetation Index (NDVI - MOD13A3) was assessed to estimate the
5
greenness in each country. After considering potential covariates, the generalized linear mixed
6
model penalized quasi-likelihood (GLMMPQL) coupled with a sensitivity test was applied to
7
identify the greenness in relation to DALY loss due to IHD and stroke. Stratified analysis was
8
then conducted to determine the effects of greenness among the different levels of gender, age,
9
and economic status. A consistently significant negative association was found between
10
greenness and both IHD and stroke; the NDVI coefficients of the main model were -11.245
11
(95% CI: -16.770, -5.720) and -4.387 (95% CI: -7.926, -0.085), respectively, in the DALY
12
changes based on the increase of NDVI from 0 to 1. The stratified analysis recognized these
13
effects in both females and males. Negative associations between greenness and IHD as well
14
as stroke were also found in various age groups and were confirmed as significant in low and
15
middle-income countries.
16 17
Keywords: cardiovascular diseases, greenness, ischemic heart disease (IHD), normalized
18
difference vegetation index (NDVI), stroke.
19 3 4 5 6 7 8 9 10 11 12 13 14 15 16 17 18 19 20 21 22 23 24 25 26 27 28 29 30 31 32 33 34 35 36 37 38 39 40 41 42 43 44 45 46 47 48 49 50 51 52 53 54 55 56 57 58 59 60
Accepted Manuscript
3
1. Introduction
1
Cardiovascular disease is the most common health burden worldwide. The Global Burden of
2
Disease study from 2016 states that ischemic heart disease (IHD) and stroke are two types of
3
cardiovascular diseases, and cardiovascular diseases overall is categorized as the leading cause
4
of death in the human population (GBD 2017 Causes of Death Collaborators, 2018; WHO,
5
2019). Represented by disability-adjusted life years (DALY), the total global health burden
6
due to IHD is around 2,567 years and 2,004 years for strokes per 100,000 people. IHD has an
7
influential impact on the health of a population because of its acute manifestation and acute
8
coronary syndrome (Dégano, Elosua and Marrugat, 2013), and how it is followed by health
9
burden due to stroke, which is often associated with socio-economic conditions (GBD 2016
10
Neurology Collaborators, 2019). National and international inequalities in income, education
11
and wealth, socioeconomic status, and health behavior (alcohol consumption and smoking)
12
have been focused on as the important determinants of cardiovascular diseases (Schultz et al.,
13
2018).
14
Numerous studies exist related to researching cardiovascular diseases, including etiology
15
and risk factors. One of those factors is how natural exposures such as greenness can reduce
16
the risk of IHD and stroke (Maas et al., 2009; Pereira et al., 2012; Wilker et al., 2014; Shen and
17
Lung, 2016; Wang et al., 2019). Several potential mechanisms were proposed in the previous
18
studies related to the beneficial effects of greenness exposure on cardiovascular diseases
19
(Brook, et al., 2010; Basner et al., 2014; Dzhambov, 2015; Kim et al., 2019; Richardson et al.,
20
2013; Mitchell and Popham, 2008). These mechanisms described how exposure to greenness
21
offers opportunities to reduce risk factors that can increase the burden of cardiovascular
22
diseases. For example, the increase of green space could reduce air pollution concentrations in
23
either short-term or long-term exposures by influencing dispersion and removal (Brook, et al.,
24
2010). Greenness exposure was also negatively associated with noise pollutants and traffic that
25
increase the risk of cardiovascular diseases, metabolic disorders, cognitive disorders, and
26
mental health (Basner et al., 2014; Dzhambov, 2015). A study conducted in Korea also
27
confirmed that greenness can reduce the impact of ambient air particles, which is important
28
since ambient air particles can increase the risk of death due to cardiovascular diseases (Kim
29
et al., 2019). Considering lifestyle aspects, prior study reported that living in an area close to a
30
green space allowed people to do physical activities, therefore improving physical health
31
(Richardson et al., 2013). In addition, knowing the potential for stress reduction, people who
32
lived in areas with green exposure could be at lower risk for heart disease compared to those
33
who resided in the area without green spaces (Mitchell and Popham, 2008).
34
Previous studies have discussed the relationship between greenness exposure and
35
cardiovascular diseases in terms of IHD as well as stroke. However, most of them focused on
36
local-scale analysis and only a very limited number of studies have identified how greenness
37
could affect health burdens globally. A global-scale study could provide stronger scientific
38
evidence to explain the association, therefore, we conducted an ecological study that involved
39
including 183 countries from six regions, including Africa, America, Eastern Mediterranean,
40 3 4 5 6 7 8 9 10 11 12 13 14 15 16 17 18 19 20 21 22 23 24 25 26 27 28 29 30 31 32 33 34 35 36 37 38 39 40 41 42 43 44 45 46 47 48 49 50 51 52 53 54 55 56 57 58 59 60
Accepted Manuscript
4
Europe, Southeast Asia, and Western Pacific. Considering that exposure to greenness has
1
advantages on human health, this study aimed to investigate the association between global
2
greenness and cardiovascular diseases across countries. Specifically, we assumed greenness
3
would be linked to a lower burden of cardiovascular diseases in terms of IHD and stroke. By
4
applying the statistical approaches of generalized linear mixed model penalized
quasi-5
likelihood (GLMMPQL) and stratified analysis, we attempt to identify how greenness exposure
6
could reduce health burdens due to IHD and stroke with DALY as a measurement for disease
7
burden. Although this global analysis involved population-based proxies and had a lack of
8
individual data, in concept, it could serve as a global research baseline for environmental
9
development that supported human health and well-being.
10
2. Materials and Methods
11
2.1. The burden of cardiovascular diseases
12
Health data were collected from the Global Burden of Disease (GBD) study database
13
provided by the World Health Organization (WHO-Disease burden and mortality estimates,
14
2019). In this study, the raw estimations of disability-adjusted life years (DALY) were used to
15
represent the health burden due to cardiovascular diseases. Four periods of global health data
16
were available for each country, including annual estimation data in 2000, 2010, 2015, and
17
2016 (www.who.int/healthinfo/global_burden_disease/estimates/en/index1.html). DALY is a
18
summary metric of population health that includes two components: years of life lost due to
19
premature mortality (YLL) and years lived with disability (YLD). DALY contains an absolute
20
measure of health loss; it counts how many years of healthy life are lost due to death and
non-21
fatal illness or impairment (Murray et al., 2012). DALY measures the entire population and is
22
also provided by gender (male and female) and for seven age groups (age 0-4, age 5-14, age
23
15-29, age 30-49, age 50-59, age 60-69, and age >70 years). The DALY estimations used in
24
this study represent data for entire populations on a country-level and are provided for four
25
years (2000, 2010, 2015, 2016). Therefore, in the statistical calculations, we used a ratio to
26
represent DALY for each country. In this ecological study, we focused on the analysis of
27
cardiovascular diseases including ischemic heart disease (ICD-10, I20-I25), also referred to as
28
IHD, and stroke (ICD-10, I60-I69) for non-communicable diseases. In a total, 183 WHO
29
member countries with supportive health burden and demographic information were included
30
as the study countries (table S1 and figure S1). IHD and stroke were selected for our analysis
31
because these two cardiovascular diseases are the two leading causes of death due to
non-32
communicable diseases worldwide (GBD 2016 Neurology Collaborators, 2019). Spatial
33
distribution of DALY loss due to IHD and stroke for each country is shown in figure S2 and
34
figure S3, respectively.
35
2.2. Greenness assessment
36
We used the Normalized Difference Vegetation Index (NDVI) data obtained from the Terra
37
Moderate Resolution Imaging Spectroradiometer (MODIS) sensor to assess greenness
38
exposure globally (NASA, 2018). These data include a satellite-image-based vegetation index
39 3 4 5 6 7 8 9 10 11 12 13 14 15 16 17 18 19 20 21 22 23 24 25 26 27 28 29 30 31 32 33 34 35 36 37 38 39 40 41 42 43 44 45 46 47 48 49 50 51 52 53 54 55 56 57 58 59 60
Accepted Manuscript
5
provided by the National Aeronautics and Space Administration (NASA) for measuring and
1
monitoring plant growth, vegetation, and biomass production, as well as representing
2
components of greenness including leaf area, chlorophyll, and canopy structure (Gascon, et al.,
3
2016b). The MODIS NDVI product used in this study was MOD13A3 version 6. This
satellite-4
based greenness database provided monthly greenness measurement at a 1x1 km spatial
5
resolution (Chen et al., 2006; Song et al., 2019). The relative algorithm of NDVI produces a
6
range of values from -1.0 to +1.0 for a given pixel. Positive values indicate more green
7
vegetation and negative values indicate a lack of vegetation (Wu et al., 2017). MODIS provided
8
two NDVI measures for each cell in each month. In our study, images with the acquisition date
9
closer to the mid-season were collected from January, April, July, and October; the selection
10
of the months in data collection has taken into the consideration for countries with two seasons
11
and/or four seasons. In addition, 292 MODIS NDVI images were used to assess the greenness
12
in the global area (covering 183 countries). For images integration, we generated a monthly
13
global greenness map by combining 292 images and estimating the greenness exposure for
14
each country accordingly. We then conducted the same processes to estimate the greenness
15
level in the four selected months. Finally, monthly NDVI values were then aggregated to obtain
16
the annual average greenness values for each country. The process resulted a total of 4672
17
images (292 images * 4 months * 4 years = 4672) used for 2000, 2010, 2015, and 2016, the
18
four follow-up years. Since recent studies have indicated that the proximity to water can
19
improve physical and mental health (Wheeler et al., 2012), grids with negative values of NDVI
20
were excluded to avoid the misclassification bias due to the effects of water. Figure 1 shows
21
the spatial distribution of global greenness based on the NDVI measurements.
22
2.3. Covariates
23
Several country-level covariates database associated with IHD or stroke were employed and
24
controlled for model adjustment in this ecological study, including:
25
2.3.1. Fine particulate matter (PM2.5)
26
Previous studies stated that air pollutants such as PM2.5 was associated with cardiovascular
27
diseases (Balluz et al., 2007; Hayes et al., 2019). Global PM2.5 concentration measurements at
28
1 km x 1 km resolution were obtained from the website of the Atmosphere Composition
29
Analysis Group established by Prof. Randall Martin from Dalhousie University. A daily total
30
column of aerosol optical depth retrievals from satellites was coupled with the GEOS-Chem
31
transport model and geographically weighted regression model to estimate PM2.5 concentration
32
variations globally (van Donkelaar et al., 2016). Country-level PM2.5 concentration levels were
33
calculated for the four study years and applied for model adjustment.
34
2.3.2. Demographic factors
35
Demographic factors have long been very important variables in studies related to the
36
environment and health (Sitzia and Wood, 1997; Degl’Innocenti et al., 2005). In line with
37
DALY data, we used country-level demographic data provided by the United Nations in 2000,
38 3 4 5 6 7 8 9 10 11 12 13 14 15 16 17 18 19 20 21 22 23 24 25 26 27 28 29 30 31 32 33 34 35 36 37 38 39 40 41 42 43 44 45 46 47 48 49 50 51 52 53 54 55 56 57 58 59 60
Accepted Manuscript
6
Figure 1. Spatial distribution of greenness by four quartile limits (Q1 to Q4) 3 4 5 6 7 8 9 10 11 12 13 14 15 16 17 18 19 20 21 22 23 24 25 26 27 28 29 30 31 32 33 34 35 36 37 38 39 40 41 42 43 44 45 46 47 48 49 50 51 52 53 54 55 56 57 58 59 60
Accepted Manuscript
7
2010, 2015, and 2016 (United Nations, 2019) for model adjustment. In addition to be serving
1
as covariates, this data was also applied to calculate the DALY due to IHD and stroke.
2
2.3.3. Economic level
3
Some studies have noted that economic status affected health burden worldwide, including the
4
burden of cardiovascular diseases (GBD 2016 Neurology Collaborators, 2019). In this study,
5
we used the country-level economic database established in the GBD 2000-2016 study by
6
World Bank Group. We used the economic levels of each country based on the 2016 Atlas
7
gross national income per capita (World Bank Group, 2019) for model adjustment. In our study,
8
economic status was classified into three levels, including low-income, middle-income, and
9
high-income levels.
10
2.3.4. Education
11
Krieger’s study pointed that education could impact how a person adapts to chronic diseases
12
such as IHD and stroke (Krieger, Williams and Moss, 1997). Country-level education data
13
provided by the World Bank group was used to identify the prevalence rate of education (%)
14
from 2000 to 2016.
15
2.3.5. Behavior
16
Behaviors such as alcohol consumption and smoking are important risk factors to
17
cardiovascular diseases (Barry et al., 1989; Kawano, 2010; Roerecke and Rehm, 2014). In early
18
2020, the WHO reported that smoking was estimated to cause about 10% of cardiovascular
19
diseases worldwide (WHO, 2019). We used alcohol consumption and prevalence of smoking
20
data obtained from the World Bank in 2000, 2010, 2015, and 2016 for model adjustment.
21
2.3.6. Healthcare expenditure
22
Prior study figured out that healthcare status has association with cardiovascular disease risk
23
factors (Brooks, et al., 2010). Total health expenditure including the provision of health
24
services (preventive and curative), family planning activities, nutrition activities, and
25
emergency aid designated for health provided by World Bank Group were taken into account
26
in our adjustment.
27
2.3.7. Risk factors
28
Risk factors affected the burden of cardiovascular diseases included obesity-related to BMI or
29
body mass index (Khan et al., 2018; Carbone et al., 2019), cholesterol (Peters et al., 2016), and
30
higher blood pressure (Kokubo and Iwashima, 2015; Satoh et al., 2019). In this study, the
31
prevalence rate of obesity attributed to high BMI (> 30) were obtained from the World Bank
32
for the four study periods. We also used the country-scale data of mean total cholesterol and
33
mean systolic blood pressure (age-standardized estimate) provided by the WHO-Global Health
34
Observatory to adjust the developed models.
35 2.4. Statistical analysis 36 3 4 5 6 7 8 9 10 11 12 13 14 15 16 17 18 19 20 21 22 23 24 25 26 27 28 29 30 31 32 33 34 35 36 37 38 39 40 41 42 43 44 45 46 47 48 49 50 51 52 53 54 55 56 57 58 59 60
Accepted Manuscript
8
Statistical summaries were performed to describe the data characteristics of all variables used
1
including DALY (represent the health burden due to IHD and stroke), environmental exposures
2
(greenness-NDVI and PM2.5), demographic factors (population size, gender, and age),
social-3
economic status (level of income and the prevalence rate of education), health behaviors
4
(alcohol consumption and the prevalence rate of smoking), risk factors (obesity, cholesterol,
5
and blood pressure), and healthcare expenditure.
6
Having considered all covariates, the main model was developed using the GLMMPQL to
7
identify the association between greenness exposure and the burden of IHD and stroke.
8
Considering fixed effects and random effects in the calculations, GLMMPQL provides a more
9
flexible approach for analyzing health outcomes and has been used in many fields of studies
10
(Leroux, Lei and Breslow, 2000; Casals, Girabent-Farrés and Carrasco, 2014; Leung et al.,
11
2019). In conditions where spatial data are available from several distinct areas, GLMMPQL
12
can adjust the overall fixed effects while the structure of correlation is nested within regions,
13
allowing the accommodation of regional differences in e.g. autocorrelation distances, and
14
assuming spatial autocorrelation only between observations in the same region (Dormann, et
15
al., 2007). Given a high number for DALY loss due to IHD and stroke in some countries
16
(clustered spatial patterns), we added an additional term of “continent” in the GLMMPQL
17
calculation based on Leung et al., (2019) to minimize the biases due to spatial autocorrelation
18
effect. Then, a Spatial Autocorrelation Global Moran's I was calculated to see whether a spatial
19
autocorrelation (SAC) could be found for the residual estimations (Leung, et al., 2019).
20
Moreover, GVIFs (generalized variance-inflation factors) were applied to examine the
21
multicollinearity across covariates. The obtained GVIFs values were < 4 for all covariate
22
variables, thus, all variables were remained for the model adjustment (table S2) (Fox, 2015;
23
Helbich, et al., 2018).
24
Several types of sensitive test were conducted to evaluate the robustness of the model
25
estimates. The first type of sensitivity test was designed to gradually include one covariate at a
26
time. This test aimed to determine whether the significant effect of greenness on IHD and stroke
27
remained stable even some covariates were not considered. We used different combination of
28
covariates in six separated models while population size, age, gender, and year were always
29
remained for model adjustment. More specifically, Model 1 included only greenness exposure;
30
Model 2 included greenness and PM2.5; Model 3 added economic status in addition to greenness
31
and PM2.5. Model 4 additionally included alcohol consumption based on Model 3; Model 5
32
additionally included smoking prevalence and education based on Model 4; and in Model 6 we
33
further considered the risk factors including obesity attributed to BMI, cholesterol, and systolic
34
blood pressure. In addition, taking into account some uncountable confounding factors (i.e.
35
historical and current political regime), Model 7 excluded data of countries in Eastern Europe
36
and Central Asia as the second type of sensitivity test. In the third approach, quartiles of
37
greenness exposure were selected as a sensitivity test to evaluate potential nonlinearity and to
38
minimize the influence of outliers in the NDVI.
39
Since the previous studies confirmed an association between obesity and cardiovascular
40
diseases (Carbone, et al., 2019) also an inverse association between obesity and greenness
41 3 4 5 6 7 8 9 10 11 12 13 14 15 16 17 18 19 20 21 22 23 24 25 26 27 28 29 30 31 32 33 34 35 36 37 38 39 40 41 42 43 44 45 46 47 48 49 50 51 52 53 54 55 56 57 58 59 60
Accepted Manuscript
9
exposure (Huang, et al., 2020), then we performed the additional causal mediation analysis
1
using obesity. Furthermore, the selection of obesity for mediation analysis is based on the
2
results of the bivariate test Spearman correlation which shows a significant negative association
3
between greenness and obesity and significant positive between DALY (both IHD and stroke)
4
with obesity (p-value <0.01). In this study, the mediator models were adjusted for gender (%
5
of females), age, economic status (level of income), the prevalence rate of smoking, alcohol
6
consumption, the prevalence rate of education, and PM2.5 exposures. Outcome models were
7
adjusted for NDVI, gender, age, economic status, smoking, alcohol consumption, education,
8
PM2.5 exposures, cholesterol, and systolic blood pressure. The magnitude of natural indirect
9
effect (NIE) was estimated based on one-unit increments on NDVI, and a 1000-bootstrap
10
resampling was applied to construct the 95% confidence intervals.
11
Finally, stratified analysis was conducted to assess the association between greenness in
12
relation to reducing the burden of IHD and stroke among different genders, age groups, and
13
economic statuses.
14
2.5. Positive-negative control tests
15
Positive-negative control variables were used to check the strength of a causal inference of an
16
exposure-outcome association when unobserved variables were thought to be present. Two
17
approaches were used in this study, including a positive-negative outcomes control and a
18
positive-negative exposures control. Outcomes of positive-negative controls aimed to identify
19
whether using the same exposure (greenness) and replacing risk variables (IHD and stroke)
20
with other health outcomes could yield consistent results. By using the same database
(DALY-21
WHO), we examined the association between greenness and the burden of disease due to falls
22
(representing the positive outcome control) and road injuries (representing the negative
23
outcome control). Falls were chosen as a positive outcome control because Lee's study showed
24
that greenness reduced the risk of fall-related injuries (Lee and Maheswaran, 2011). Road
25
injury was chosen as a negative outcome control since no studies focused on these two issues.
26
In contrast, in the positive-negative exposure control analysis, we identified whether using the
27
same risk variable (e.g. IHD) and replacing exposure could yield a consistent finding. For the
28
positive exposure control, we assessed the relationship between PM2.5 exposure and risk of
29
IHD. A previous study found that PM2.5 was highly correlated with an increased risk of IHD
30
(Hayes et al., 2019). Wind speed was used for the negative exposure control with the
31
assumption that no association between wind speed and IHD.
32
All the spatial and statistical analyses were performed using ArcGIS 10.5 and R version
33
3.3.2 (The R packages Foundation for Statistical Computing, Vienna, Austria). Coefficient and
34
risk estimate with 95% confidence intervals were reported and p-values <0.05 were considered
35 as statistical significance. 36 3 4 5 6 7 8 9 10 11 12 13 14 15 16 17 18 19 20 21 22 23 24 25 26 27 28 29 30 31 32 33 34 35 36 37 38 39 40 41 42 43 44 45 46 47 48 49 50 51 52 53 54 55 56 57 58 59 60
Accepted Manuscript
10
3. Results
1
3.1. Summary statistics
2
By using the country-level DALY data obtained from 183 countries worldwide, table 1 shows
3
the statistical summary of all variables used in this study. From the four periods analysis we
4
could know, the average global health burden due to IHD and stroke for the study countries
5
were 27.28 years (Std. Dev.: 19.88 years) and 16.20 years (Std. Dev.: 10.04 years),
6
respectively. As displayed in figure S4 (a) and (b), countries in Europe had the highest disease
7
burden for IHD and stroke. As for the environmental exposures, the average values of NDVI
8
and PM2.5 was 0.49 (Std. Dev.: 0.21) and 19.45 µg/m3 (Std. Dev.: 16.10 µg/m3), respectively;
9
The results of demographic statistics showed that the average population size of the selected
10
countries was around 38 million people (Mean ± Std. Dev.: 37,992,370 ± 139,909,540 people);
11
In terms of gender and age, 49.95% of the study population was female. The female population
12
is almost equal in the number to the male population; Age from 15-29 and 30-49 had the highest
13
proportion, with each group accounting for approximately 25% of the total population; In
14
addition, analysis of socioeconomic status showed the prevalence rate of education reached
15
83.70% (Std. Dev.: 19.68%). For economic status, income levels are classified into level 1
16
(covers 80 countries), level 2 (covers 52 countries), and level 3 (covers 51 countries) for
17
representing the low to high income levels; As for the behavior, the average alcohol
18
consumption was 3.26 liters per person (Std. Dev.: 3.61) and the prevalence rate of smoking
19
was 18.6% (Std. Dev.: 13.79%). Furthermore, the average proportion for healthcare
20
expenditure was 6.22% (Std. Dev.: 2.39%). Finally, the average numbers of risk factors were
21
9.64%, 4.71, and 125.53 mmHg for the prevalence of obesity attributed to BMI, total
22
cholesterol, and systolic blood pressure, respectively.
23 3 4 5 6 7 8 9 10 11 12 13 14 15 16 17 18 19 20 21 22 23 24 25 26 27 28 29 30 31 32 33 34 35 36 37 38 39 40 41 42 43 44 45 46 47 48 49 50 51 52 53 54 55 56 57 58 59 60
Accepted Manuscript
11
Table 1. Statistical summary of the variables
1
Variable Mean Std. Dev. Min 25th Median 75th Max
Burden of cardiovascular diseases - DALY DALY loss due to Ischemic heart
disease (years) 27.28 19.88 3.92 14.84 21.44 31.01 128.69
DALY loss due to Stroke (years) 16.20 10.04 2.88 9.84 13.59 18.47 57.13
Environmental exposures
Greenness (NDVI) 0.49 0.21 0.08 0.34 0.54 0.65 0.87
PM2.5 (µg/m3) 19.45 16.10 0.46 7.34 15.02 27.45 87.53
Demographic and socioeconomic factors
Population ('000) 37 992.37 13 9909.54 81.00 2 418.75 8 723.50 26 165.25 1 411 415.00 Gender (female %) 49.95 3.05 24.17 49.77 50.32 50.92 54.21 Age 0-4 (%) 10.55 4.48 4.03 6.37 9.94 14.59 20.99 Age 5 - 14 (%) 19.17 6.42 8.04 13.22 19.05 25.53 31.28 Age 15 - 29 (%) 25.38 4.13 14.52 22.30 26.66 28.17 36.76 Age 30 - 49 (%) 25.30 5.26 15.77 21.07 25.94 28.70 52.04 Age 50 - 59 (%) 8.62 3.58 2.88 5.30 7.85 12.01 16.08 Age 60 - 69 (%) 5.89 3.29 1.14 3.16 4.62 8.59 14.30 Age > 70 (%) 5.10 3.97 0.39 1.95 3.28 7.75 19.08
Alcohol consumption (liter/population) 3.26 3.61 0.00 0.21 2.00 4.82 16.64
Smoking (%) 18.60 13.79 0.00 6.70 19.10 28.30 73.40 Healthcare expenditure (%) 6.22 2.39 0.00 4.62 6.01 7.84 15.88 Education (%) 83.70 19.68 0.00 72.60 92.80 98.80 100.00 3 4 5 6 7 8 9 10 11 12 13 14 15 16 17 18 19 20 21 22 23 24 25 26 27 28 29 30 31 32 33 34 35 36 37 38 39 40 41 42 43 44 45 46 47 48 49 50 51 52 53 54 55 56 57 58 59 60
Accepted Manuscript
12
Variable Mean Std. Dev. Min 25th Median 75th Max
Income level Number
(countries) %
Low- income 80 43.71 - - - - -
Middle-income 52 28.42 - - - - -
High - income 51 27.87 - - - - -
Risk factors
Prevalence of obesity attributed to BMI
(Body Mass Index) 9.64 5.38 1.15 4.91 9.92 13.88 28.19
Mean total cholesterol 4.71 0.41 3.90 4.40 4.70 5.05 5.60
Mean systolic blood pressure (mmHg) 126.53 3.39 116.61 124.39 126.65 129.23 134.49
1 3 4 5 6 7 8 9 10 11 12 13 14 15 16 17 18 19 20 21 22 23 24 25 26 27 28 29 30 31 32 33 34 35 36 37 38 39 40 41 42 43 44 45 46 47 48 49 50 51 52 53 54 55 56 57 58 59 60
Accepted Manuscript
13
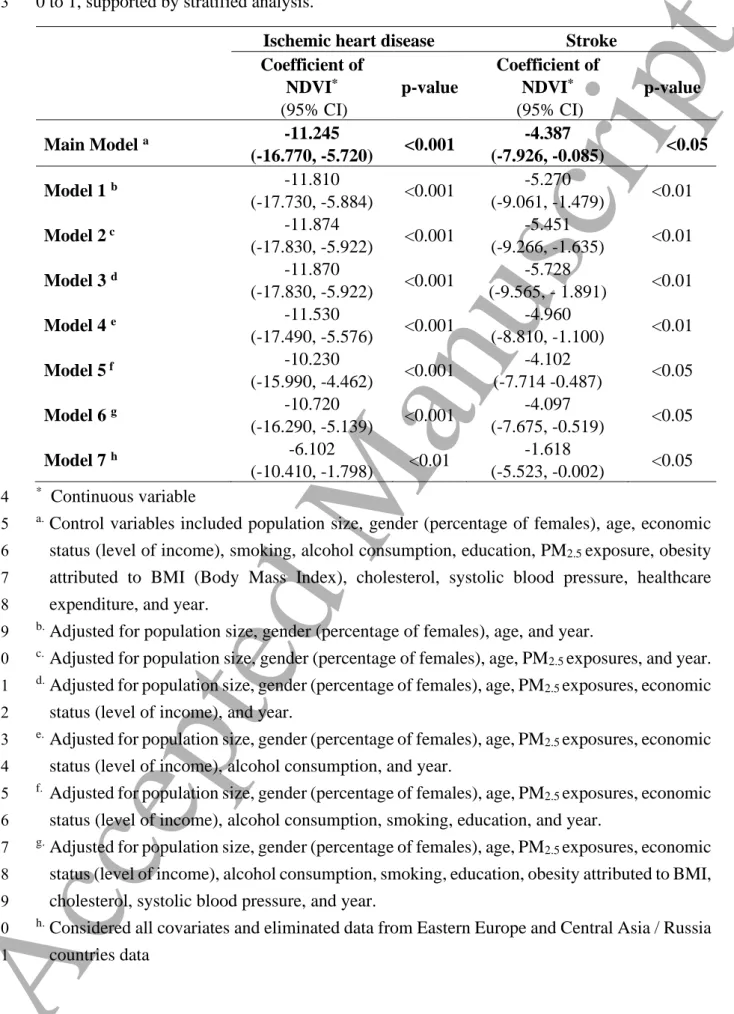
3.2. Association between greenness and cardiovascular diseases
1
The results of the statistical analysis related to the association between greenness and
2
cardiovascular diseases in terms of IHD and stroke are shown in table 2. After adjusting the
3
covariates (population, gender, age, economic status, the prevalence of education, alcohol
4
consumption, smoking, PM2.5, healthcare expenditure, and year), the main model in this study
5
showed a significantly negative association between greenness and IHD and stroke, with
6
coefficient estimates of -11.245 (95% CI: -16.770, -5.720; p-value: <0.001) and -4.387 (95%
7
CI: -7.926, -0.085; p-value: <0.05), respectively. These findings indicate greenness exposure
8
could significantly reduce health burden due to IHD and stroke. From the six sensitivity test
9
models developed (Model 1 to 6), a consistently significant negative association between
10
greenness and IHD and stroke was observed with different covariates settings for the model
11
adjustments. Furthermore, by excluding several countries in Eastern Europe and Central Asia,
12
Model 7 still found a significantly negative association between greenness and cardiovascular
13
diseases for both IHD and stroke, with the coefficient estimates of 6.102 (95% CI: 10.410,
-14
1.798; p-value: <0.01) and -1.618 (95% CI: -5.523, -0.002; p-value: <0.05), respectively. We
15
also assessed the spatial-autocorrelation effects in the model. As shown in table S3, no
16
statistically significant clustering effects (p-value> 0.05) was found in the residual estimations.
17
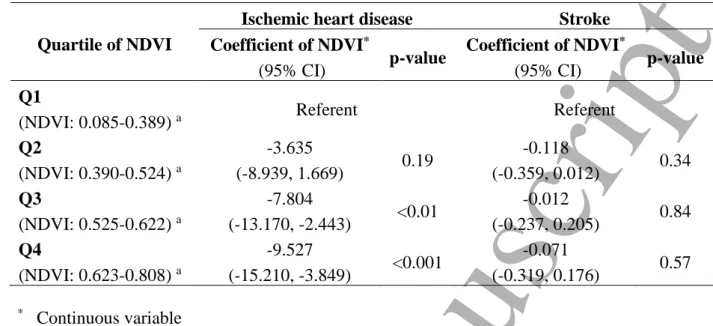
Considering that greenness exposure varies by country, we analysed the four regional
18
groups. Table 3 showed the coefficient estimations of greenness by quartile attributed to
19
cardiovascular diseases in multivariable adjusted models. We coded the countries with the
20
lowest greenness exposure (Q1) as the reference group in the analysis. In the models adjusted
21
for all confounding variables, the coefficient estimates for countries with the highest quartile
22
of green exposure compared to the lowest quartile was -9.527 (95% CI: -15.210, -3.849;
p-23
value: <0.001) for IHD. A linear trend was found in NDVI estimates for IHD, that was, the
24
coefficient of NDVI for IHD was increased from -9.527 for Q4, -7.804 for Q3, to -3.635 for
25
Q1. We also identified a negative relationship between greenness and stroke in all classes,
26
although it was not significant.
27
Furthermore, as shown in table S4, our mediation analysis presented a moderate mediation
28
effect of obesity on the NDVI-IHD association (coefficient = -0.022), compared with the total
29
effect of NDVI on IHD. This finding indicates that with the increase of NDVI exposure, the
30
prevalence of obesity would be decreased, and eventually, the IHD-related DALY will be
31
reduced. However, this mediation effect did not reach the statistical significance (i.e. 95% CI
32
accepted the null value), and it could be resulted from insufficient control for confounding on
33
the obesity-IHD association. Since obesity is not the primary target at the stage of study design,
34
therefore the risk factors contributing to obesity collected in this research were limited. It may
35
partially explain the positive but insignificant mediation effect of obesity on the NDVI-stroke
36 association. 37 3 4 5 6 7 8 9 10 11 12 13 14 15 16 17 18 19 20 21 22 23 24 25 26 27 28 29 30 31 32 33 34 35 36 37 38 39 40 41 42 43 44 45 46 47 48 49 50 51 52 53 54 55 56 57 58 59 60
Accepted Manuscript
14
Table 2. Association models between greenness exposure and cardiovascular diseases
1
(ischemic heart disease and stroke) in the DALY changes based on an increase in NDVI from
2
0 to 1, supported by stratified analysis.
3
Ischemic heart disease Stroke
Coefficient of NDVI* (95% CI) p-value Coefficient of NDVI* (95% CI) p-value Main Model a -11.245 (-16.770, -5.720) <0.001 -4.387 (-7.926, -0.085) <0.05 Model 1 b -11.810 (-17.730, -5.884) <0.001 -5.270 (-9.061, -1.479) <0.01 Model 2 c -11.874 (-17.830, -5.922) <0.001 -5.451 (-9.266, -1.635) <0.01 Model 3 d -11.870 (-17.830, -5.922) <0.001 -5.728 (-9.565, - 1.891) <0.01 Model 4 e -11.530 (-17.490, -5.576) <0.001 -4.960 (-8.810, -1.100) <0.01 Model 5 f -10.230 (-15.990, -4.462) <0.001 -4.102 (-7.714 -0.487) <0.05 Model 6 g -10.720 (-16.290, -5.139) <0.001 -4.097 (-7.675, -0.519) <0.05 Model 7 h -6.102 (-10.410, -1.798) <0.01 -1.618 (-5.523, -0.002) <0.05 * Continuous variable 4
a. Control variables included population size, gender (percentage of females), age, economic
5
status (level of income), smoking, alcohol consumption, education, PM2.5 exposure, obesity
6
attributed to BMI (Body Mass Index), cholesterol, systolic blood pressure, healthcare
7
expenditure, and year.
8
b. Adjusted for population size, gender (percentage of females), age, and year.
9
c. Adjusted for population size, gender (percentage of females), age, PM
2.5 exposures, and year.
10
d. Adjusted for population size, gender (percentage of females), age, PM
2.5 exposures, economic
11
status (level of income), and year.
12
e. Adjusted for population size, gender (percentage of females), age, PM
2.5 exposures, economic
13
status (level of income), alcohol consumption, and year.
14
f. Adjusted for population size, gender (percentage of females), age, PM
2.5 exposures, economic
15
status (level of income), alcohol consumption, smoking, education, and year.
16
g. Adjusted for population size, gender (percentage of females), age, PM
2.5 exposures, economic
17
status (level of income), alcohol consumption, smoking, education, obesity attributed to BMI,
18
cholesterol, systolic blood pressure, and year.
19
h. Considered all covariates and eliminated data from Eastern Europe and Central Asia / Russia
20 countries data 21 3 4 5 6 7 8 9 10 11 12 13 14 15 16 17 18 19 20 21 22 23 24 25 26 27 28 29 30 31 32 33 34 35 36 37 38 39 40 41 42 43 44 45 46 47 48 49 50 51 52 53 54 55 56 57 58 59 60
Accepted Manuscript
15
Table 3. Coefficient estimations of greenness by quartile attributed to cardiovascular diseases
1
in multivariable adjusted models
2
Quartile of NDVI
Ischemic heart disease Stroke
Coefficient of NDVI*
(95% CI) p-value
Coefficient of NDVI*
(95% CI) p-value
Q1
(NDVI: 0.085-0.389) a Referent Referent
Q2 (NDVI: 0.390-0.524) a -3.635 (-8.939, 1.669) 0.19 -0.118 (-0.359, 0.012) 0.34 Q3 (NDVI: 0.525-0.622) a -7.804 (-13.170, -2.443) <0.01 -0.012 (-0.237, 0.205) 0.84 Q4 (NDVI: 0.623-0.808) a -9.527 (-15.210, -3.849) <0.001 -0.071 (-0.319, 0.176) 0.57 * Continuous variable 3
a. Control variables included population size, gender (percentage of females), age, economic
4
status (level of income), smoking, alcohol consumption, education, PM2.5 exposures,
5
obesity attributed to BMI (Body Mass Index), cholesterol, systolic blood pressure,
6
healthcare expenditure, and year.
7
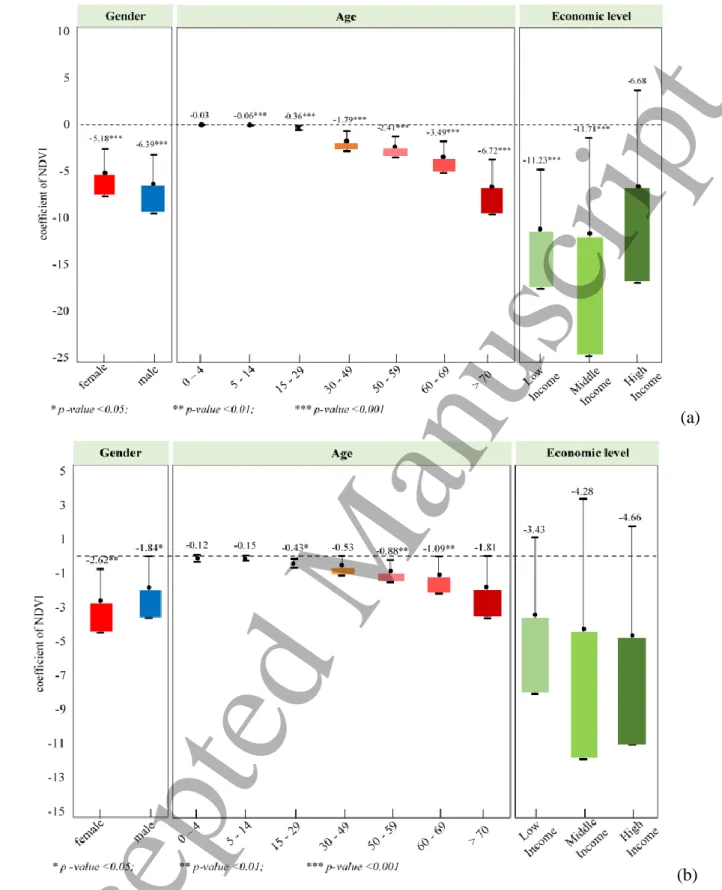
3.3. Stratified analysis
8
The results of the stratified analysis (after adjusting for all covariates) among different levels
9
of gender, age group, and economic status are shown as down bars in figure 2. By analyzing
10
DALY based on gender with similar population ratios, we found that the effect of greenness
11
on IHD and stroke for both females and males indicates a significant negative association with
12
p-values of <0.001 and <0.05, respectively. This finding indicates there is no significant
13
difference in the impact of exposure between genders in reducing the burden of IHD or stroke.
14
We subsequently examined seven age groups and those results are shown in figure 2 (a). We
15
found the health burden due to IHD had a significant negative association with greenness in all
16
age groups except for the population group aged 0 - 4 years. We found a negative correlation
17
in all age groups for strokes and there is significance for ages 15-29, 50-59, and 60-69 years,
18
all of which are displayed in figure 2 (b). In addition, the stratified analysis by economic status
19
shows greenness has a significant negative correlation with IHD in low and middle-income
20
countries and is negatively correlated at all economic levels for stroke.
21 3 4 5 6 7 8 9 10 11 12 13 14 15 16 17 18 19 20 21 22 23 24 25 26 27 28 29 30 31 32 33 34 35 36 37 38 39 40 41 42 43 44 45 46 47 48 49 50 51 52 53 54 55 56 57 58 59 60
Accepted Manuscript
16
(a)
1
(b)
2
Figure 2. Stratified analysis among different gender, age, and economic status for greenness
3
in relation to (a) IHD and (b) stroke in the DALY changes based on an increase in NDVI from
4
0 to 1. Variable adjustments included population size, gender (percentage of females), age,
5
economic status, smoking, alcohol consumption, education, PM2.5, obesity attributed to BMI
6
(Body Mass Index), cholesterol, systolic blood pressure, healthcare expenditure, and year.
7 3 4 5 6 7 8 9 10 11 12 13 14 15 16 17 18 19 20 21 22 23 24 25 26 27 28 29 30 31 32 33 34 35 36 37 38 39 40 41 42 43 44 45 46 47 48 49 50 51 52 53 54 55 56 57 58 59 60
Accepted Manuscript
17
3.4. Positive-negative control variables
1
From table S5, the positive-negative control tests confirmed the robustness and reliability of
2
NDVI estimates. First, the results of positive outcome control found a significantly negative
3
association (p-value <0.001) between greenness exposures and fall-related injuries; As a
4
negative outcome control, the relationship between greenness and road injury did not achieve
5
the statistically significant level (p-value 0.70 for Model 1 and 0.58 for Model 2), and this
6
indicated no relationship between greenness and road injury; As for the positive exposure
7
control, a significantly positive association (p-value <0.01) was obtained from IHD versus
8
PM2.5. This finding was consistent with previous studies that PM2.5 could increase the burden
9
of IHD; The relationship between IHD and wind speed as a negative control had an
10
insignificant association (p-value = 0.15), implied no association between IHD and wind speed.
11
4. Discussion
12
This study is the first global-scale ecological study to assess the association between greenness
13
and cardiovascular diseases. By analyzing the global NDVI and DALY of cardiovascular
14
diseases, our results showed that greenness has a significantly negative relationship with these
15
two disease burdens. Our results were strengthened by previous studies which focused on the
16
local-level analysis (Maas et al., 2009; Pereira et al., 2012; Wilker et al., 2014; Shen and Lung,
17
2016; Wang et al., 2019). Furthermore, the main findings of this study were in line with current
18
research which confirmed that greenness was linked with lower levels of health burden in terms
19
of physical and psychological conditions such as diabetes, stroke, cardiovascular diseases, and
20
stress (James et al., 2015; Dadvand et al., 2016). A four-year longitudinal study conducted in
21
Ontario–Canada showed that higher levels of greenness were associated with a lower risk of
22
cardiovascular diseases and stroke mortality (Villeneuve et al., 2012). In other health studies,
23
the benefits of greenness were also found to improve the health statuses of people with obesity
24
(Villeneuve et al., 2018). Greenness as an environmental feature plays an important role in
25
reducing sedentary behavior, which is a causative factor of obesity. Greenness has also been
26
referred to as natural space, which contributes to obesity prevention by providing opportunities
27
to regenerate physical activity (James et al., 2015). In a study of 15,477 Chinese urban dwellers,
28
Yang showed that greenness has beneficial associations with the body's metabolic system
29
including blood pressure and cholesterol (Yang et al., 2020). They stated that higher greenness
30
levels were associated with lower odds of metabolic syndrome and could have an effective
31
impact on people younger than 65 years old and those with higher household income. It is
32
known that health burdens such as obesity, cholesterol, and high blood pressure are risk factors
33
which are closely related to cardiovascular diseases. We, thus, realized that exposure to
34
greenness could not only reduce the health burden of cardiovascular diseases directly, but also
35
provide benefits to its causal factors.
36 3 4 5 6 7 8 9 10 11 12 13 14 15 16 17 18 19 20 21 22 23 24 25 26 27 28 29 30 31 32 33 34 35 36 37 38 39 40 41 42 43 44 45 46 47 48 49 50 51 52 53 54 55 56 57 58 59 60
Accepted Manuscript
18
Our findings were supported by the comparison between the spatial distribution of
1
greenness (figure 1) and DALY loss due to IHD (figure S2) and stroke (figure S3). From the
2
generated maps, we could know that several countries in Europe and Eastern Mediterranean
3
were categorized as lower exposure to greenness countries, while some countries in Southern
4
and Central Africa as well as Southeast Asia were categorized as higher exposure to greenness
5
countries (figure 1). When took a look at the spatial distribution of cardiovascular diseases
6
including IHD and stroke (figure S2 and figure S3), the spatial distribution of cardiovascular
7
diseases had an inverse pattern with greenness in most of the countries. These patterns also
8
supported our main findings that greenness had a negative association with cardiovascular
9
diseases.
10
It is widely known that economic disparity not only affects the quality of the environment
11
but also relates to the quality of health including medical services and coping strategies to adapt
12
to the burden of disease. In this study, we recognized that there was a significantly negative
13
correlation between greenness and ischemic heart disease (IHD) in low-income and
middle-14
income countries, but insignificant for high-income countries. Our findings were consistent
15
with a study in Florida–USA which showed the highest quartile of greenness was associated
16
with a 20% lower likelihood of ischemic heart disease compared with the lowest quartile of
17
greenness (Wang et al., 2019). In addition, Seo’s study showed those within the highest quartile
18
of urban green space had a reduced risk of total cardiovascular diseases (HR 0.85, 95%
19
confidence interval, CI 0.81–0.89) and coronary heart disease (CHD) or IHD (HR 0.83, 95%
20
CI 0.78–0.89) compared to those within the lowest quartile of green space coverage (Seo et al.,
21
2019). Knowing that developed regions are dominated by high-income countries basically with
22
a proper medical service system, then we considered that the insignificant relationship related
23
to the protective effects of greenness for high-income countries should be reasonable. To
24
minimize the burden of health due to chronic diseases such as IHD, high-income countries have
25
several strategies not only depend on how the nature exposure can help to reduce the health
26
burdens, but also through various implementations of adequate medical services and preventive
27
actions. This statement was supported by the prior studies which stated that high-income
28
countries had experienced large reductions in the incidence and mortality of cardiovascular
29
diseases due to the strategies to overcome risk factors including the adoption of a healthy diet,
30
smoking reduction, and the application of secondary prevention related to the risk of disease
31
(Vartiainen, et al., 1994; Ford, et al., 2007; Mirzaei, et al., 2009). As for stroke, we found a
32
negative relationship, although it was not significant. The lack of significance is possibly due
33
to fluctuations in increases and decreases in stroke burden in several countries. Compared to
34
IHD, lower DALY estimations for stroke in almost all countries around the world could reduce
35
the statistical power of the model estimates.
36
We further assessed the effects of exposure in all seven age groups. A significantly negative
37
relationship for IHD in all age groups was found except for ages 0-4 years. The lack of
38 3 4 5 6 7 8 9 10 11 12 13 14 15 16 17 18 19 20 21 22 23 24 25 26 27 28 29 30 31 32 33 34 35 36 37 38 39 40 41 42 43 44 45 46 47 48 49 50 51 52 53 54 55 56 57 58 59 60
Accepted Manuscript
19
significance of the relationship between greenness and IHD at the age of 0 - 4 years may be
1
due to the low health burden and ineffectiveness of IHD symptom detection for this age. The
2
symptoms of this disease arise as a result of lifestyle factors in adult years, so people in this
3
youngest age group do not exhibit the noted symptoms (Pellanda et al., 2002). Researchers
4
have suggested symptoms of IHD, such as obesity, can begin to be detected at the age of 6
5
years. For adults, the odds of hospitalization for heart disease or stroke are 37% lower among
6
adults in neighborhoods with highly variable greenness as compared to those in predominantly
7
non-green neighborhoods (Pereira et al., 2012).
8
Gender difference is another important social determinant of health that has not been widely
9
considered in environmental health research to this point. Previous studies have argued gender
10
inequality may affect health burden due to differences in perception (Hyun et al., 2016). Their
11
results showed that cardiovascular diseases which have been portrayed as a man’s disease may
12
also be suffered by women, although at a lower number. From the results of stratified analysis,
13
we recognized that exposure to greenness had a significantly negative relationship with IHD
14
and stroke in both males and females. Despite having a different number of cases, these
15
findings indicated that greenness could provide benefits to reduce the risk of disease burden
16
regardless of gender inequalities. Our results were supported by Bolte's study, which showed
17
that greenness could provide benefit and no consistent gender differences regard to the effects
18
of green space on health (Bolte, Nanninga and Dandolo, 2019). In addition, a longitudinal study
19
conducted in seven Korean metropolitan areas also showed the association between greenness
20
and cardiovascular diseases was significantly negative regardless of the sex of participants (Seo
21
et al., 2019).
22
European countries had the highest health burden due to cardiovascular diseases for both
23
IHD and stroke. The WHO Regional Office for Europe (2020) confirmed that cardiovascular
24
diseases caused more than half of all deaths across the European Region. Over the past decade,
25
the highest IHD mortality rates were found in European countries (Finegold, Asaria and
26
Francis, 2013) and the monthly fatality rate for stroke was ranged from 13% to 35% (Béjot et
27
al., 2016). Furthermore, we also found that the health burden due to stroke increased in
28
Southeast Asian countries. While the world's largest population living in these developing
29
countries, the burden of stroke is expected to be high in Asia. In addition, the economic
30
transition in South Asian and Southeast Asian countries such as India, Pakistan, and
31
Bangladesh towards achieving developed country status is ongoing. In these countries, risk
32
factors such as hypertension, obesity, and smoking would become more common and increase
33
the risk of stroke (Venketasubramanian et al., 2017).
34
In this study, MODIS-NDVI images with 1 x 1 km2 resolutionwere used for greenness
35
exposure assessment. We realized that 1 x 1 km2 is not the best spatial resolution of
MODIS-36
NDVI to estimate greenness exposure. Given that the focus of our study covered a global area,
37
we considered the use of 1 x 1 km2 resolution satellite imageries as reliable images for
38 3 4 5 6 7 8 9 10 11 12 13 14 15 16 17 18 19 20 21 22 23 24 25 26 27 28 29 30 31 32 33 34 35 36 37 38 39 40 41 42 43 44 45 46 47 48 49 50 51 52 53 54 55 56 57 58 59 60
Accepted Manuscript
20
estimating greenness in each country. In a different application, the literature by Chang and
1
Hong (2012) stated that compared to the 250-m resolution MODIS, the 1-km resolution image
2
offered almost the same accurate depiction of the shape, coverage, and location of green spaces.
3
From a technical aspect, the use of the MODIS-NDVI satellite imagery with the best spatial
4
resolution of 250 x 250 m2 to generate a global greenness map required intensive computation
5
and computer memory storage, and need the capable machine in data processing due to the
6
large image size. We also recommend the use of MODIS-NDVI with the best spatial resolution
7
of 250 x 250 m2 for local studies or studies with smaller scopes (e.g. city scale).
8
Some limitations of the study should be noted. Knowing that this study was conducted with
9
an ecological study design, the measure of exposure and outcome variables were only a
proxy-10
based on the country-level average. Used country-level databases might not best proportion for
11
variable assessment and could impact on the modifiable areal unit problem as a source of
12
statistical bias. However, due to the lack of residential neighborhood greenness and tree species
13
database for each country, the effects of neighborhood greenspace and biodiversity in the
14
developed models cannot take into account. We also recognized the lack of individual health
15
information might have some impacts on the strength of evidence provided by the results. The
16
causality remains to be explored even though a negative statistical association was found
17
between greenness exposure and the burden of cardiovascular diseases in terms of IHD and
18
stroke. Nevertheless, given we have considered several potential risk factors to adjust the
19
models and identified the robustness estimations, this study could serve an essential role in a
20
better knowledge of how exposure to greenness can be linked to the burden of cardiovascular
21
diseases in terms of IHD and stroke globally. Furthermore, the study findings also openly
22
provide a substantial possibility for further study in the understanding of alleviating human
23
health burdens. Furthermore, we found a negative mediation effect of obesity on the association
24
between greenness and ischemic heart diseases. However, the interpretation of this finding
25
should be cautious since several factors contributing to obesity (e.g. dietary, physical activity)
26
were not controlled that may lead to confounding bias on the obesity-IHD association. This
27
limitation may also explain the unexpected positive mediation role of obesity on the
28
relationship between greenness and stroke that can be discussed in subsequent studies.
29
Otherwise, some covariates have not been adjusted in the model due to the lack of global
30
datasets, such as genetic or hereditary disease, ethnic/race, and other covariates those may
31
influence cardiovascular diseases. Related to exposures, we did not consider meteorological
32
factors such as temperature and precipitation. We suggest future studies consider these
33
meteorological factors since several studies have recognized their association with
34
cardiovascular diseases. Finally, this study focused on a global analysis with a country as the
35
basic unit in the statistical analysis. Knowing that the DALY data provided by WHO is only
36
available at the country-level, not available at the states and/or provinces-cities scale. A
37
separate analysis for big countries such as the USA, Canada, and China for considering the
38 3 4 5 6 7 8 9 10 11 12 13 14 15 16 17 18 19 20 21 22 23 24 25 26 27 28 29 30 31 32 33 34 35 36 37 38 39 40 41 42 43 44 45 46 47 48 49 50 51 52 53 54 55 56 57 58 59 60
Accepted Manuscript
21
within-country variability cannot be done in our study. Future studies could focus on the effects
1
of greenness benefits at local communities in the case a finer-resolution DALY data becomes
2
available.
3
Cardiovascular disease is the leading cause of death in the human population, and 80% of
4
its deaths occur in low and middle-income countries (GBD 2017 Cause of Death of
5
Collaborators, 2018; WHO, 2019). WHO noted that the total economic losses due to
6
cardiovascular diseases were estimated to reach $ 3.7 trillion between 2011 and 2015,
7
representing approximately half of the economic burden for treating non-communicable
8
diseases, and 2% of Gross Domestic Product across countries (Bloom, et al., 2013). As the
9
main emphasis, this study confirmed that greenness can reduce the health burden due to
10
cardiovascular diseases significantly. Knowing that exposure to greenness is one of the natural
11
features that could be freely accessed, our findings related to the health benefits of green spaces
12
could provide scientific evidences for policymakers and communities in minimizing the health
13
burden not only from physical or psychological aspects, but also economic burden through
14
suppressing the costs spent for medical treatment due to cardiovascular diseases.
15
5. Conclusion
16
This study is the first global-scale study with an ecological study design to assess the
17
association between greenness and cardiovascular diseases based on the data from 183
18
countries worldwide. Our results showed a consistently significant negative relationship
19
between greenness and the burden of cardiovascular diseases, including both IHD and stroke.
20
The stratified analysis showed that greenness could provide health benefits regardless of gender
21
differences and age groups. Greenness exposure was also confirmed to have a significant effect
22
in low and middle-income countries, especially for IHD burden. Despite the limitations noted,
23
our study contributed to a global research baseline that could be used as a reference for
24
environmental development and public health. We suggest policymakers and communities to
25
green environment management in order to reduce the global health burden.
26 3 4 5 6 7 8 9 10 11 12 13 14 15 16 17 18 19 20 21 22 23 24 25 26 27 28 29 30 31 32 33 34 35 36 37 38 39 40 41 42 43 44 45 46 47 48 49 50 51 52 53 54 55 56 57 58 59 60
Accepted Manuscript
22
Author Contributions: Conceptualization, C.D.W., J.D.S., A.KA., and H.J.S.; methodology, C.D.W., A.K.A.,
1
and W.C.P.; formal analysis, A.K.A., and W.C.P.; writing—original draft preparation, C.D.W, and A.K.A..;
2
writing—review and editing, C.D.W., A.K.A., Y.L.G., S.C.C.L., C.P.Y., W.C.P., J.D.S., and H.J.S.; visualization,
3
A.K.A..; supervision, C.D.W., S.C.C.L., and H.J.S.; funding acquisition, C.D.W., H.J.S., S.C.C.L., and J.D.S.
4
Funding: This study was funded by the Ministry of Science and Technology, R.O.C. (MOST
107-2314-B-010-5
059-MY3).
6
Data Availability: The data that support the findings of this study are openly available at the following URL/DOI.
7
• Land Processes Distributed Active Archive Center - NASA: https://lpdaac.usgs.gov/
8
• Global Health Estimates - WHO: http://www.who.int/healthinfo/global_burden_disease/en/
9
• World Population Prospects - United Nations: https://esa.un.org/unpd/wpp/
10
• World Bank list of economies – World Bank group:
11
https://datahelpdesk.worldbank.org/knowledgebase/articles/906519-world-bank-country-and-lending-12
groups
13
• The Atmosphere Composition Analysis Group - Prof. Randall Martin from Dalhousie University:
14
http://fizz.phys.dal.ca/~atmos/martin/?page_id=140
15
Acknowledgments: This study was funded by the Ministry of Science and Technology, R.O.C. This study was
16
supported by the World Health Organization (WHO), who provided the metrics, i.e. disability-adjusted life years
17
(DALY) database to estimate global health burden of IHD and stroke; the National Aeronautics and Space
18
Administration (NASA), which provided global greenness - NDVI data (MOD13A3); the Atmospheric
19
Composition Analysis Group, which provided global PM2.5 data; the United Nations Agency, which served
20
demographic data; and the World Bank Group, which provided the provisions of economic status, the prevalence
21
rate of smoking, alcohol consumption and risk factor data at a country-level.
22
Conflicts of Interest: The authors declare no conflict of interests. The funders had no role in the design of the
23
study; in the collection, analyses, or interpretation of data; in the writing of the manuscript; or in the decision to
24
publish the results
25 3 4 5 6 7 8 9 10 11 12 13 14 15 16 17 18 19 20 21 22 23 24 25 26 27 28 29 30 31 32 33 34 35 36 37 38 39 40 41 42 43 44 45 46 47 48 49 50 51 52 53 54 55 56 57 58 59 60