行政院國家科學委員會專題研究計畫 成果報告
營建產業智慧資本現況、影響因素與提升對策之研究
研究成果報告(精簡版)
計 畫 類 別 : 個別型 計 畫 編 號 : NSC 97-2221-E-151-058- 執 行 期 間 : 97 年 08 月 01 日至 98 年 07 月 31 日 執 行 單 位 : 國立高雄應用科技大學土木工程系 計 畫 主 持 人 : 黃忠發 計畫參與人員: 碩士班研究生-兼任助理人員:薛曉筑 碩士班研究生-兼任助理人員:黃建偉 報 告 附 件 : 出席國際會議研究心得報告及發表論文 處 理 方 式 : 本計畫涉及專利或其他智慧財產權,2 年後可公開查詢中 華 民 國 98 年 10 月 29 日
行政院國家科學委員會補助專題研究計畫
■ 成 果 報 告
□期中進度報告
營建產業智慧資本現況、影響因素與提升對策之研究
計畫類別:■ 個別型計畫 □ 整合型計畫
計畫編號:97-2221-E-151-058-
執行期間:
97 年 8 月 1 日至 98 年 7 月 31 日
計畫主持人:黃忠發
計畫參與人員:薛曉筑、黃建偉
成果報告類型(依經費核定清單規定繳交):■精簡報告 □完整報告
本成果報告包括以下應繳交之附件(另附檔)
:
□赴國外出差或研習心得報告一份
□赴大陸地區出差或研習心得報告一份
■出席國際學術會議心得報告及發表之論文各一份
□國際合作研究計畫國外研究報告書一份
處理方式:除產學合作研究計畫、提升產業技術及人才培育研究計畫、
列管計畫及下列情形者外,得立即公開查詢
※涉及專利或其他智慧財產權,二年後可公開查詢
執行單位:國立高雄應用科技大學土木工程系
中 華 民 國 98 年 10 月 29 日
一、緒論
1.1 背景與動機 隨著知識經濟時代的來臨,知識與智慧資本已經成為現代生產最重要的條件,所以如 何妥善管理企業內部所蘊藏的無形資產智慧資本,被視為經營上最重要的課題之ㄧ【宋偉 航譯,1999】。透過智慧資本相關的研究發現,近幾年以來智慧資本逐漸受到各國內外學者 與業界之重視,但是過去以往有關智慧資本的實證研究,多著墨於知識密集型的產業如資 訊、高科技或傳統產業等。對營建業而言,智慧資本管理此一名詞則是近幾年才漸漸被受 到重視推行之企業經營概念,而且與營造業相關之研究甚少針對智慧資本的影響情形進行 討論,若有也是僅著重於營造業智慧資本發展之探討,尚未有研究投入於以營造業為研究 主題之實證調查。 就營造產業來說,隨著產業結構與環境不確定性的增加,使綜合營造廠逐漸將專案執 行中部份的工程,分包給予專業營造廠,或是使其下包施作之比重上升【張倩瑜,2002】, 進一步探究營造業特性與其他產業特性迥然不同,營造業所生產的產品難以標準化,且組 織內最重要資產是以人力為主要關鍵,同時也為一個相當重個人經驗的產業。Kamara(2002) 提出營造業非常依賴個人所累積的內隱知識,但是因為組織內部員工流動率高,存在於員 工個人身上之專業知識與經驗亦隨之流失,因此若欲強化我國營造業競爭力之關鍵將在於 如何擷取內部員工的知識與經驗的創造生產、累積、移轉並加以運用轉換為公司內部資產, 在營造業整體運作過程中更顯現其存在的重要性。 1.2 研究目的 基於以上背景及動機,本研究以營建業產業中的營造業之智慧資本為研究主題,深入 探討其與企業績效間之關聯性。本文主要目的包含(1)暸解國內綜合營造廠智慧資本發展 概況,並進ㄧ步分析公司於管理保存既有的人力資本、結構資本與關係資本之情形;(2) 探討營造業組織內智慧資本對企業經營績效影響的程度,以瞭解智慧資本是否能為公司創 造較優異的經營績效之外,並衡量智慧資本三構面之關聯性。 1.3 研究方法 本研究透過問卷調查,暸解目前國內綜合營造廠智慧資本發展概況,並進一步進行相 關性分析瞭解智慧資本與企業經營績效之關聯性,最後再以徑路分析來驗證各個變項之間 是否具有因果之關聯性。 1.3.1 研究理論架構 本研究理論主要參考Bontis(1998) 及陳美純(2001)所建立之架構,設立本研究理論模 型,如圖1 所示,模型中第一部份為探討綜合營造廠智慧資本三構面與企業經營績效間之 關係,第二部份為探討綜合營造廠智慧資本之人力資本、結構資本與關係資本三者之間的 互動關係;透過徑路分析進行檢驗研究構面間因果之關聯性。由上述研究模型推演出本研 究之假設如下: H1:組織之結構資本對於企業經營績效呈正向直接影響。 H2:組織之人力資本對於企業經營績效呈正向直接影響。 H3:組織之關係資本對於企業經營績效呈正向直接影響。 H4:組織之人力資本對於結構資本呈正向直接影響。 H5:組織之人力資本對於關係資本呈正向直接影響。企業經營績效 關係資本 人力資本 結構資本 圖 1 研究理論模型 H1 H2 H3 H4 H5 1.3.2 研究對象 本研究主題為探討營造業智慧資本與企業經營績效之關係,故本研究範圍設僅限於營 造業法第七條定義之綜合營造業,並以問卷的方式進行調查。主要樣本來源是以台灣地區 綜合營造工程工業同業公會之廠商統計名冊,從中選取資本額與公司承接工程的資歷皆符 合綜合營造規定升等之甲等綜合營造廠、乙等綜合營造廠為研究對象。研究問卷主要透過 專人或郵寄發放,問卷採用匿名方式且回收問卷以郵寄方式為主,藉以增加受測者之填答 意願並提升問卷調查成效。 1.3.3 問卷設計 本研究設計問卷構面之理論基礎乃藉由文獻探討、整理。量表分為量表問項與結構式 問項兩部分;本研究量表部分,分成人力資本、結構資本、關係資本與經營績效四構面, 各構面量表再經由文獻細分出數個細部構面,本研究主要參考陳美純(2001)與 Huang and Hsueh(2007)整理自多位學者量表所建構之指標作為本問卷設計依據。量表以李克特七點尺 度方式以衡量受測者對各問項之相對認同程度為何,依其感受並將最接近實際的情形,以 勾選方式分別在選項為將「非常不同意」、「不同意」、「有點不同意」、「無意見」、「有點同 意」、「同意」、「非常同意」,並依序給予1 至 7 分。 1.3.4 分析方法 本研究主要透過統計方法進行分析,首先進行敘述性統計分析針對受測公司基本資料 與智慧資本現況之分析。再續對量表進行信度分析,並透過 Pearson 相關分析衡量人力資 本、結構資本、關係資本與企業經營績效之間的相關程度。最後利用徑路分析加以驗證本 研究理論模型。
二、受測公司基本資料分析
本研究問卷所調查回收的有效樣本為102 份,其中所屬級別為甲等綜合營造廠有 62 家 (占 60.8%)、乙等綜合營造廠為 40 家(占 39.2%)。公司成立時間大多為 10~19 年的綜合營造 廠占56.9%,平均成立年限約為 16.6 年。整體受測公司內部員工總人數大部份低於 50 人以 下,平均每一企業內部員工數約為47.9 人,由此結果顯示目前國內營造公司多屬於中小型 企業居多。在員工離職率部份,整體受測公司去年(2008)員工離職比率以 1~10%占 51%為 最多,平均員工離職率11.6%。而張力云(2006)調查 2005 年大型營造廠員工之離職率為 16.5%,此結果與本研究相較之下顯示營造業之內部員工流動率可能受到產業環境影響使 之趨於較為穩定的狀態,詳見表1。 2從受測公司基本財務資料分析結果得知,整體受測公司資本額中位數為 1 億元,其中 資本額以1 億~5 億元占 47.1%為最多,資本額為低於 5,000 萬元占 42.2%居次。就去年(2008) 營業額觀看之,其中位數為3 億元,又以 1 億~10 億元營業額占 47.1%為最多,而亦有少部 份受測公司營業額達十億以上。 表 1 受測公司基本資料表 分析資料 內容 百分比 平均數 中位數 標準差 甲等綜合營造廠 60.8 產業級別 乙等綜合營造廠 39.2 - - - <10 年 13.7 10~19 年 56.9 20~29 年 19.6 30~39 年 6.9 成立年數 (年) 40 年以上 2.9 16.6 14.0 10.9 <10 人 22.5 10~49 人 54.9 50~99 人 12.7 100~499 人 6.9 員工總人 數(人) 500 人以上 2.9 47.9 20.0 96.9 0% 17.6 1~10% 51.0 11~20% 15.7 21~30% 6.9 員工離職 率(%) 31%以上 8.8 11.6 5.0 16.2 <5,000 萬 42.2 5,000 萬~<1 億 4.9 1 億~<5 億 47.1 5 億~<10 億 2.0 資本額(萬) 10 億以上 3.9 16,799 10,000 38,717 <5,000 萬 13.7 5,000 萬~<1 億 23.5 1 億~<10 億 47.1 2008 年營 業額(萬) 10 億以上 15.7 62,997 30,000 93,715
三、受測公司智慧資本之資料分析結果
本章為了瞭解目前綜合營造廠發展概況,以受測公司投入提供組織內部員工教育訓 練、企業本身所屬之經營類型、建構內部知識資產的項目與費用,以及產業研發費用等進 行討論分析。 3.1 公司對組織內部員工訓練4 表 2 為受測公司為了提昇企業內部員工的專業知識能力,於去年度花費在補助員工考 取相關證照、企業外訓練課程、在職進修等教育訓練費用之情形,整體而言,受測公司花 費於教育訓練費用之中位數為 10 萬元,且多數營造廠投入提供予員工教育訓練之金額在 10 萬元以下,占 48%,其次以 11 萬~30 萬,占 23.5%居次,而也有少部份,約 10.8%之營 造廠投入在教育訓練的費用超過50 萬元以上。整體受測公司平均每一企業投入於員工教育 訓練費用占總營業額之比例為萬分之八,而每ㄧ企業之員工平均每人每年約可獲得公司補 助教育訓練費用之中位數為5,700 元。 表 2 受測公司之「花費於教育訓練之費用」 題目 內容 百分比 平均數 未編列此項費用 10.8 10 萬或以下 48.0 11 萬~30 萬 23.5 31 萬~50 萬 6.9 教育訓練費用 (萬) >51 萬以上 10.8 26.9 3.2 公司對產業研發投入之情況 從表 3 分析結果顯示,約有 55.9%之受測公司表示現階段尚未編列產業研發費用,而 已有投入產業研發費用之受測公司,編列此項費用者以不到50 萬元占 25.5%為多數,但是 也有部份公司投入編列百萬元以上之研發費用,平均整體受測公司投入研發費用金額為 87.6 萬元;顯示國內綜合營造廠大部份尚未投入於編列研發方面的費用。 表 3 受測公司投入於產業研發費用分析表 題目 內容 百分比 平均數 未編列此項費用 55.9 1 萬~49 萬 25.5 50 萬~99 萬 4.9 產業研發費用 (萬) 100 萬以上 13.7 87.6 3.4 公司內部之知識資產統計 從表 4 為受測公司內部已建構擁有之內部知識資產項目統計情形,得知整體受測公司 約有 75.3%擁有建構企業內部業務文件檔案庫,如契約、圖說等讓員工能快速查閱公司過 去業務之相關資料,而且有 55.7%的營造廠組織內部有編列標準作業流程手冊或工作說明 書;而只有少數營造廠能以優異的工程成果獲得國家頒佈績優獎項或通過ISO 品質認證, 亦僅較少數營造廠有自行研究發明特殊工法或作業系統等,以申請取得自屬專利權。 3.3 營造業智慧資本構面與信度分析 表 5 為本研究智慧資本量表各構面之統計資料,而依據 Guieford(1965)所提出一項 判斷信度之準則,由表可見量表整體與各構面之信度皆高於0.7,其中僅人力資本之員工年 資水準Cronbach’s α 值為 0.598 稍低,但仍介於 0.35~0.70 之間代表信度尚可,表示本研究 量表所得之結果具有高度一致性與穩定度。 人力資本平均得分為5.19,細部構面中以「員工特質能力」表現最高,平均分數為 5.42, 平均最低為「員工教育訓練(4.78)」。結構資本平均數為 5.18,其中以「組織結構設計(5.28)」 之平均表現最佳,最差者為「企業整體流程(5.08)」。關係資本平均數為 5.52,其中以「與 業主業務配合度(5.67)」分數最高,表現最差者為「與業主交情培養(5.14)」。在企業經營 績效方面,企業經營績效平均得分為 4.91,顯示整體受測公司對目前企業經營績效之表現
呈現持平的現象,頗能客觀的反映該產業之實況。其中得分較高者為「財務績效指標 (4.91)」,較低者為「營運績效指標(4.81)」。 智慧資本三構面中,表現較佳者為關係資本(5.52),對於此現象本研究推論或許是因為 營造產業於執行工程業務過程中所涉及工程範圍較為廣泛,而且工程業務服務對象是以業 主為主,在確定簽約專案成立之後,必須依照業主事先訂定的設計規範執行採購與施工等 後續工作,亦因此使得國內工程界對公司外部關係之維持與建立較為重視。而其次人力資 本(5.19)與結構資本(5.18)以些微的差距表現較差,此現象有可能是因為國內綜合營造業大 部份的公司對於人力資源管理的重視程度,相較於公司對外部關係的培養比較低,而且透 過張力云(2006)研究調查國內營造業設置人力資源部門之情形,亦可發現營造廠對於公司人 力資源部門正式化的程度低,此外公司雖然對於整體組織結構運作流程具有一定的程序, 但是所投入運用在組織與經營管理方面仍有待需要加強之處。 表 4 受測公司擁有之內部知識資產項目統計分析表 排序 項 目 樣本數 百分比 1 業務文件(如契約、圖說)檔案庫 73.0 75.3 2 標準作業流程手冊或工作說明書 54.0 55.7 3 公司網站 36.0 37.1 4 專業軟體(如土木專業軟體或 ERP) 33.0 34.0 5 電子資料庫系統 31.0 32.0 6 通過ISO 品質認證 28.0 28.9 7 評鑑績優獎項(如金質獎) 17.0 17.5 8 發明專利權(如特殊工法或系統) 4.0 4.1 9 其它 (例如:採購發包) 1.0 1.0 表 5 量表各構面之信度與平均分數 研究構面 Cronbach’s α 平均值 標準差 人力資本 員工特質能力 員工知識交流 員工教育訓練 員工年資水準 0.921 0.855 0.883 0.746 0.598 5.19 5.42 5.13 4.78 5.20 0.83 0.86 0.95 1.14 1.14 結構資本 企業整體流程 組織結構設計 資訊系統架構 0.895 0.773 0.806 0.774 5.18 5.08 5.28 5.25 0.82 0.88 0.94 0.97
6 表 5 量表各構面之信度與平均分數(續) 研究構面 Cronbach’s α 平均值 標準差 關係資本 與業主業務配合度 與平行單位關係 與業主交情培養 0.903 0.854 0.820 0.798 5.52 5.67 5.61 5.14 0.78 0.84 0.88 1.07 企業經營績效 財務績效指標 營運績效指標 0.920 0.850 0.897 4.91 4.91 4.89 0.96 0.91 1.09 3.4 各研究構面之相關分析 表 6 為智慧資本三構面與企業經營績效之相關分析結果,總體智慧資本與企業經營績 效(r =0.651, p<0.01)相關係數達顯著中度正向相關,而人力資本、結構資本與關係資本三 者分別也與企業經營績效達顯著正向相關,其中以結構資本與企業經營績效間(r =0.627, p <0.01)之相關係數較高且為中度正向相關。另外,智慧資本三構面之間也具有正向關係, 其相關係數皆大於0.5 且達顯著水準之中度相關,而其中又以人力資本與結構資本(r =0.707, p<0.01)之相關係數較高,且達顯著高度正向相關。整體而言,智慧資本三項資本彼此產生 顯著正向關係,顯示智慧資本三構面間相互之關聯性為緊密不可分割的,亦表示人力資本 對於綜合營造廠之結構資本與關係資本之提昇有正向影響,並驗證過去眾多文獻中將人力 資本視為智慧資本之首,且為建構結構資本與關係資本之基石。另外,透過智慧資本三構 面下之細部構面與企業經營績效之相關分析結果得知,若綜合營造廠公司得以擁有良好的 智慧資本,對企業經營績效將具有正向的提升效果,而在人力資本、結構資本與關係資本 三構面下之所有細部構面對於企業經營績效也有明顯的相關,故其應被企業視為提升績效 的重點方向。 表 6 智慧資本三構面與企業經營績效之相關分析 Pearson相關 人力資本 結構資本 關係資本 人力資本 1 結構資本 0.707** 1 關係資本 0.534** 0.545** 1 企業經營績效 0.503** 0.627** 0.538** 註:1總體智慧資本與企業績效之相關係數為0.651** 註:2*p<0.05;**p<0.01]
四、綜合營造業智慧資本與企業經營績效之因果關聯性分析
經由前敘之相關分析確認各研究構面變數之間的相關程度後,為了進一步探討各變項 之因果關係,本研究再以徑路分析的統計方法探討智慧資本三構面與企業經營績效間之因 果關聯性。 本研究之理論模型經由理論基礎與文獻回顧建構而成,模型分為兩部分,第一部份為 智慧資本對企業經營績效之影響,依變數為企業經營績效,自變數為人力資本、結構資本 與關係資本。第二部份為人力資本對結構資本及關係資本之互動情況,自變數為人力資本, 依變數分別為結構資本與關係資本。將本模型之兩部份以迴歸方程式表示如下:第一部份: Y1(企業經營績效)=b1X1(結構資本) + b2X2(人力資本) + b3X3(關係資本) + ε1…...(1) 第二部份: Y2(結構資本)= b4X2(人力資本) + ε2……...(2) Y3(關係資本)= b5X2(人力資本) + ε3……...(3) 從圖2 研究模型之徑路分析得知,第一部份迴歸模式之判定係數(R2)為 0.449,其中以 結構資本(β=0.452**)與關係資本(β=0.271*)對企業經營績效之路徑達到顯著水準,表示智 慧資本之結構資本與關係資本對於企業經營績效具有直接顯著影響效果,亦證明綜合營造 廠之結構資本與關係資本確實與企業經營績效具有直接的因果關係。第二部份人力資本對 結構資本及關係資本三者間之互動情形,顯示人力資本對結構資本(β=0.707**)模式之判定 係數(R2)為 0.499,以及人力資本對關係資本(β=0.534**)模式之判定係數(R2)為 0.285,代 表組織之人力資本確實對於組織之結構資本與關係資本具有直接顯著影響效果,亦證明與 眾多學者認為智慧資本以人力資本為首,建構出結構資本與關係資本。 除了各研究變數間之直接影響因果關係外,人力資本與結構資本、關係資本對企業經 營 績 效 之 間 接 影 響 效 果 分 別 為 0.320(0.707×0.452) 、 0.145(0.534×0.271) , 總 效 果 為 0.503(0.707×0.452+0.534×0.271+0.038),顯示智慧資本三構面對企業經營績效影響之關聯 性,雖然只有組織之人力資本對企業經營績效未具有直接顯著影響效果,但是人力資本對 企業經營績效之總效果,高於結構資本與關係資本對企業經營績效之直接影響效果,由此 可驗證組織之人力資本是建構智慧資本的基石。 0.846 人力資本 結構資本 R2=0.499 關係資本 R2=0.285 企業經營績效 R2=0.449 0.038 0.452** 0.271* 0.707** 0.742 0.534** 0.708 由上述分析本研究理論模型智慧資本三構面與企業經營績效間之影響關係,以驗證本 研究理論模型之假設確立結果,其中第一部份智慧資本三構面對企業經營績效之影響中, 組織之結構資本與關係資本對企業經營績效皆具有正向直接影響效果,故 H1、H3 可獲得 成立;而僅有H2:組織之人力資本對企業經營績效具有正向直接影響效果,不成立。第二 部份智慧資本三構面之中,組織之人力資本對結構資本、關係資本具有正向直接影響效果, 故H4、H5 均獲得成立。
8
本研究模型之分析結果顯示,智慧資本三構面對企業經營績效呈現正向關係,其中以 結構資本與關係資本具直接影響企業經營績效之效果,且組織之人力資本則可透過結構資
本與關係資本對企業經營績效之表現具有正面提升的效益;此結果也與 Bonints(1998)、
Bonints et al.(2000)、陳美純(2002)與 Huang and Hsueh (2007)之研究成果可相互呼應。
五、結論與提升對策
依據上述分析本研究提出以下結論。 (一)營造業智慧資本管理現況 綜合營造業智慧資本管理之現況,就人力資本、結構資本與關係資本三構面的 表現情形,以關係資本之表現為較佳,而人力資本與結構資本僅以些微差距表現居 次,其中又以人力資本之「員工教育訓練」與結構資本之「企業整體流程」此兩細 部構面表現最差。從研究調查公司投入於提供補助員工教育訓練情形與內部知識資 產項目中,亦可證實受測公司普遍在編列投資內部員工教育訓練費用稍低,以及雖 然大部份公司本身已有建構業務文件檔案庫、標準作業流程與資料庫等設備,提供 組織內部員工使用查詢,但是整體受測公司卻普遍認為組織內部知識資產之使用與 順暢度,應視為有待加強改善之處。 (二)營造業智慧資本與企業經營績效之關聯性 由相關分析結果得知,人力資本、結構資本、關係資本對企業經營績效有顯著 正向相關,其強弱分別為結構資本、關係資本、人力資本,另外智慧資本三構面之 間亦皆達顯著正向相關且相關係數皆高於0.5。由此可證實智慧資本三構面彼此之間 的關係為緊密不可分割的說法,表示綜合營造廠若能有效的提昇企業智慧資本,則 對於經營績效將有相當的助益。 藉由徑路分析之結果發現,智慧資本與企業經營績效關係中,結構資本與關係 資本對企業經營績效具有直接正向影響效果;而在智慧資本三構面彼此間互動的行 為之中,人力資本則分別顯著影響結構資本與關係資本。本研究理論模型中,顯示 共有六條顯著的路徑,分別為結構資本Æ 企業經營績效、關係資本 Æ 企業經營績 效、人力資本Æ 結構資本、人力資本 Æ 關係資本,以及人力資本 Æ 結構資本 Æ 企業經營績效與人力資本Æ 關係資本 Æ 企業經營績效。 針對上述結論本研究針對業界提出改善建議。 (一)擬定智慧資本管理策略 受測公司普遍對於組織內部智慧資本皆有一定的認同程度,也驗證智慧資本對 企業經營績效具有正向的效益。然而在企業處於競爭激烈的產業環境與策略管理領 域中,公司必須清楚本身組織內部員工與整體運作流程等各方面的優劣勢,以及外 在環境的機會與威脅,建構公司之智慧資本管理制度,並予以保存管理、利用,以 有效提昇超越同業競爭者之企業競爭優勢。 (二)培育提升人力資本之蓄積 營造業非常依賴個人所累積的內隱知識,故組織內部員工所擁有的知識與經驗 通常被視為企業重要的資產。而從本研究調查發現,組織之人力資本顯著直接影響 結構資本與關係資本,並且藉由這兩大構面間接對組織之智慧資本與企業經營績效有正面提昇的助益。故企業應需加強培養內部組織人員溝通協調等方面的能力,並 提供員工的教育訓練、補助考取相關專業證照,以及透過多元化的獎勵津貼制度措 施,促進組織共同創造知識與經驗共享之企業文化。
六、參考文獻
1. Bassi, L. J. and Buren, M. E.V., “Valuing investment in intellectual capital,” International Journal of Technology Management, 18(5/6/7/8), pp. 414-432 (1999).
2. Bontis, N., “Intellectual capital: an exploratory study that develops measures and models,” Management Decision, 36(2), pp. 63-76 (1998).
3. Bontis, N., “Managing organizational knowledge by diagnosing intellectual capital: framing and advancing the state of the field,” International Journal of Technology Management, 18(5/6/7/8), pp. 433-462 (1999).
4. Bontis, N., “There’s price on your head: management intellectual capital strategically,” Ivey Business Quarterly, 60(4), pp. 40-47 (1996).
5. Bontis, N., W. C. C. Keow and S. Richardson., “Intellectual capital and business performance in Malaysian industries,” Journal of Intellectual Capital, 1(1), pp. 85-100 (2000).
6. Dzinkowski, R., “The measurement and management of intellectual capital: An introduction,” Management Accounting, 78(2), pp. 32-36 (2000).
7. Edvinsson, L., Sullivan, P., “Developing a model for managing intellectual capital,” European Management Journal, 14(4), pp. 356-364 (1996).
8. Guieford, J. P., Fundamental Statistics in Psychology and Education (4th ed.), McGraw-Hill, New York (1965).
9. Guthrie, J., “The management, measurement and the reporting of intellectual capital,” Journal of Intellectual Capital, 2(1), pp. 27-41 (2001).
10. Guthrie, J., Petty, R., “Intellectual capital: Australian annual reporting practices,” Journal of Intellectual Capital, 1(3), pp. 241-251 (2000).
11. Huang, C.F. and Hsueh, S.L., “A study on the Relationship between Intellectual Capital and Business Performance in the Engineering Consulting Industry: A Path Analysis Approach,” Journal of Civil Engineering and Management, 13 (4), pp. 265-271 (2007). 12. Hubert, S.O., “Tacit knowledge: the key to the strategic alignment of intellectual capital,”
Strategy & Leadership, 24(2), pp. 10-14 (1996).
13. Johnson, W. H. A., “An integrative taxonomy of intellectual capital: measuring the stock and flow of intellectual capital components in the firm,” International Journal of Technology Management, 18(5/6/7/8), pp. 562-575 (1999).
14. Kamara, J. M., and Augenbroe, G., “Knowledge management in the architecture, engineering and construction industry,” Construction Innovation, 2(1), pp. 53-67 (2002). 15. Roos, J., Roos, G., Dragonetti, N. and Edvisson, L., Intellectual Capital: Navigating the
New business Landscape, Macmillan Business, London (1997).
10 Accounting, 2(1), pp. 73-97 (1997).
17. 宋偉航譯,Stewart, T.A.著,智慧資本:資訊時代的企業利基,智庫文化出版,台北 (1999)。
18. 林大容譯,Edvinsson, L. & Malone, M. S.著,智慧資本:如何衡量資訊時代無形資產 的價值,麥田出版,台北 (1999)。 19. 林妙雀,「企業之智慧資本與分享組織文化對組織管理績效影響之實證研究」,管理評 論,第二十四卷,第一期,第55-81 頁 (2005)。 20. 張力云,我國營造公司人力資源管理策略及內涵之研究,碩士論文,國立高雄應用科 技大學土木工程與防災科技研究所,高雄 (2006)。 21. 張倩瑜,營建智慧資本之研究,行政院國家科學委員會補助專題研究計畫成果報告, 臺灣營建研究院,台北 (2002)。 22. 張榮次,營造業工地主任管理角色與激勵因素之研究,碩士論文,國立高雄應用科技 大學土木工程與防災科技研究所,高雄 (2005)。 23. 陳冠羣,工程顧問公司智慧資本與企業績效之關係研究,碩士論文,國立高雄應用科 技大學土木工程與防災科技研究所,高雄 (2007)。 24. 陳美純,資訊科技投資與智慧資本對企業績效影響之研究,博士論文,國立中央大學 資訊管理研究所,桃園 (2001)。
行政院國家科學委員會補助國內專家學者出席國際學術會議報告
2009 年 10 月 28 日 報告人姓名 黃忠發服務機
構及職
稱
國立高雄應用科技大學土木系 副教授 時 間 會 議 地 點 98 年 5 月 27 日至 5 月 30 日 韓國濟州島 本會核定 補助文號 NSC 97-2221-E-214-052- 會議 名稱 (中文) 2009 國際營建工程與專案管理研討會(英文) the International Conference on Construction Engineering and Management/Project Management (ICCEM-ICCPM2009)
發表 論文 題目
(中文) 營建業智慧資本與經營績效之關連性實證分析
(英文) EMPIRICAL ASSOCIATIONS BETWEEN INTELLECTUAL CAPITAL AND PERFORMANCE OF ARCHITECTURE FIRMS
報告內容:
一、 參加會議經過ICCEM-ICCPM2009 是由兩個不同的研討會結合而成,ICCEM(International
Conference on Construction Engineering and Management),今年乃由韓國營建工程與管理 學會(Korea Institute of Construction Engineering and Management, KICEM)主辦的大型國
際研討會,從2003 年起每兩年舉辦一次,至今是第三屆;而 ICCPM(International
Conference on Construction Project Management)則是由新加坡南洋理工學院主辦的國際
營建專案管理研討會,從1995 年起原本每三年舉辦一次,至今是第六屆。自 2007 年開 始,韓國的ICCEM 與 新加坡的 ICCPM 聯合擴大舉辦國際研討會,於是研討會名稱結 合為ICCEM-ICCPM,經由過去兩方主辦單位的努力之下,ICCEM-ICCPM 業已成長為 亞洲區最盛大營建工程與專案管理相關學術會議之一,今年吸引了來自包括英、美、日、 加拿大、澳洲中、國大陸等19 個國家超過 500 位專家學者參與。下次舉辦時間為 2011 年,地點在澳洲。 計畫申請人於 5 月 26 日早晨從高雄國際機場出發搭乘華航班機直飛韓國濟州機場, 中午抵達,由,在友人安排下很順利地在下午三點左右抵達研討會會場Haveachi Hotel。 研討會總共有四天,5 月 27 日下午是歡迎茶會、28/29 兩天則是主要會議時間、30 日研 討會安排的當地旅遊行程。28/29 兩天的會議總共有 9 個 Keynotes,邀請到目前全球營 建管理學術界最重量級的研究學者談論當前的重要課題的研究進程,包括Israel Institute
of Technology 的 Ronie Navon 教授(自動化資料擷取)、University of Illinois at
Urbana-Champaign 的 Feniosky A. Pena-Mora 教授(電腦 3D 模擬)、University of Tokyo 的 Matsumura Shuichi 教授(創造力)、Hanyang University 的 Soo Sam Kim (國際拓展)、 National University of Singapore 的 George Ofori(領導力)、UC Berkeley 的 Iris Tommelein 教授(精簡營建)、University of Alberta 的 Simaan M. AbouRizk(營建模擬)與 Purdue University 的 Makarand Hastak 教授(風險管理)。過去研讀論文就見識過這些學者的作品, 這次親睹大師風采,更是印象深刻。
我的演講被安排在 29 日下午 S20 Construction Planning 的場次中,確切時間是 15:55 到16:10,此次發表的論文題目是EMPIRICAL ASSOCIATIONS BETWEEN INTELLECTUAL
CAPITAL AND PERFORMANCE OF ARCHITECTURE FIRMS,論文描述了國科會計畫
(97-2221-E-151-058-)的研究成果。本研究透過敘述統計與徑路分析等統計方法,藉以了 解業界於內部組織智慧資本保存與管理情形,並分析探討智慧資本三大構面與企業績效 間之關聯性,希冀能有效增加國內營建產業之競爭力。研究發現:(1)國內營建公司內部 組織智慧資本管理情形,以「關係資本」表現較佳,而「人力資本」與「結構資本」表 現較差。其中又以「員工教育訓練」與「企業整體流程」細部構面之表現最差,故應視 為加強改善的重點;(2)人力資本會直接顯著影響結構資本與關係資本,並透過結構資 本、關係資本間接影響企業經營績效。
在演講後多位與會者也針對本論文的理念提出了問題與我討論,以下為 29 日簡報時 之照片。
二、會議心得 此次會議收穫豐富,希望兩年後再參加後年在雪梨舉辦的 ICCEM-ICCPM2011 會議, 本次濟州之旅除了會議之外,也利用開會前後之空閒時間,拜訪當地的名勝,如天帝淵 瀑布、萬丈窟石窟等,除了著名的文化遺產及優美的風景外,更感受到韓國人對於文化 的重視及其人文之美,並且對於韓國人致力於觀光所表現出之整潔、規律與秩序,留下 深刻的印象,尤其是韓國人的愛用國貨的愛國心,真是令人感動。 二、 考察參觀活動(無是項活動者省略) 無 三、 建議 在H1N1 的陰影籠罩下,原本一再考慮是否前往,但該會仍吸引如此多的學者參與 本次會議,足見主辦單位的用心。除了論文的評選是採取高標準進行,使得本次發表的 論文水準提高外,發表的優良論文將收編在SCI的期刊中,另外此次會議會場在氣候適 宜且風光明媚的濟州島,在學術與觀光的結合下,雖然來我國辦理國際研討會時,應可 考慮結合台灣的觀光能量。此次會議美中不足的是現場服務工作人員之英文程度還是有 待加強,尤其此次舉辦的是國際研討會,與會的多半不是本國人士,如果服務人員無法 用流利英文進行溝通,對與會者會會造成很大的不便。這是往後舉辦國際研討會值得注 意的。 四、 攜回資料名稱及內容 會議議程、論文發表主題與作者資料,以及會議論文光碟。附上發表文章如附。 五、 其他 再次感謝國科會(計畫編號:NSC 97-2221-E-151-058-)補助本人參加「2009 國際 營建工程與專案管理研討會ICCEM-ICCPM2009」,於會議期間除參加及發表論文 外,亦結識了不少學術界之先進,獲益良多。
EMPIRICAL ASSOCIATIONS BETWEEN INTELLECTUAL CAPITAL AND
PERFORMANCE OF ARCHITECTURE FIRMS
Chung-Fah Huang1 and Li-Ren Yang2
1 Associate Professor, National Kaohsiung Univ. of Applied Sciences, Kaohsiung, Taiwan 2 Associate Professor, Tamkang Univ., Taipei, Taiwan
Correspond to [email protected]
ABSTRACT: Intellectual capital is one of the most valuable assets of any enterprise. This empirical investigation examines the causal relationship between intellectual capital and the performance of architecture firms. More than 100 architecture firms across Taiwan have each been assessed for the levels of human capital, structural capital, relational capital, and business performance. The results suggest that the architecture firms exhibit higher levels of relational capital. However, the firms indicate relatively low levels of human capital. Additionally, the results from the correlation analysis suggest that all the four measures (human capital, structural capital, relational capital, and business performance) are highly correlated. The findings from the path analysis also indicate that human capital may influence the performance of architecture firms via structural capital and relational capital.
Keywords: human capital, structural capital, relational capital, architecture firm, business management
1. INTRODUCTION
With the advent of the knowledge economy, the focus of enterprises has gradually shifted from tangible assets to intellectual capital (Guthrie, 2001). The architecture firms, like firms in many other industries, use professional knowledge and emerging technologies to perform work efficiently. In the
knowledge-intensive industry, one of the most valuable assets is intellectual capital, which is not shown in the balance sheet. Prior research suggested that the most important asset of an enterprise was production equipment in the
twentieth century. However, the most valuable assets of a business were knowledge workers and their productivity in the twenty-first century. Previous research has also shown that business performance may be associated with intangible resources and capabilities. Since knowledge has become the most important element of modern production, it is important to understand how to properly manage the intellectual capital of a company (Stewart, 1999). Even though earlier studies have identified benefits of intellectual capital, however, no comprehensive study has been done on the levels of intellectual capital in architecture firms. In addition, there has been no
industry-wide study on the impacts of intellectual capital on business performance. This lack of information regarding benefits of intellectual capital has resulted in industry reluctance to manage and exploit the intellectual capital. Thus, a study of the relationship
between intellectual capital and business performance is necessary. The main objectives of this research were: 1) to investigate the extent to which intellectual capital are being used in architecture firms and 2) to explore the impact of intellectual capital on the
performance of architecture firms. This paper addresses levels of intellectual capital in architecture firms and associations with business performance. Intellectual capital metrics analyzed include human capital, structural capital, and relational capital. In addition, two subscales (financial performance and operation performance) were used to measure business performance. The data was collected on a total 107 architecture firms in the Taiwanese industry.
2. LITERATURE REVIEW
As our society has moved from the industrial age to the information age, the importance of intellectual capital in business has grown (Sonnier et al., 2007). Since the market value often exceeds book value, intellectual capital has become an important topic in the
contemporary business literature. Many
researchers have been discussing the importance of intangible assets for the success of
organizations. The term “intellectual capital” refers to the summation of all knowledge and capabilities of every employee that brings about performance and creates wealth for the
enterprises. Bontis (1996) believed that
know-how, knowledge, and learning capability of an enterprise cannot be defined by money. In addition, the intellectual capital pertains to the difference between an enterprise’s market value and its existing asset. Roos and Krogh (1997) developed the evaluation standards of
intellectual capital, described various
intellectual capital frameworks and application processes through case studies, and finally proposed a four-phase process mode and an indexing method for intellectual capital. Due to different research backgrounds, there are numerous definitions and classifications of intellectual capital. Based on Bontis (1996), Hubert (1996), and Guthrie and Petty (2000), intellectual capital metrics analyzed in this study include those at the human level, at the structural level, and at the relational level.
Human capital is the most important part of intellectual capital (Stewart, 1999; Dzinkowski, 2000; Hubert, 1996; Edvinsson and Sullivan, 1996; Edvinsson, 1997; Edvinsson, 2000). It refers to knowledge, skill, expertise of
employees and managers, proactive response, and entrepreneurship, but also to company values, culture, and philosophy (Dzinkowski, 2000; Agndal and Nilsson, 2006). Roos and Krogh (1997) argued that human capital is the soul of a company. In order to take full
advantage of human capital, the top management should be well aware of the considerations of staff, provide them with proper training, and work with collective wisdom (Watson, 1996). Grantham and Nichols (1997) also underlined the importance of human capital. They contended that intellectual capital is a value-based activity, both in creation and use. In addition, the content of education needs to be based in four areas: 1) analytical thinking,
2) experimentation, 3) systemic integration, and 4) collaboration. Despite the fact that employees are the most important assets of an enterprise, Edvinsson and Malone (1997) noted that the company cannot own human capital. The enterprise owners should be aware of the principle of resource-sharing. By properly utilizing the knowledge, skill, and capability of employees, a firm can create and sustain a competitive advantage. In summary, the prior research suggested that enterprises must not only teach the employees how to foster their professional skill through analytical thinking, but also tell them the reason why this is important. Additionally, an effective way to increase intellectual capital is to appropriately invest in employees (Stewart, 1999).
Structural capital is defined as the sum of the strategy, structure, systems, and processes that enable an organization to produce and deliver a product to customers (Grantham and Nichols, 1997). It includes the physical systems used to transmit and store intellectual material.
Additionally, it provides the environment to create and share knowledge effectively, shorten learning time, and improve the productivity of human capital. The structural capital of a firm consists of four elements: system, structure, strategy, and culture (Hubert, 1996). With the help of tools such as technology, manufacturing descriptions, operations manuals, and Internet, structural capital can improve the productivity of human capital and help transform human capital into wealth for a firm (Stewart, 1999; Hubert, 1996).
The relational capital refers to the
relationships between enterprises, customers, suppliers and partners (Johnson, 1999), which is a key to long-lasting economic profit and an
essential element for operating a successful business. Major considerations include customer satisfaction, purchase frequency, characteristics of customers, price and quantity of transaction, product quality, and service. In the information-explosion era, it is easy for customers to find suppliers, which changes the balance between buyers and sellers. In such an environment the key to creating profit is to win customer's trust and loyalty and build long-term relationships with them.
The literature review provides background for developing an understanding of the issues related to the use of intellectual capital and the benefits to be derived from intellectual capital. Researchers in a number of disciplines outside of architecture have suggested that intellectual capital is becoming increasingly critical to business success. However, the literature on architecture has largely ignored the impact of intellectual capital on business performance. No industry-wide study has been done on the levels of intellectual capital in architecture firms. In addition, there has been no comprehensive industry-wide study on the impacts of intellectual capital at various levels on the performance of architecture firms. Since little research has explored intellectual capital in the architecture, engineering, and construction (A/E/C) industry, this research adds to the literature in two valuable ways. First, it provides important results on the uses of intellectual capital at various levels. Second, it provides evidence of performance implications of intellectual capital in the A/E/C industry.
3. RESEARCH DESIGN
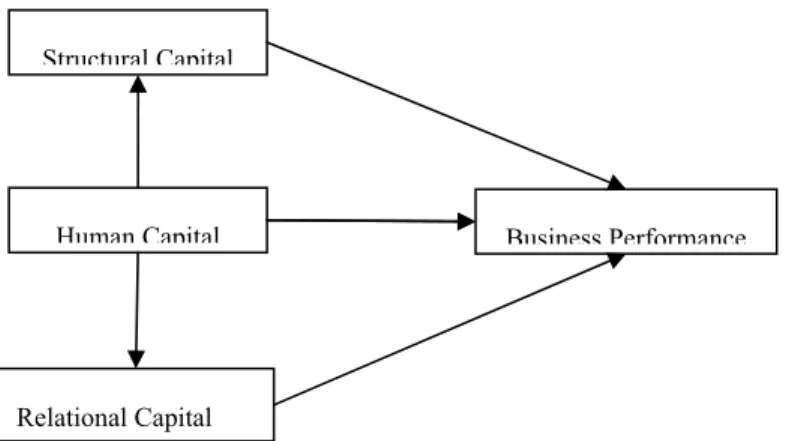
The primary purpose of this study was to explore the impact of intellectual capital on the performance of architecture firms. Intellectual capital metrics analyzed include human capital, structural capital, and relational capital. In addition, financial performance and operation performance were used to measure overall business performance. This research also determines the correlations among the three dimensions of intellectual capital (i.e., human capital, structural capital and relational capital). Stewart (1999) argued that human capital, structural capital, and relational capital are correlated. He stated that intellectual capital management is based on the assumption that value is created through the integration of the three elements. Additionally, the business performance of an enterprise is probably influenced by the interactions among the three dimensions of intellectual capital (Dzinkowski, 2000). Edvinsson and Sullivan (1996) stressed that human capital is a highly influential factor in intellectual capital. Based on the literature review, human capital is believed to be the most crucial factor for intellectual capital.
Furthermore, human capital drives structural capital and relational capital. On the other hand, structural capital and relational capital also contribute to the development of human capital. Based on the aforementioned theories and the framework established by Bontis (1998), the theoretical model for the research is presented in Figure 1.
3.2 Questionnaire Design and Sampling Method
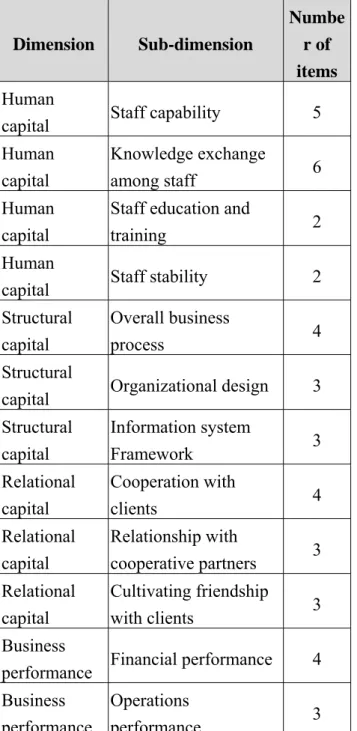
Variables assessed in this research include human capital, structural capital, relational capital, and business performance. There are 4
main dimensions and each dimension is further divided into several sub-dimensions (see Table 1). The items used to measure the constructs were based on the scales developed by Bontis (1996), Bontis (1998), Dzinkowski (2000), Guthrie and Petty (2000), Edvinsson and Sullivan (1996), Edvinsson (1997), Edvinsson (2000), Buren (1999), and Sullivan (2000). Additionally, the data collection tool was developed based on understanding gained from interviews conducted with 5 executives in the industry. Each of the professionals has over 10 years of experience in the field of architecture, engineering and construction. Copies of a draft survey were sent to these industry professions to pre-test the survey. Their insights were
incorporated into the final version of the survey. A 7-point Likert-type scale was used (from 1= strongly disagree to 7= strongly agree) to
measure the degrees of human capital, structural capital, relational capital, and business
performance.
Structural Capital
Human Capital Business Perfor
Relational Capital
mance
Table 1.Distribution of survey items Dimension Sub-dimension Numbe r of items Human
capital Staff capability 5
Human capital Knowledge exchange among staff 6 Human capital
Staff education and
training 2
Human
capital Staff stability 2
Structural capital
Overall business
process 4
Structural
capital Organizational design 3 Structural capital Information system Framework 3 Relational capital Cooperation with clients 4 Relational capital Relationship with cooperative partners 3 Relational capital Cultivating friendship with clients 3 Business
performance Financial performance 4 Business
performance
Operations
performance 3
This research employed a mail survey
methodology for data collection. The sample for this study focuses on architecture firms in the Taiwanese A/E/C industry. The sample was selected from the National Association of Architect, Taiwan. To ensure that respondents are more likely to answer honestly, the survey is anonymous. The survey questionnaire was sent
to 714 senior practitioners. Of the
questionnaires sent, 114 were returned. The overall response rate was 15.97 percent. Among the returned surveys, 7 were discarded since they contained too many missing values. Ultimately, 107 survey responses were used in the analysis. With respect to years in business, 43.0 percent of the companies are less than 10, 38.3 percent are between 10 and 20, and the remaining 18.7 percent are more than 20. These firms averaged 14.3 years in business.
3.3 Analytical Methods
The analysis was divided into three steps. Step 1 consisted of developing descriptive statistics. Included in the descriptive statistics are the means and standard deviations of the computed indices. The purpose of generating the descriptive statistics was to determine the levels of intellectual capital in use. Step 2 entailed investigating the correlations among the three dimensions of intellectual capital and business performance. Additionally, Cronbach’s coefficient (α) was calculated to test the
reliability and internal consistency of the responses. Step 3 involved identifying the cause-effect relationship between the three dimensions of intellectual capital and business performance. Path analysis was employed to verify the theoretical model. Furthermore, the correlation analysis was also used to check linear relationship between the variables, which constituted the basic assumptions of path analysis (Brown et al., 2007).
4.RESEARCH FINDINGS
4.1 Levels of Intellectual Capital and Business Performance
Intellectual capital metrics analyzed include those at the human level (human capital), the structural level (structural capital), and the relational level (relational capital). These
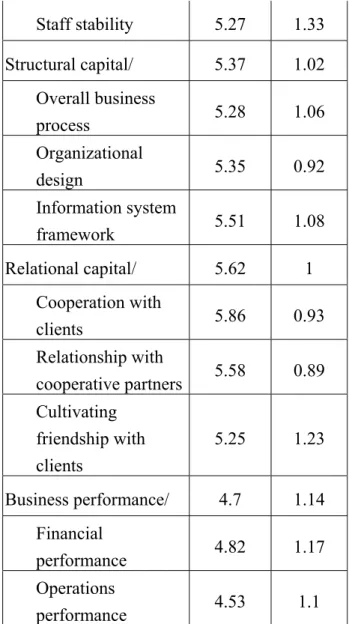
indices were developed for measuring the use of intellectual capital in the architecture firms. Table 2 shows Capital Index and Performance Index descriptive statistics. The results suggest that the architecture firms exhibit the highest levels of relational capital.
However, these firms indicate the lowest levels of human capital. Among the sub-dimensions of relational capital, the highest level is associated with “cooperation with clients” and the lowest level pertains to “cultivating friendship with clients.” Of the sub-dimensions of human capital, the highest level is associated with “staff capacity” and the lowest level pertains to “staff education and training.” Additionally, among the sub-dimensions of structural capital, the highest level is associated with “information system framework” and the lowest level
pertains to “overall business process.
Table 2.Capital index and performance index descriptive statistics Dimension/ sub-dimension Mean Standard deviation Human capital/ 5.31 1.14 Staff capability 5.65 1.01 Knowledge exchange among staff 5.29 1.17 Staff education and
training 4.54 1.23 Staff stability 5.27 1.33 Structural capital/ 5.37 1.02 Overall business process 5.28 1.06 Organizational design 5.35 0.92 Information system framework 5.51 1.08 Relational capital/ 5.62 1 Cooperation with clients 5.86 0.93 Relationship with cooperative partners 5.58 0.89 Cultivating friendship with clients 5.25 1.23 Business performance/ 4.7 1.14 Financial performance 4.82 1.17 Operations performance 4.53 1.1
” The specific business performance measures are also detailed in Table 2. Respondents indicate higher levels of success in the area of operations performance. They report lower levels of success in financial performance. 4.2 Correlation Analysis
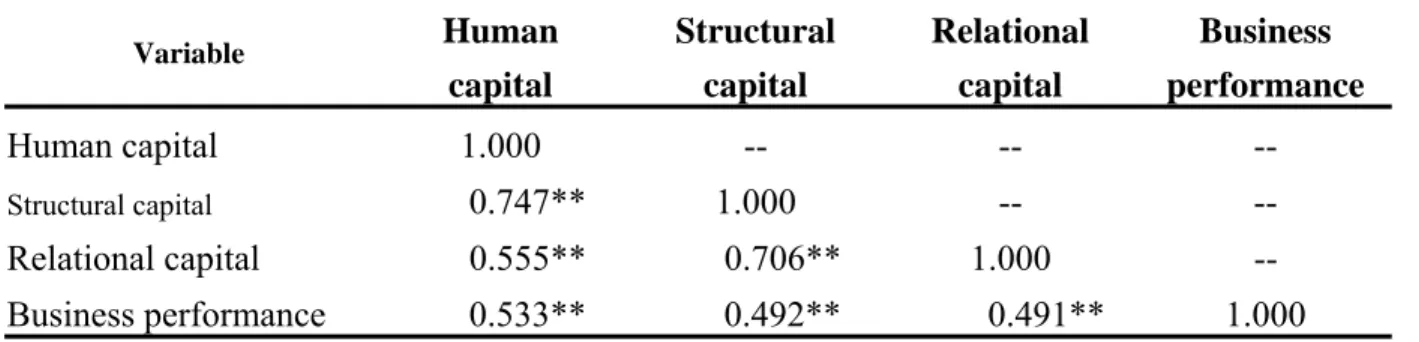
The data analysis also entailed investigating the correlations among the three dimensions of intellectual capital and business performance. Correlation measures the strength and the direction of the relationship between the variables. Additionally, Cronbach’s coefficient (α) was calculated to test the reliability and internal consistency of the responses. The
results of the correlation analysis for the main dimensions are presented in Table 3. There are positive correlations between the three
dimensions of intellectual capital and business performance. The empirical results indicate that human capital exhibits the highest correlation coefficient with business performance. On the other hand, there are also positive correlations among the three dimensions of intellectual capital; moreover, all coefficients exceed 0.5. The correlation between human capital and structural capital is relatively high. The results from the analysis suggest that all the four measures (human capital, structural capital, relational capital, and business performance) are highly correlated. Furthermore, using
Cronbach’s coefficient alpha, reliability was assessed for human capital at 0.894, structural capital at 0.881, relational capital at 0.879, and business performance at 0.906, which indicate a high degree of internal consistency in the
responses. The results of the correlation analysis for the sub-dimensions are presented in Table 4. There are positive correlations among most of the sub-dimensions. Among the sub-dimensions, there appears to be stronger positive
correlations between the following pairs of variables: 1) “knowledge exchange among staff” and “information system framework”, 2) “knowledge exchange among staff” and
“overall business process”, 3) “overall business
process” and “information system framework”, and 4) “financial performance” and “operations performance.”
4.3 Path Analysis
Path analysis was conducted to identify a causal pattern of the variables in the theoretical model. The analysis is an extension of the regression model. In this study, it consists of two parts. In the first part, the causal effects of intellectual capital on business performance were estimated. In the second part, the interactions among human capital, structural capital and relational capital were determined. First part: BP = β1 SC +β2 HC +β3 RC + ε (1) Second part: SC = β1 HC + ε (2) RC = β1 HC + ε (3) where: BP = business performance; SC = structural capital; HC = human capital; RC = relational capital; and ε is the error term.
Table 3 Correlation between the main dimensions Variable Human capital Structural capital Relational capital Business performance Human capital 1.000 -- -- -- Structural capital 0.747** 1.000 -- -- Relational capital 0.555** 0.706** 1.000 -- Business performance 0.533** 0.492** 0.491** 1.000
*significant at the 0.05 level; **significant at the 0.01 level
Table 4 Correlation between the sub-dimensions
Variable A B C D E F G H I J K L
A. Staff capability 1 -- -- -- -- -- -- -- -- -- -- --
B. Knowledge exchange
among staff 0.55** 1 -- -- -- -- -- -- -- -- -- --
C. Staff education and
training 0.22* 0.59** 1 -- -- -- -- -- -- -- -- --
D. Staff stability 0.32** 0.62** 0.57** 1 -- -- -- -- -- -- -- --
E. Overall business process 0.36** 0.69** 0.57** 0.51** 1 -- -- -- -- -- -- -- F. Organizational design 0.41** 0.46** 0.42** 0.38** 0.62** 1 -- -- -- -- -- -- G. Information system
framework 0.40** 0.75** 0.54** 0.55** 0.67** 0.53** 1 -- -- -- -- --
H. Cooperation with clients 0.35** 0.43** 0.34** 0.36** 0.55** 0.58* 0.45** 1 -- -- -- -- I. Relationship with
cooperative partners 0.33** 0.55** 0.41** 0.39** 0.54** 0.51** 0.60** 0.59** 1 -- -- -- J. Cultivating friendship with
clients 0.19 0.33** 0.35** 0.27** 0.44** 0.48** 0.33** 0.45** 0.55** 1 -- -- K. Financial performance 0.45** 0.36** 0.40** 0.32** 0.34** 0.30** 0.45** 0.33** 0.27** 0.33** 1 -- L. Operations performance 0.32** 0.30** 0.48** 0.48** 0.37** 0.35* 0.35** 0.41** 0.31** 0.47** 0.66** 1
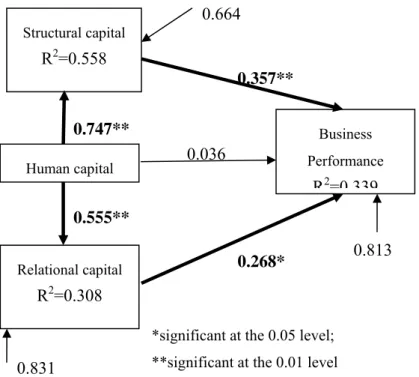
Path coefficients for the model of are reported on the path diagram shown in Figure 2. The results indicate that business performance increases by 0.357 standard units for each 1 standard unit increase in structural capital, which suggests that higher levels of structural capital may contribute to the success of architecture firms. These analyses also reveal that increased levels of relational capital are associated with improvement in the performance of architecture firms. As previous research highlighted the role of human capital in the development of intellectual capital (Roos and Krogh, 1997; Stewart, 1999; Grantham and Nichols, 1997), the remaining causal paths suggest that increases in human capital tend to improve the degrees of structural capital and relational capital for architecture firms. In addition to the aforementioned cause-effect relationship, the findings also indicate that human capital may influence the
performance of architecture firms via structural capital and relational capital.
5. CONCLUSIONS
The primary purpose of this study was to examine the causal relationship between intellectual capital and business performance. The second objective in this research was to investigate the extent to which intellectual capital are being used in
architecture firms. These were accomplished by an industry-wide survey and analysis of 107 architecture firms. Descriptive statistics were developed to determine levels of human capital, structural capital, relational capital, and business performance. This research also determines the correlations among the three dimensions of intellectual capital (i.e., human capital, structural capital and relational capital) and business performance. Additionally, path analysis was conducted to identify a causal pattern of the variables in the theoretical model.
Human capital Structural capital R2=0.558 Relational capital R2=0.308 Business Performance R2=0 339 0.036 0.357** 0.268* 0.747** 0.813 0.555** 0.831
*significant at the 0.05 level; **significant at the 0.01 level
0.664
Figure 2. Path diagram
Results from the analyses suggest that the architecture firms exhibit the highest levels of relational capital. However, these firms indicate the lowest levels of human capital. This suggests that attention should be paid to human resource management in architecture firms. The data analysis also entailed investigating the correlations among the three dimensions of intellectual capital and business performance. For architecture firms, there are positive correlations between the three dimensions of intellectual capital and business performance. The empirical results indicate that human capital exhibits the highest correlation coefficient with business performance. In summary, the results from the analysis suggest that all the four measures (human capital, structural capital, relational capital, and business performance) are highly correlated. Additionally, there are positive correlations among most of the
sub-dimensions.
Correlation only measures the strength and the direction of the relationship between the variables. Thus, path analysis was conducted to identify a causal pattern of the variables in the theoretical model. In this study, it consists of two parts. In the first part, the causal effects of intellectual capital on business performance were estimated. In the second part, the interactions among human capital, structural capital, and relational capital were determined. The findings from the path analysis indicate that 6 paths in the model of general contracting firms are significant: 1) structural capital Æ business performance, 2) relational capital Æ business performance, 3) human
capitalÆstructural capital, 4) human capitalÆrelational capital, 5) human capitalÆ structural capital Æ business performance, and 6) human capitalÆrelational capitalÆ business performance. The results also suggest that human capital may influence the performance of architecture firms via structural capital and relational capital.
In summary, as prior research highlighted the role of human capital in the
development of intellectual capital, the causal paths suggest that increases in human capital tend to improve the degrees of structural capital and relational capital for architecture firms. The results of the analyses are consistent with previous theories, which suggest that an effective way to increase intellectual capital is to appropriately invest in employees. Thus, consideration should be given to human resource
management such as staff education and training, staff capability, and knowledge exchange among staff. This research provides empirical evidence that supports the expectation of gaining significant benefits with higher levels of intellectual capital. The results of this study indicate that intellectual capital is critical to the performance of architecture firms. Findings from this study provide direction for the decision making of investment in intellectual capital.
REFERENCES
[1] Agndal, H. and Nilsson, U. (2006) Generation of human and structural capital: lessons from knowledge management. The Electronic Journal of Knowledge Management, 4(2), 91–98.
[2] Bontis, N. (1996) There’s a price on your head: managing intellectual capital strategically. Ivey Business Quarterly, 60(4), 40-47.
[3] Bontis, N. (1998) Intellectual capital: an exploratory study that develops measures and models. Management Decision, 36(2), 63-76.
[4] Brown, A.W., Adams, J.D. and Amjad, A.A. (2007) The relationship between human capital and time performance in project management: a path analysis. International Journal of Project Management, 25(1), 77-89.
[5] Buren, M.E.V. (1999) A yardstick for knowledge management. Training & Development, 53(5), 71-78.
[6] Dzinkowski, R. (2000) The value of intellectual capital. The Journal of Business Strategy, 21(4), 3-4.
[7] Edvinsson, L. (1997) Developing intellectual capital at Skandia. Long Range Planning, 30(3), 366-373.
[8] Edvinsson, L. (2000) Some perspectives on intangibles and intellectual capital. Journal of Intellectual Capital, 1(1), 12-16.
[9] Edvinsson, L. and Malone, M.S. (1997) Intellectual Capital, Harper Collins Publishers, New York, NY.
[10] Edvinsson, L. and Sullivan, P. (1996) Developing a model for managing intellectual capital. European Management Journal, 14(4), 356-364.
[11] Grantham, C.E. and Nichols, L.D.A. (1997) Framework for the management of intellectual capital in the health care industry. Journal of Health Care Finance, 23(3), 1-19.
[12] Guthrie, J. (2001) The management, measurement and the reporting of intellectual capital. Journal of Intellectual Capital, 2(1), 27-41.
[13] Guthrie, J. and Petty, R. (2000) Intellectual capital: Australian annual reporting practices. Journal of Intellectual Capital, 1(3), 241-251.
[14] Hubert, S.O. (1996) Tacit knowledge: the key to the strategic alignment of intellectual capital. Strategy & Leadership, 24(2), 10-14.
[15] Johnson, W.H.A. (1999) An integrative taxonomy of intellectual capital measuring the stock and flow of intellectual capital components in the firm. International Journal of Technology Management, 18(5/6/7/8), 562-575. [16] Roos, J. and Krogh, G. (1997) The epistemological challenge: managing knowledge and intellectual capital. European Management Journal, 14(4), 333-337. [17] Sonnier, B.M., Carson, K.D. and Carson, P.P. (2007) Accounting for intellectual capital: the relationship between profitability and disclosure. The Journal of Applied Management and Entrepreneurship, 12(2), 3–14.
[18] Stewart, T.A. (1999) Intellectual Capital: The New Wealth of Organizations, Doubleday-Currency, New York, NY.
[19] Sullivan, P.H. (2000) Value-Driven Intellectual Capital: How to Convert
Intangible Corporate Assets into Market Value, John Wiley & Sons, New York, NY. [20] Watson, J. (1996) Managing intellectual capital: making the most of the best. The