成本不對稱寡占模型下之外資持有、市場進入與租稅對消費者福祉影響之探究
52
0
0
全文
(2) 致謝 2010 年 8 月進入高雄大學應用經濟系攻讀碩士,轉眼間,兩年已經過去了。 對於這兩年的學習,縱使遭遇到許多挫折與挑戰,我依然盡力去完成,因此沒有 留下任何遺憾。 感謝我的指導老師 王鳳生教授對我的諄諄教誨,在生活上教導我許多做人 處事應有的態度,課堂學習中,也給我這位不才的學生許多機會;在論文上提供 許多想法讓我找出自己感興趣的主題,並透過老師耐心的指導,使我順利完成碩 士論文。還有辛苦的口試委員 楊雅博老師、李仁耀老師給予我論文上寶貴的建 議,使我的論文更加嚴謹。另外,也感謝佳志、濬豪、育維、嘉玲及文婷等幾位 碩班的同學們,每當我遇到困難時,是你們伸出援手,讓我在課業上可以全力衝 刺,完成學位。最後,感謝珮瑜姐與姿宇姐幫我處理許多繁雜的事務。 謝謝彥儒學長在課業上的提醒和哲維學長的鼓勵,以及詩婷、君婷、傳升等 學弟妹課業上的幫忙。謝謝關心我的同學與朋友,在你們的幫助之下,我順利畢 業了。 當然,最感謝的是父母與家人的栽培和支持,沒有你們的鼓勵,我就不會有 今日的成就。. 陳俊儫 謹誌於 國立高雄大學 中華民國 一百零一年 仲夏. I.
(3) 成本不對稱寡占模型下之外資持有、市場進入與租稅 對消費者福祉影響之探究. 指導教授:王鳳生 博士 國立高雄大學應用經濟系. 學生:陳俊儫 國立高雄大學應用經濟系. 摘要. 傳統經濟理論認為,當市場上競爭的廠商愈多,消費者福祉將會為之上升。 Dinda 與 Mukherjee (2011) 證明存在成本差異 Cournot 競爭模型及政府在社會福 利極大下課徵從量稅時,競爭廠商數增加會導致消費者福祉下降。這樣的結論對 政府競爭政策之制定與執行提出質疑。在本論文中,我們將分別討論在不同的市 場結構及外資是否進入本國市場進行模型分析,並提出市場進出競爭政策之規 範。 首先,本論文之第二章在 Stackelberg 競爭且成本不對稱之模型下,容許無 效率廠商透過開放外資持股,降低生產成本以增加其在市場上的競爭力。我們證 II.
(4) 明無效率廠商之進入,依然可改善消費者福祉與社會福祉,並支持傳統的論述。 另外,我們發現在廠商沒有進入成本之社會福祉必然高於有進入成本之社會福 祉。 其次,在本論文第三章我們同樣於 Stackelberg 競爭模型中,假設所有廠商 皆存在進入成本。一般而言,領導廠商的產出水準是大於追隨廠商的產出水準。 透過政府開放外資的政策,追隨廠商競爭力提升來與領導廠商進行市場競爭,總 產量也可能因此增加,進而提高消費者福祉。我們發現存在有一最適外資持股比 例,消費者福祉將會高於未開放外資之消費者福祉;然而,社會福祉必須於追隨 廠商數足夠多時,才可能高於未開放外資之社會福祉。 最後,在本論文第四章利用成本不對稱之 Cournot 模型且政府決定最適稅率 政策的情況下,無效率廠商之進入,依然可改變消費者福祉與社會福祉。接著我 們就開放外資與未開放外資進行社會福祉比較,發現未開放外資之社會福祉優於 開放外資之社會福祉。. 關鍵字:Stackelberg 競爭、成本不對稱、租稅政策、消費者福祉、外資持有. III.
(5) Foreign Ownership, Market Entry, Taxation and Consumer Welfare in Oligopoly with Cost Asymmetry. Advisor: Dr. Leonard F.S. Wang Department of Applied Economics National University of Kaohsiung. Student: CHEN, CHUN-HAO Department of Applied Economics National University of Kaohsiung. ABSTRACT. It is generally believed that higher competition benefits consumers. In Dinda and Mukherjee (2011), the welfare maximizing tax rate in equilibrium is negative under Cournot Competition, and an increase in the number of less-efficient firms will lead to an adverse effect on consumer surplus. This thesis cast doubt on the robustness of their result under different market structure and foreign ownership. Firstly, in chapter two the case of no entry cost is introduced as a benchmark, and we examine the case of endogenous entry with foreign ownership under Stackelberg competition. In particular, we show that an increase in the number of cost inefficient firms makes the consumers better-off in the presence of foreign ownership at free entry. Secondly, in chapter three we first consider the case of fully restriction of foreign IV.
(6) ownership as a benchmark, and then allow the government to determine the foreign ownership ratio. Assuming that the production cost of firm i decreases with a higher foreign ownership shares held by foreign owner and that will improve the efficiency, the consumer surplus will be increased associating with the entry of follower firms under Stackelberg competition in the presence of a welfare-maximizing foreign ownership policy. Finally, in chapter four we consider that foreign ownership improves the cost of inefficient firms and how would it affect the consumer surplus and social welfare in an oligopolistic framework. We find that the consumer surplus and social welfare are increased associating with the entry of cost inefficient firms under Cournot competition in the presence of a welfare maximizing tax/subsidy policy.. Keywords: Stackelberg Competition; Cost Asymmetry, Tax/Subsidy Policy, Consumer Welfare, Foreign Ownership. V.
(7) CONTENTS CHAPTER ONE: INTRODUCTION 1.1 Research Background……………………………………...………………………1 1.2 Literature Review………………………….…………………..…………………..1. CHAPTER TWO: Foreign Ownership and Stackelberg Competition 2.1 The Basic Model…..………….………….....…………………..…………………4 2.2 The Case of No Entry Cost………………....………...…………..……………….5 2.3 The Case of Free Entry…………..……………………...………….….…………..9 2.4 Conclusion……………..…………………...……………….……………………13. CHAPTER THREE: Optimal Foreign Ownership in Stackelberg Competition at Free Entry 3.1 The Basic Mode…………….……………..………..…………………………….14 3.2 Benchmark……………….……….……………………….……………………..15 3.3 Foreign Ownership……...………………………....……………………………..17 3.3.1 Equilibrium Outcome……………...…...………………………………………18 3.3.2 Optimal Level of Foreign Ownership…………….……………………………19 3.4 Conclusion……………………………………………...….……………………..24. CHAPTER FOUR: Tax, Foreign Ownership and Market Entry 4.1 The Basic Mode.…………………………………………………….……………25 4.2 No Foreign Ownership……………………...………..………………..…………26 4.2.1 Equilibrium Outcome……...……………………………….………..…………26 4.2.2 Optimal Tax Rate………..………….…………………………….……….……27 4.3 Foreign Ownership………....……...……….……………………………….……29 4.3.1 Equilibrium Outcome……...…….……...….…….……………………….……29 VI.
(8) 4.3.2 Optimal Level of Tax Rate…….……...………….………………………….…30 4.4 Conclusion……….………………………….…………….……….........…….….35. CHAPTER FIVE: CONCLUSIONS APPENDIX REFERENCES. VII.
(9) CHAPTER ONE: INTRODUCTION 1.1 Research Background Consumer surplus have been analyzed in recent years. It is generally believed that higher competition benefits consumers. However, Dinda and Mukherjee (2011) show that this may not be the case in an industry with asymmetric cost firms. A rise in the number of more cost inefficient firms makes the consumers worse-off in the presence of a welfare maximizing tax/subsidy policy. Therefore, we investigate the relationship between asymmetric cost and consumer surplus. In the case of foreign ownership, a foreign firm could entry into other country's market by purchasing equity share of local domestic firm so that to be foreign stockholder. With an increase in the phenomenon of multinational enterprises, governments have imposed market-opening policies, set the level of foreign ownership. In order to enhance the competitive power of domestic industry, government tries to open economy to attract foreign entry. It may reduce of the production cost of inefficient firms. With the government impose tax/subsidy policy and entry regulation of the open economy. While the government choose to foreign ownership ratio or tax/subsidy rate, on the other hand the implementation of entry regulation policies. However, in an open economy, the impact of the profit transposition effect on the inefficient firms that decrease the social welfare. It has become the focus of much attention and debate. How the government to strike a balance between market competition and social welfare, it’s become an important issue.. 1.2 Literature Review The seminal paper by Mankiw and Whinston (1986) show that entry is socially 1.
(10) excessive in oligopolistic industries with scale economies and no integer constraint, and it holds irrespective of the type of symmetric oligopoly game where the firms chooses their strategic variables simultaneously. However, Mukherjee (2011, forthcoming) considers an industry with a quantity setting leader and free entry of followers, and show that it is socially insufficient in the presence of scale economies if the marginal cost difference between the leader and the followers is large. It is usually believed that higher market competition reduces price and make the consumer’s better-off (Metzenbaum 1993, Hausman and Leibtag 2007). Wang and Mukherjee (2012) show that entry of profit-maximizing firm’s increases profit of the incumbent firm, industry profit and social welfare at the expense of the consumers in mixed oligopoly setting. However, Dinda and Mukherjee (2011) show that considering an industry with asymmetric cost firms and rise in the number of more cost inefficient firms makes the consumers worse-off in the presence of a welfare maximizing tax policy. In both Lahiri and Ono (1988) and Klemperer (1988), higher competition, either due to lower marginal cost or due to entry of a firm, always makes the consumers better off. In contrast, if the number of more cost inefficient firms increases in our analysis, it makes the consumers better-off. In their paper, they ignored the foreign ownership policy between inefficient firms and efficient firms in their setting. However, Cato and Matsumura (2011) investigate how foreign penetration in the domestic market affects the privatization policy. They investigate the relationship between foreign penetration and domestic welfare. In the short-run, even if the government adjusts the degree of privatization to maximize domestic welfare, the achieved domestic welfare is affected by foreign penetration. If there are market leaders or dominant firms, it is customary to consider Stackelberg competition with the first-mover advantage enjoyed by the market leaders, 2.
(11) instead of a simultaneous game (Martin, 2001). Hence, the previous papers analyzing social efficiency of entry may not be appropriate in the presence of market leaders. Mukherjee and Zhao (2009) show that if the incumbents differ in marginal costs and the entrants behave like Stackelberg followers, entry may benefit the incumbents who are relatively cost efficient while it always hurts the cost inefficient incumbents.. 3.
(12) CHAPTER TWO: Foreign Ownership and Stackelberg Competition In Mukherjee (2011, forthcoming), they consider an industry with a quantity setting leader and free entry of followers, and show that it is socially insufficient in the presence of scale economies if the marginal cost difference between the leader and the followers is large. In this chapter, we first briefly discuss the case of no entry cost as a benchmark, and then examine the case of entry in the presence of asymmetric cost. In section 2.1, introduces our basic model and section 2.2 consider the foreign ownership ratio into the followers under Stackelberg competition that is inexistence entry cost. In section 2.3, we consider foreign ownership ratio into the followers under Stackelberg competition at free entry. Section 2.4 concludes this chapter.. 2.1 The Basic Model We assume that the inverse market demand function is 𝑃 = 𝑎 − 𝑄, where P is price and 𝑄 = 𝑞𝑙 + ∑𝑛𝑖=1 𝑞𝑖 ; 𝑞𝑖 is the quantities produced by firms i=1, 2,…, n, respectively. Consider a firm, called leader, which has invented a technology for a product, and can produce the product at the marginal cost c, which is assumed to be zero for simplicity. The leader enters the industry by incurring a fixed cost. . We. assume that each entrant can produce the product at the marginal cost of production c (>0). Hence, c measures the marginal cost difference between the leader and the entrants, and it may depend on the strength of the patent system and/or the complexity of the technology, which affect the benefit from knowledge spillover. However, if a potential entrant wants to produce the product, it needs to enter the market by 4.
(13) incurring a fixed cost. . If an entrant enters the market, we call it a follower.. We assume a >c competing like Stackelberg competition with a homogeneous product. Suppose that the investment by foreign investors into firm i lead to more efficient production technology relative to firm l. We assume 𝛼 is foreign ownership ratio, where 𝛼 ∈ [0, 1] represents the share of foreign capital ownership in firms i. The former formulation indicates that as the proportion of firm i’s shares held by foreign owner’s increases, the production cost of firm i decreases. Let us consider the following game. At stage 1, the leader enters the market. At stage 2, the entrants decide whether or not to enter the market. If there is no entry at stage 2, the leader produces like a monopolist at stage 3, and the profit is realized. If there is entry at stage 2, the leader behaves like a Stackelberg leader and the followers behave like Stackelberg followers at stage 3, and the profits are realized. We solve the game through backward induction.. 2.2 The Case of No Entry Cost In this section, we consider the nature of foreign ownership with no entry cost. The profit functions for firms l and i are given as 𝑛. 𝜋𝑙 = (𝑎 − 𝑞𝑙 − ∑ 𝑞𝑖 ) 𝑞𝑙 ,. (2.1). 𝑖=1 𝑛. 𝜋𝑖 = (𝑎 − 𝑞𝑙 − ∑ 𝑞𝑖 − (1 − 𝛼)𝑐) 𝑞𝑖 .. (2.2). 𝑖=1. We will assume in the following analysis that: 𝑎 > c (n + 2)(1 − 𝛼) ≡ 𝑎̅.. (2.3). If n followers enter the market, the ith follower, i =1,2,...,n, maximizes the following expression to determine its output: 5.
(14) 𝑛. 𝑚𝑎𝑥 𝜋𝑖 = (𝑎 − 𝑞𝑙 − ∑ 𝑞𝑖 − (1 − 𝛼)𝑐) 𝑞𝑖 . 𝑞𝑖. (2.4). 𝑖=1. Given the output of the leader, 𝑞𝑙 , the equilibrium output of the ith follower is 𝑞𝑖 =. 𝑎 − 𝑞𝑙 − (1 − 𝛼)𝑐 . (𝑛 + 1). (2.5). The Stackelberg leader maximizes the following expression to determine its output: 𝑎 − 𝑞𝑙 − (1 − 𝛼)𝑐 𝑚𝑎𝑥 𝜋𝑙 = [𝑎 − 𝑞𝑙 − 𝑛 ( )] 𝑞𝑙 . 𝑞𝑙 (𝑛 + 1). (2.6). The equilibrium output of the leader can be found as 𝑞𝑙 =. 𝑎 + 𝑐𝑛(1 − 𝛼) , 2. (2.7). where the superscript n denotes the values under no entry cost. Using (2.7), we get the equilibrium output of the ith follower, i =1,2,...,n, as 𝑞𝑖 =. 𝑎 − 𝑐(𝑛 + 2)(1 − 𝛼) . 2(𝑛 + 1). (2.8). The total output and price of the product are 𝑄=. 𝑎(1 + 2𝑛) − 𝑐𝑛(1 − 𝛼) , 2(𝑛 + 1) (2.9). 𝑎 + 𝑐𝑛(1 − 𝛼) 𝑃= . 2(1 + 𝑛) The net equilibrium profits of the leader and the ith follower, i =1,2,...,n, are Respectively 𝜋𝑙 =. [𝑎 + 𝑐𝑛(1 − 𝛼)] , 4(1 + 𝑛) (2.10). [𝑎 − 𝑐(2 + 𝑛)(1 − 𝛼)] 𝜋𝑖 = . 4(1 + 𝑛) The social planner determines the number of followers to maximize welfare, 6.
(15) which is the sum of “the total net profits of the leader and the followers, and consumer surplus”. To see this, we consider the short-run equilibrium welfare given by 𝑛. 𝑆𝑊 = 𝜋𝑙 + (1 − 𝛼) ∑ 𝜋𝑖 + 𝐶𝑆.. (2.11). 𝑖=1. We consider how an increase in the number of firm i affects the equilibrium outcomes. We find that 𝜕𝑆𝑊 𝛷1 = > 0, 𝜕𝑛 4(1 + 𝑛)3 (2.12). 𝜕𝑆𝑊 −𝑛 𝛷 = < 0, 𝜕𝛼 4(1 + 𝑛). where 𝛷1 ≡ 𝑎[𝑎(1 − 𝛼 + 𝑛𝛼) − 𝑐(3 + 𝑛 − 4𝛼)(1 − 𝛼)] + 𝑐 (1 − 𝛼) [4(1 − 𝛼) + 𝑛(7 + 6𝑛 + 2𝑛 − 4𝛼 − 3𝑛𝛼 − 𝑛 𝛼)] > 0 and 𝛷 ≡ 𝑎(𝑎𝑛 − 𝑐(8𝑛 + 4𝑛 − 1 − 8𝑛𝛼 − 4𝑛 𝛼)) + 𝑐 𝑛(1 − 𝛼)(15 + 14𝑛 + 3𝑛 − 3(2 + 𝑛) 𝛼).. Comparative statics results yield 𝜕𝐶𝑆 [𝑎 − 𝑐(1 − 𝛼)][𝑎(1 + 2𝑛) − 𝑐𝑛(1 − 𝛼)] = > 0, 𝜕𝑛 4(1 + 𝑛)3 𝜕𝐶𝑆 𝑐𝑛[𝑎 + 2𝑎𝑛 − 𝑐𝑛(1 − 𝛼)] = > 0, 𝜕𝛼 4(1 + 𝑛). (2.13). [𝑎 + 𝑐𝑛(1 − 𝛼)][𝑎 − 𝑐(2 + 𝑛)(1 − 𝛼)] 𝜕𝜋𝑙 =− < 0, 𝜕𝑛 4(1 + 𝑛) (2.14). 𝜕𝜋𝑙 𝑐𝑛[𝑎 + 𝑐𝑛(1 − 𝛼)] =− < 0, 𝜕𝛼 2(1 + 𝑛) [𝑎 − 𝑐(1 − 𝛼)][𝑎 − 𝑐(2 + 𝑛)(1 − 𝛼)] 𝜕𝜋𝑖 =− < 0, 𝜕𝑛 2(1 + 𝑛)3. 7.
(16) 𝜕𝜋𝑖 𝑐(2 + 𝑛)[𝑎 − 𝑐(2 + 𝑛)(1 − 𝛼)] = > 0, 𝜕𝛼 2(1 + 𝑛). 𝜕𝑄 𝑎 − 𝑐(1 − 𝛼) = > 0, 𝜕𝑛 2(1 + 𝑛) (2.15). 𝜕𝑄 𝑐𝑛 = > 0, 𝜕𝛼 2(1 + 𝑛) 𝜕𝑄 −𝑛(1 − 𝛼) = < 0, 𝜕𝑐 2(1 + 𝑛) We can summarize these results in the following proposition.. Proposition 1: Under Stackelberg competition without entry cost, the entry of inefficient firms increases the total output and consumer surplus. Proof: (1𝑎) We can get. 𝜕𝑄 𝜕𝑄 > 0 and < 0. 𝜕𝑛 𝜕𝑐. (1𝑏) We can get. 𝜕𝐶𝑆 > 0. 𝜕𝑛. We have done the above analysis for a homogeneous product. However, it is intuitive that if the products of the firms are differentiated, more firms, irrespective of their types, create a positive effect on the consumers by increasing the number of varieties. Hence, the variety effect tends to reduce the negative effect of a rise in the number of more cost inefficient firms. Therefore, a rise in the number of more cost inefficient firms makes the consumers better-off if the products are not very much differentiated so that the efficiency due to the cost asymmetry dominates the effect of product differentiation.. 8.
(17) Proposition 2: Consider the situation, increase foreign ownership ratio, which is able to decrease in welfare. However, increase foreign ownership ratio, which is increasing the consumer surplus. Proof: (2a) We get that. 𝜕𝑆𝑊 < 0. 𝜕𝛼. (2b) We get that. 𝜕𝜋𝑙 < 0. 𝜕𝛼. (2c) We get that. 𝜕𝜋𝑖 > 0. 𝜕𝛼. (2d) We get that. 𝜕𝐶𝑆 > 0. 𝜕𝛼. The reason for our result, which is Proposition 2 (2b), is as follows. We have seen that, for inexistence of entry cost, an increase in foreign ownership ratio decreases social welfare. We find that the reason of create a negative effect on the leader by increase the foreign ownership ratio. Even though, an increase in foreign ownership ratio increases consumer surplus and the profit of followers increase. However, foreign ownership cannot offset consumer surplus increasing and the profit of followers increasing against the profit of leader reducing.. 2.3 The Case of Free Entry In this section, we consider the nature of foreign ownership when the free entry. The profit functions for firms l and i are given as 𝑛. 𝜋𝑙 = (𝑎 − 𝑞𝑙 − ∑ 𝑞𝑖 ) 𝑞𝑙 ,. (2.16). 𝑖=1. 9.
(18) 𝑛. 𝜋𝑖 = (𝑎 − 𝑞𝑙 − ∑ 𝑞𝑖 − (1 − 𝛼)𝑐) 𝑞𝑖 .. (2.17). 𝑖=1. We will assume in the following analysis that: 𝑎>. 𝑐(5 + 3𝑛)(1 − 𝛼) ≡ 𝑎̅. (2 + 𝑛). (2.18). If n followers enter the market, the ith follower, i =1,2,...,n, maximizes the following expression to determine its output: 𝑛. 𝑚𝑎𝑥 𝜋𝑖 = (𝑎 − 𝑞𝑙 − ∑ 𝑞𝑖 − (1 − 𝛼)𝑐) 𝑞𝑖 . 𝑞𝑖. (2.19). 𝑖=1. Given the output of the leader, 𝑞𝑙 , the equilibrium output of the ith follower is 𝑞𝑖 =. 𝑎 − 𝑞𝑙 − (1 − 𝛼)𝑐 . (𝑛 + 1). (2.20). The Stackelberg leader maximizes the following expression to determine its output: 𝑎 − 𝑞𝑙 − (1 − 𝛼)𝑐 𝑚𝑎𝑥 𝜋𝑙 = [𝑎 − 𝑞𝑙 − 𝑛 ( )] 𝑞𝑙 . 𝑞𝑙 (𝑛 + 1). (2.21). The equilibrium output of the leader can be found as 𝑓. 𝑞𝑙 =. 𝑎 + 𝑐𝑛(1 − 𝛼) . 2. (2.22). where the superscript f denotes the values under the case of free entry. Using (2.22), we get the equilibrium output of the ith follower, i =1,2,...,n, as 𝑓. 𝑞𝑖 =. 𝑎 − 𝑐(𝑛 + 2)(1 − 𝛼) . 2(𝑛 + 1). (2.23). The total output and price of the product are 𝑄𝑓 =. 𝑎(1 + 2𝑛) − 𝑐𝑛(1 − 𝛼) , 2(𝑛 + 1) (2.24). 𝑎 + 𝑐𝑛(1 − 𝛼) 𝑃𝑓 = . 2(1 + 𝑛) 10.
(19) The net equilibrium profits of the leader and the ith follower, i =1,2,...,n, are Respectively 𝑓. 𝜋𝑙 =. (𝑎 + 𝑐𝑛(1 − 𝛼)) − 4(1 + 𝑛). , (2.25). (𝑎 − 𝑐(2 + 𝑛)(1 − 𝛼)) 𝑓 𝜋𝑖 = − 4(1 + 𝑛). .. Hence, the zero-profit condition in the free entry equilibrium implies that the equilibrium number of firms under Stackelberg competition satisfies 𝑓. 𝜋𝑖 = 0 or. (𝑎 − 𝑐(2 + 𝑛)(1 − 𝛼)) = 4(1 + 𝑛). .. (2.26). Postulating that all i firms’ profits are driven to zero, we attempt to explore the long-run equilibrium wherein free entry and exit prevail; that is, the number of follower firms n is endogenously determined. To illustrate how the endogenous variables are determined, we set Eq. (2.26) to zero for long-run equilibrium and the endogenous number of domestic firms is derived as 𝑛 =. (. 𝑓) 𝑓. .. The social planner determines the number of followers to maximize welfare, which is the sum of “the total net profits of the leader and the followers, and consumer surplus”, 𝑆𝑊 𝑓 =. (𝑎 − 𝑐(2 + 𝑛)(1 − 𝛼)) (𝑎 + 𝑐𝑛(1 − 𝛼)) + (1 − 𝛼)𝑛 ( ) 4(1 + 𝑛) 4(1 + 𝑛) + 𝐶𝑆 − (𝑛 + 1). (2.27). .. Comparative statics results yield 𝜕𝑆𝑊 𝑓 | > 0, 𝜕𝑛 𝑛=𝑛. (2.28). 𝜕𝑆𝑊 𝑓 < 0, 1 𝜕𝛼. 11.
(20) 𝜕𝐶𝑆 𝑓 [𝑎 − 𝑐(1 − 𝛼)][𝑎(1 + 2𝑛) − 𝑐𝑛(1 − 𝛼)] = > 0, 𝜕𝑛 4(1 + 𝑛)3. (2.29). 𝜕𝐶𝑆 𝑓 𝑐𝑛[𝑎 + 2𝑎𝑛 − 𝑐𝑛(1 − 𝛼)] = > 0, 𝜕𝛼 4(1 + 𝑛) (2.30) 𝑓 𝜕𝜋𝑙 −[𝑎 − 𝑐(2 + 𝑛)(1 − 𝛼)][𝑎𝑛 − 𝑎 + 𝑐(2 + 𝑛 + 𝑛 )(1 − 𝛼)] = 𝜕𝑛 4(1 + 𝑛)3. < 0, 𝑓. −𝑐[𝑎(2 + 𝑛(2 + 𝑛)) + 𝑐(𝑛3 − 4 − 4𝑛)(1 − 𝛼)] 𝜕𝜋𝑙 = < 0. 𝜕𝛼 2(1 + 𝑛) Lemma 2.1. We can get result that increase in foreign ownership ratio decrease social welfare at free entry.. 𝜕𝑄 𝑓 𝑎 − 𝑐(1 − 𝛼) = > 0, 𝜕𝑛 2(1 + 𝑛) (2.31). 𝜕𝑄 𝑓 𝑐𝑛 = > 0, 𝜕𝛼 2(1 + 𝑛) 𝜕𝑄 𝑓 −𝑛(1 − 𝛼) = < 0. 𝜕𝑐 2(1 + 𝑛) The following proposition is immediate from the above discussion.. Proposition 3: An increase in n increases 𝑄 𝑓 , thus making the consumers better-off at free entry. The reasoning behind the above proposition is similar to that of Proposition 1.. 1. We proof in the Appendix.. 12.
(21) Proposition 4: Complete foreign ownership decrease in welfare. Proof: (4𝑎) 𝑆𝑊 𝑛=0 > 𝑆𝑊 𝑛=1 . (4𝑏) 𝑆𝑊 𝑓=0 > 𝑆𝑊 𝑓=1 . (4𝑐) 𝑆𝑊 𝑓=1 < 𝑆𝑊 𝑛=1 . (4𝑑) 𝑆𝑊 𝑓=0 < 𝑆𝑊 𝑛=0 .. Under the Stackelberg competition, regardless of the presence of entry cost or no entry cost under cost asymmetry. The government in order to followers to compete with the leader that the investments by foreign investors into followers lead to more efficient production technology relative to leader. However, the leader in profits decreases to make the social welfare decrease.2. 2.4 Conclusion In contrast to the general belief that higher competition makes the consumers better off, using a simple model with asymmetric cost firms under Stackelberg competition we show that it is robust. A rise in the number of more cost inefficient firm is possible to increase the total output, which means the entry can increase consumer surplus in the presence of foreign ownership at free entry.. 2. We show in Appendix which is assumed to hold.. 13.
(22) CHAPTER THREE: Optimal Foreign Ownership in Stackelberg Competition at Free Entry In this chapter, we consider that the fully restricted policy versus in the presence of foreign ownership under Stackelberg competition at free entry. Section 3.1introduces our basic model and Section 3.2 is fully restricted policy under Stackelberg competition at free entry. In Section 3.3, the government determines the equilibrium of the foreign ownership ratio into the followers. Section 3.4 concludes this chapter.. 3.1 The Basic Mode We assume that the inverse market demand function is 𝑃 = 𝑎 − 𝑄, where P is price and 𝑄 = 𝑞𝑙 + ∑𝑛𝑖=1 𝑞𝑖 ; 𝑞𝑖 is the quantities produced by firms i=1, 2,…, n, respectively. Consider a firm, called leader, which has invented a technology for a product, and can produce the product at the marginal cost c. The leader enters the industry by incurring a fixed cost. . We assume that each entrant can produce the. product at the marginal cost of production c (>0). Hence, c measures the marginal cost difference between the leader and the entrants, and it may depend on the strength of the patent system and/or the complexity of the technology, which affect the benefit from knowledge spillover. However, if a potential entrant wants to produce the product, it needs to enter the market by incurring a fixed cost. . If an entrant enters. the market, we call it a follower. We assume a >c competing like Stackelberg competition with a homogeneous product. Suppose that the investment by foreign investors into firm i lead to more efficient production technology relative to firm l. We assume 𝛼 is foreign ownership 14.
(23) ratio, where 𝛼 ∈ [0, 1] represents the share of foreign capital ownership in firms i. The former formulation indicates that as the proportion of firm i’s shares held by foreign owner’s increases, the production cost of firm i decreases. Let us consider the following game. At stage 1, given the number of firms, the government determines 𝛼 to maximize welfare, which is the sum of total profits of the firms, consumer surplus and tax revenue. At stage 2, the leader enters the market. At stage 3, the entrants decide whether or not to enter the market. If there is no entry at stage 3, the leader produces like a monopolist at stage 4, and the profit is realized. If there is entry at stage 3, the leader behaves like a Stackelberg leader and the followers behave like Stackelberg followers at stage 4, and the profits are realized. We solve the game through backward induction.. 3.2 Benchmark In this section, we consider the government is fully restricted (𝛼 = 0) in the presence of entry cost. We will assume in the following analysis that: (i). > , which will ensure that at least one potential entrant enters the. market. This assumption will also ensure that the net profit (i.e., the operating profit minus the fixed cost of entry) of the leader is positive. The profit functions for firms l and i are given as 𝑛. 𝜋𝑙 = (𝑎 − 𝑞𝑙 − ∑ 𝑞𝑖 − 𝑐) 𝑞𝑙 ,. (3.1). 𝑖=1 𝑛. 𝜋𝑖 = (𝑎 − 𝑞𝑙 − ∑ 𝑞𝑖 − 𝑐) 𝑞𝑖 .. (3.2). 𝑖=1. If n followers enter the market, the ith follower, i =1,2,...,n, maximizes the following expression to determine its output: 15.
(24) 𝑛. 𝑚𝑎𝑥 𝜋𝑖 = (𝑎 − 𝑞𝑙 − ∑ 𝑞𝑖 − 𝑐) 𝑞𝑖 . 𝑞𝑖. (3.3). 𝑖=1. Given the output of the leader, 𝑞𝑙 , the equilibrium output of the ith follower is 𝑞𝑖 =. 𝑎 − 𝑐 − 𝑞𝑙 . 1+𝑛. (3.4). The Stackelberg leader maximizes the following expression to determine its output: 𝑎 − 𝑞𝑙 − 𝑐 𝑚𝑎𝑥 𝜋𝑙 = (𝑎 − 𝑞𝑙 − 𝑛 ( ) − 𝑐) 𝑞𝑙 . 𝑞𝑙 (𝑛 + 1). (3.5). The equilibrium output of the leader can be found as 𝑞𝑙𝑟 =. 𝑎−𝑐 , 2. (3.6). where the superscript r denotes the values under the fully restricted policy. Using (3.6), we get the equilibrium output of the ith follower, i =1,2,...,n, as 𝑞𝑖𝑟 =. 𝑎−𝑐 . 2𝑛 + 2. (3.7). The total output and price of the product are 𝑄𝑟 =. (2𝑛 + 1)(𝑎 − 𝑐) , 2(𝑛 + 1) (3.8). 𝑎 + 𝑐 + 2𝑐𝑛 𝑃𝑟 = . 2 + 2𝑛 The net equilibrium profits of the leader and the ith follower, i =1,2,...,n, are Respectively 𝜋𝑙𝑟 =. (𝑎 − 𝑐) − 4(𝑛 + 1). , (3.9). 𝜋𝑖𝑟 =. (𝑎 − 𝑐) − 4(𝑛 + 1). .. Hence, the zero-profit condition in the free entry equilibrium implies that the equilibrium number of firms under Stackelberg competition satisfies 16.
(25) 𝜋𝑖𝑟 = 0 or. (𝑎 − 𝑐) = 4(𝑛 + 1). .. (3.10). Postulating that all i firms’ profits are driven to zero, we attempt to explore the long-run equilibrium wherein free entry and exit prevail; that is, the number of follower firms n is endogenously determined. To illustrate how the endogenous variables are determined, we set Eq. (3.10) to zero for long-run equilibrium and the endogenous number of domestic firms is derived as 𝑛 =. 𝑓 𝑓. .. Consumer surplus with fully restricted is respectively 𝐶𝑆 𝑟 =. (2𝑛 + 1) (𝑎 − 𝑐) . 8(𝑛 + 1). (3.11). We find that the social welfare is 𝑛 𝑟. 𝑆𝑊 = 𝜋𝑙 + ∑ 𝜋𝑖 + CS − (𝑛 + 1). .. (3.12). 𝑖=1. Comparative statics results yield 𝜕𝑆𝑊 𝑟 | > 0, 𝜕𝑛 𝑛=𝑛. (3.13). 𝜕𝑄 𝑟 𝑎−𝑐 = > 0, 𝜕𝑛 2(1 + 𝑛) (3.14). 𝜕𝑄 𝑟 1 + 2𝑛 =− < 0, 𝜕𝑐 2(1 + 𝑛) 𝜕𝐶𝑆 𝑟 (𝑎 − 𝑐) (1 + 2𝑛) = > 0. 𝜕𝑛 4(1 + 𝑛)3. (3.15). Lemma 3.1 Consider the fully restricted policy under Stackelberg competition at free entry, an increase in n increases social welfare and consumer surplus.. 3.3 Foreign Ownership In this section, we consider the nature of foreign ownership when the presence of 17.
(26) entry cost. In the first stage, the government determines the level of regulation. In the second stage, leader determines their output to maximize their own profit. In the third stage, followers determine their output to maximize their own profit. We solve the game through backward induction.. 3.3.1 Equilibrium Outcome The profit functions for firms l and i are given as 𝑛. 𝜋𝑙 = (𝑎 − 𝑞𝑙 − ∑ 𝑞𝑖 − 𝑐) 𝑞𝑙 ,. (3.16). 𝑖=1 𝑛. 𝜋𝑖 = (𝑎 − 𝑞𝑙 − ∑ 𝑞𝑖 − (1 − 𝛼)𝑐) 𝑞𝑖 .. (3.17). 𝑖=1. We will assume in the following analysis that: (i) 𝑎 >. [8 𝑛(9 (4 3𝑛). 𝑛)]. ≡ 𝑎̅, which will ensure non-negative outputs (3.18). of all firms producing in the market (ii) for all 𝑛 ≥ 6, which is enough for the number of firms.. If n followers enter the market, the ith follower, i =1,2,...,n, maximizes the following expression to determine its output: 𝑛. 𝑚𝑎𝑥 𝜋𝑖 = (𝑎 − 𝑞𝑙 − ∑ 𝑞𝑖 − (1 − 𝛼)𝑐) 𝑞𝑖 . 𝑞𝑖. (3.19). 𝑖=1. Given the output of the leader, 𝑞𝑙 , the equilibrium output of the ith follower is 𝑞𝑖 =. 𝑎 − 𝑞𝑙 − (1 − 𝛼)𝑐 . (𝑛 + 1). (3.20). The Stackelberg leader maximizes the following expression to determine its output:. 18.
(27) 𝑎 − 𝑞𝑙 − (1 − 𝛼)𝑐 𝑚𝑎𝑥 𝜋𝑙 = (𝑎 − 𝑞𝑙 − 𝑛 ( ) − 𝑐) 𝑞𝑙 . 𝑞𝑙 (𝑛 + 1). (3.21). The equilibrium output of the leader can be found as 𝑞𝑙 =. (𝑎 − 𝑐 − 𝑐𝑛𝛼) . 2. (3.22). Using (3.22), we get the equilibrium output of the ith follower, i =1,2,...,n, as 𝑞𝑖 =. 𝑎 + 𝑐(𝑛𝛼 + 2𝛼 − 1) . 2(𝑛 + 1). (3.23). The total output and price of the product are 𝑄=. 2𝑎𝑛 + 𝑎 + 𝑐(𝑛(𝛼 − 2) − 1) . 2(𝑛 + 1) (3.24). 𝑃=. 𝑎 + 𝑐 + 2𝑐𝑛 − 𝑐𝑛𝛼 . 2 + 2𝑛. The net equilibrium profits of the leader and the ith follower, i =1,2,...,n, are Respectively 𝜋𝑙 =. (𝑎 − 𝑐 − 𝑐𝑛𝛼) − 4(1 + 𝑛). , (3.25). 𝜋𝑖 =. (𝑎 − 𝑐(2 + 𝑛)(1 − 𝛼)) − 4(1 + 𝑛). .. Hence, the zero-profit condition in the free entry equilibrium implies that the equilibrium number of firms under Stackelberg competition satisfies 𝜋𝑖 = 0 or. (𝑎 − 𝑐(2 + 𝑛)(1 − 𝛼)) = 4(1 + 𝑛). .. (3.26). Postulating that all i firms’ profits are driven to zero, we attempt to explore the long-run equilibrium wherein free entry and exit prevail; that is, the number of follower firms n is endogenously determined. To illustrate how the endogenous variables are determined, we set Eq. (3.26) to zero for long-run equilibrium and the endogenous number of domestic firms is derived as 𝑛 = 19. 𝑓. (1 𝑓. ). ..
(28) 3.3.2 Optimal Level of Foreign Ownership The social planner determines the number of followers to maximize welfare, which is the sum of “the total net profits of the leader and the followers, and consumer surplus”. 𝑛. 𝑆𝑊 = 𝜋𝑙 + (1 − 𝛼) ∑ 𝜋𝑖 + 𝐶𝑆 − (𝑛 + 1). .. (3.27). 𝑖=1. We can get the equilibrium of foreign ownership ratio at free entry as 𝛼. 𝑓. =. 𝑎(4 + 3𝑛) − 𝑐(8 + 𝑛(9 + 2𝑛)) , 𝑐(−8 − 8𝑛 + 𝑛 + 2𝑛3 ). (3.28). where the superscript f denotes the values under the foreign ownership policy. Incorporating the equilibrium foreign ownership ratio, substituting (3.28) in (3.22), (3.23) and (3.24), and we obtain 𝑓. 𝑞𝑙 =. (1 + 𝑛)(4𝑐(1 + 𝑛) + 𝑎(−4 − 2𝑛 + 𝑛 )) , 𝑛 + 2𝑛3 − 8 − 8𝑛 (3.29). 𝑓. 𝑞𝑖 =. 𝑄. 𝑓. 𝑃. 𝑓. =. 𝑎𝑛(1 + 𝑛) − 𝑐(4 + 5𝑛 + 2𝑛 ) , 𝑛 + 2𝑛3 − 8 − 8𝑛. 4𝑐 + 2𝑎(−2 + 𝑛)(1 + 𝑛) − 𝑐𝑛(−4 + 𝑛 + 2𝑛 ) , 𝑛 + 2𝑛3 − 8 − 8𝑛. (3.30). (𝑎(𝑛 − 4 − 2𝑛) + 𝑐(2𝑛3 − 4 − 4𝑛 + 𝑛 )) = , 𝑛 + 2𝑛3 − 8 − 8𝑛. We can get the profit of the leader firm and the welfare that consider the equilibrium foreign ownership ratio (3.31). 20.
(29) 𝜋𝑙 =. 𝑓. 4(1 + 𝑛)(4𝑐(1 + 𝑛) + 𝑎(𝑛 − 2𝑛 − 4)) − 𝑛 (2𝑎(1 + 𝑛) − 𝑐(2 + 𝑛)(1 + 2𝑛)) 4(−8 − 8𝑛 + 𝑛 + 2𝑛3 ). 𝐶𝑆 𝑆𝑊. 𝑓. =. (4𝑐 + 2𝑎(𝑛 − 2)(1 + 𝑛) − 𝑐𝑛(−4 + 𝑛 + 2𝑛 )) , 2(𝑛 + 2𝑛3 − 8 − 8𝑛). 𝑓. 4𝑎 (𝑛3 − 3 − 4𝑛) + 4𝑎𝑐(6 + 9𝑛 + 𝑛 − 2𝑛3 ) + 𝑐 (2𝑛3 − 12 − 20𝑛 − 7𝑛 ) = , 4(−8 − 8𝑛 + 𝑛 + 2𝑛3 ) Comparative statics results yield 𝜕𝑄 𝑓 𝜕𝑛 =. (3.32). 2(𝑎(𝑛 − 1)(1 + 𝑛)(−8 − 4𝑛 + 𝑛 ) + 2𝑐𝑛(2 + 𝑛(7 + 4𝑛))) , (−8 − 8𝑛 + 𝑛 + 2𝑛3 ). 𝜕𝑄 𝑓 4(1 + 𝑛) = −1 − < 0, (−8 − 8𝑛 + 𝑛 + 2𝑛3 ) 𝜕𝑐. 𝜕𝐶𝑆 𝑓 𝜔 = > 0, 𝜕𝑛 (−8 − 8𝑛 + 𝑛 + 2𝑛3 )3. (3.33). 𝜕𝑆𝑊 𝑓 | > 0, 𝜕𝑛 𝑛=𝑛. (3.34). where 𝜔 ≡ 2(4𝑐 + 2𝑎(𝑛 − 2)(1 + 𝑛) − 𝑐𝑛(−4 + 𝑛 + 2𝑛 )) (𝑎(−1 + 𝑛)(1 + 𝑛)(−8 − 4𝑛 + 𝑛 ) + 2𝑐𝑛(2 + 𝑛(7 + 4𝑛))). The following proposition is immediate from the above discussion.. Proposition 1: Consider the situation of the equilibrium foreign ownership ratio under Stackelberg competition at free entry, the entrance of followers is possible to increase the total output, which is able to increase consumer surplus. 21.
(30) Proof (1a). 𝜕𝑄 𝑓 > 0. 𝜕𝑛. (1b). 𝜕𝑄 𝑓 < 0. 𝜕𝑐. (1c). 𝜕𝐶𝑆 𝑓 > 0. 𝜕𝑛. Proposition 2: In the presence of foreign ownership, we find that the foreign ownership policy can improve the market distortions generated by the Stackelberg competition at free entry. Proof: (2a) 𝑞𝑙𝑟 > 𝑞𝑙 𝑓 . (2b) 𝑞𝑖𝑟 < 𝑞𝑖 𝑓 . (2c) 𝑄. 𝑓. > 𝑄𝑟 .. We know that the output of leader more than the output of follower. However, in the presence of foreign ownership can reduce the distortion. There means the follower has more competition in the market. On the other hand, the equilibrium of output with foreign ownership is more than the fully restricted policy of output. Therefore, the consumer surplus of foreign ownership is better off.. Proposition 3: When 𝑛 ≥ 𝑛 , the social welfare will be better-off under the equilibrium of foreign ownership ratio. Proof: (3a) 𝑆𝑊 𝑟 < 𝑆𝑊. 𝑓. for 𝑛 ≥ 𝑛. (3b) 𝑆𝑊 𝑟 > 𝑆𝑊. 𝑓. for 𝑛 < 𝑛 22.
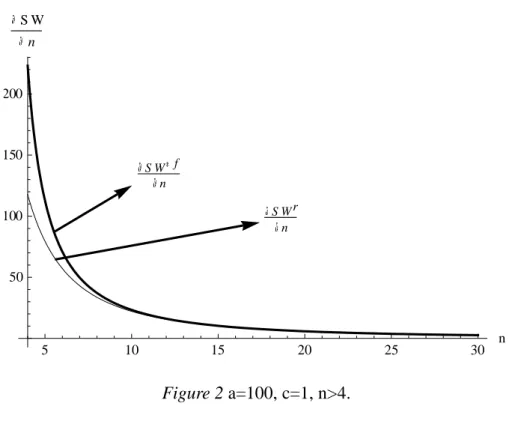
(31) The reason for the above results can be found the fully restricted policy worse than the foreign ownership that is enough of firm. However, we find that the fully restricted policy would be better than the equilibrium of foreign ownership ratio, if 𝑛 < 𝑛 .. SW 4800. 4700. S Wr S Wr. 4600. S Wr. 4500. 4400. SW f. 4300 5. 10. 15. Figure 1: a=100, c=1, n>4.. 23. 20. n.
(32) SW n. 200. 150. SW f n S Wr n. 100. 50. 5. 10. 15. 20. 25. 30. n. Figure 2 a=100, c=1, n>4. In the situation, we infer that the consumer surplus prefer to the foreign ownership policy, due to the equilibrium of price that considering foreign ownership is Lower than the fully restricted policy. Hence, total output is higher than output of the fully restricted policy. Therefore, social welfare is increasing that foreign ownership would be faster than fully restricted policy.3. 3.4 Conclusion This chapter compares output of the each firms and welfare under the fully restricted policy and the equilibrium foreign ownership ratio. We show that welfare is higher under the foreign ownership policy for sufficiently large number of followers, and it is lower under the fully restricted policy for n less than the free entry equilibrium number of followers.. 3. We proof in the Appendix.. 24.
(33) CHAPTER FOUR: Tax, Foreign Ownership and Market Entry Dinda and Mukherjee (2011) show that considering an industry with asymmetric cost firms and rise in the number of more cost inefficient firms makes the consumers worse-off in the presence of a welfare maximizing tax policy. In this chapter, we discuss that the government determines the level of tax rate under Cournot competition. In section 4.1introduces our basic model and Section 4.2 consider the fully restricted policy into the inefficient firms under Cournot competition. In Section 4.3, we consider foreign ownership ratio into the inefficient firms under Cournot competition. Section 4.4 concludes this chapter.. 4.1 The Basic Mode We assume that the inverse market demand function is 𝑃 = 𝑎 − 𝑄, where a is a measure of market size and 𝑄 is the total output. We assume that the welfare maximizing government of the country imposes a per-unit tax4, t, on each firm. We consider a market with a firm, each with the marginal cost of production 0, and n firms can produce the product at the marginal cost c(>0), and we assume a >c competing like Cournot competition with a homogeneous product. Suppose that the investment by foreign investors into firm i lead to more efficient production technology relative to firm 0. We assume 𝛼 is foreign ownership ratio, where 𝛼 ∈ [0, 1] represents the share of foreign capital ownership in firms i. The former formulation indicates that as the proportion of firm i’s shares held by foreign owner’s increases, the production cost of firm i decreases. At stage 1, given the number of. 4. If t is negative, it implies that the government is subsidizing the firms.. 25.
(34) firms, the government determines t to maximize welfare, which is the sum of total profits of the firms, consumer surplus and tax revenue. At stage 2, the firms compete like Cournot oligopolists and profits are realized. As usual, we solve the game through backward induction.. 4.2 No Foreign Ownership We consider the simplified model. Given the number of firms, the government determines t to maximize welfare, which is the sum of total profits of the firms, consumer surplus and tax revenue. The firms compete like Cournot oligopolists and profits are realized. We will assume in the following analysis that: (i) 𝑎 >. ( 𝑛 1) 𝑛 1. ≡ 𝑎̅ , which will ensure non-negative outputs of all firms. producing in the market. 4.2.1 Equilibrium Outcome The inverse market demand function is 𝑃 = 𝑎 − 𝑄 , where P is price and 𝑄 = 𝑞0 + ∑𝑛𝑖=1 𝑞𝑖 ; 𝑞0 , 𝑞𝑖 are the quantities produced by firms 0 and i=1, 2,…, n, respectively. The profit functions of the n firms are 𝜋0 = (𝑎 − 𝑄 − 𝑡)𝑞0 , and the profit function of the n firms are 𝜋𝑖 = (𝑎 − 𝑄 − 𝑐 − 𝑡)𝑞𝑖 , where i=1, 2,…, n, maximizes the following expression to determine its output: 𝑚𝑎𝑥 𝜋0 = (𝑎 − 𝑄 − 𝑡)𝑞0 ,. (4.1). 𝑚𝑎𝑥 𝜋𝑖 = (𝑎 − 𝑄 − 𝑐 − 𝑡)𝑞𝑖 𝑖 = 1, 2, … , 𝑛.. (4.2). 𝑞0. 𝑞𝑖. 26.
(35) The equilibrium outputs of the firm 0 and the ith firm, i=1, 2,…, n can be found as 𝑎 − 𝑡 + 𝑐𝑛 , 2+𝑛. 𝑞0 =. (4.3). 𝑎 − 𝑡 − 2𝑐 𝑞𝑖 = , 2+𝑛. Where assume that 𝑎 − 𝑡 + 𝑛𝑐 > 0 and 𝑎 − 𝑡 − 2𝑐 > 0, which ensure positive outputs of all firms. The total output and price of the product are respectively 𝑄=. 𝑎(1 + 𝑛) − (1 + 𝑛)𝑡 − 𝑐𝑛 , 2+𝑛 (4.4). 𝑎 + 𝑐𝑛 + (1 + 𝑛)𝑡 𝑝= , 2+𝑛. 𝜋0 =. (𝑎 + 𝑐𝑛 − 𝑡) , (2 + 𝑛) (4.5). 𝜋𝑖 =. (𝑎 − 2𝑐 − 𝑡) . (2 + 𝑛). 4.2.2 Optimal Tax Rate Solve the first stage of the game, where the determine t to maximize welfare, which is the sum of total profit, consumer surplus and tax revenue. Hence, the government maximizes the following expression to determine t: 𝑛. max 𝑆𝑊 = 𝜋0 + ∑ 𝜋𝑖 + 𝐶𝑆 + 𝑡𝑄, 𝑡. (4.6). 𝑖=1. where 𝑄 = 𝑞0 + ∑𝑛𝑖=1 𝑞𝑖 . We get the equilibrium tax rate as 𝑡 =. −[𝑎(1 + 𝑛) − 𝑐𝑛] < 0. (1 + 𝑛). (4.7). 27.
(36) Incorporating the equilibrium tax rate, using equation (4.7) into (4.3) (4.4) (4.5), we get the equilibrium output of the firm 0 and equilibrium output of the firm i. 𝑞0 =. 𝑎(1 + 𝑛) + 𝑐𝑛 , (1 + 𝑛) (4.8). 𝑎(1 + 𝑛) − 𝑐(1 + 2𝑛) 𝑞𝑖 = . (1 + 𝑛) The equilibrium outputs of all firms are positive if 𝑎>. 𝑐(2𝑛 + 1) ≡ 𝑎̅ , which is assumed to hold. 𝑛+1. We obtain the following conditions: 𝑄 = 𝑝 =. 𝑎(1 + 𝑛) − 𝑐𝑛(1 + 𝑛) , (1 + 𝑛) (4.9). 𝑛[𝑐(1 + 𝑛)] , (1 + 𝑛). 𝑎(1 + 𝑛) + 𝑐𝑛 𝜋0 = [ ] , (1 + 𝑛) (4.10) 𝜋𝑖 = [. 𝑎(1 + 𝑛) − 𝑐(1 + 2𝑛) ] , (1 + 𝑛). 𝐶𝑆 =. [𝑎(𝑛 + 1) − 𝑐𝑛(𝑛 + 1)] , 2(𝑛 + 1)4. (4.11). Comparative statics results yield 𝜕𝜋0 2(𝑎 + 𝑎𝑛 − 2𝑐𝑛)(𝑎 + 𝑎𝑛 + 𝑐𝑛 ) =− < 0, (1 + 𝑛)5 𝜕𝑛 𝜕𝜋𝑖 2(𝑎 + 𝑎𝑛 − 2𝑐𝑛)(𝑎 − 𝑐 + 𝑎𝑛 − 2𝑐𝑛) =− < 0, (1 + 𝑛)5 𝜕𝑛. 28.
(37) 𝜕𝐶𝑆 −𝑐(𝑎 + 𝑎𝑛 − 𝑐𝑛) = < 0, 𝜕𝑛 (1 + 𝑛)3 𝜕𝑆𝑊 𝑐[𝑐 + 2𝑐𝑛 − 𝑎(1 + 𝑛)] = < 0. 𝜕𝑛 (1 + 𝑛)3 The results are similar to Dinda and Mukherjee (2011). They show that an increase in the number of cost inefficient firms makes the consumers worse-off in the presence of a welfare maximizing tax policy.. 4.3 Foreign ownership We consider the investment by foreign investors into firm i lead to more efficient production technology relative to firm 0. We will assume in the following analysis that: (i) 𝑎 >. (1. )[1 𝑛 ( 𝑛 1) ] (𝑛 1). ≡ 𝑎̅ , which will ensure non-negative outputs of all. firms producing in the market, and 1. (ii) We assume that 𝛼 ≤ , (iii) We assume that 𝑛 > 1.. 4.3.1 Equilibrium Outcome Each of the 0 and n firms respectively maximizes the following expression to determine its output:. 𝑚𝑎𝑥 𝜋0 = (𝑎 − 𝑄 − 𝑡)𝑞0 and 𝑚𝑎𝑥 𝜋𝑖 = (𝑎 − 𝑄 − (1 − 𝛼)𝑐 − 𝑡)𝑞𝑖 , 𝑞0. 𝑞𝑖. 𝑛. where 𝑄 = 𝑞0 + ∑ 𝑞𝑖 . 𝑖=1. Solving the series of first-order conditions yields the following equilibrium outcomes 29.
(38) 𝑎 − 𝑡 + 𝑐𝑛(1 − 𝛼) , 2+𝑛. 𝑞0 =. (4.12). 𝑞𝑖 =. 𝑎 − 𝑡 − 2𝑐(1 − 𝛼) , 2+𝑛. 𝑄=. 𝑎(1 + 𝑛) − (1 + 𝑛)𝑡 − 𝑐𝑛(1 − 𝛼) , 2+𝑛. 𝑝=. (4.13). [𝑎 + 𝑐𝑛(1 − 𝛼) + (1 + 𝑛)𝑡] , 2+𝑛. 𝜋0 =. (𝑎 + 𝑐𝑛 − 𝑡 − 𝑐𝑛𝛼) , (2 + 𝑛) (4.14). 𝜋𝑖 =. (𝑎 − 2𝑐 − 𝑡 + 2𝑐𝛼) . (2 + 𝑛). 4.3.2 Optimal Level of Tax Rate We solve the first stage of the game, where the determine t to maximize welfare, which is the sum of the total profit, consumer surplus and tax revenue. Hence, the government maximizes the following expression to determine t: 𝑛. 𝑚𝑎𝑥 𝑆𝑊 = 𝜋0 + (1 − 𝛼) ∑ 𝜋𝑖 + 𝐶𝑆 + 𝑡𝑄, 𝑡. (4.15). 𝑖=1. where 𝑄 = 𝑞0 + ∑𝑛𝑖=1 𝑞𝑖 . The equilibrium tax rate can be found as 𝑡 =. −𝑐𝑛(1 − 𝛼)(4𝛼 − 1) − 𝑎[1 + 𝑛(1 − 2𝛼)] < 0. (1 + 𝑛) + 2𝑛𝛼. If (4.16) hold, the equilibrium tax rate is negative since 𝛼 ≤ 1. (4.16) 1. by assumption.. Proposition 1: When the 𝛼 ∈ [0, ], the best policy is subsidization; while the best 1. policy is tax, when 𝛼 > . 30.
(39) Incorporating the equilibrium tax rate, substituting (4.16) in (4.12), (4.13) and (4.14), and we obtain 𝑞0 =. 𝑎(1 + 𝑛) + 𝑐𝑛(1 − 𝛼)(𝑛 + 2𝛼) , (1 + 𝑛) + 2𝑛𝛼 (4.17). 𝑎(1 + 𝑛) − 𝑐(1 + 2𝑛)(1 − 𝛼) 𝑞𝑖 = , (1 + 𝑛) + 2𝑛𝛼 the outputs of all firms are positive if 𝑎>. (1. )[1 𝑛 ( 𝑛 1) ] (𝑛 1). ≡ 𝑎̅, which is assumed to hold.. We obtain the following conditions: 𝑄 =. 𝑎(1 + 𝑛) − 𝑐𝑛(1 + 𝑛 − 2𝛼)(1 − 𝛼) , (1 + 𝑛) + 2𝑛𝛼. 𝑛[𝑐(1 + 𝑛 − 2𝛼)(1 − 𝛼) + 2𝑎𝛼] 𝑝 = , (1 + 𝑛) + 2𝑛𝛼. (4.18). 𝑎(1 + 𝑛) + 𝑐𝑛(1 − 𝛼)(𝑛 + 2𝛼) 𝜋0 = [ ] , (1 + 𝑛) + 2𝑛𝛼 (4.19) 𝜋𝑖 = [. 𝑎(1 + 𝑛) − 𝑐(1 + 2𝑛)(1 − 𝛼) ] , (1 + 𝑛) + 2𝑛𝛼. 𝐶𝑆 =. [𝑎(𝑛 + 1) − 𝑐𝑛(1 − 𝛼)(𝑛 − 2𝛼 + 1)] . 2[2𝑛𝛼 + (𝑛 + 1) ]. (4.20). Comparative statics results yield 𝜕𝑄 2𝑎(𝑛 − 1)𝛼 − 𝑐(1 − 𝛼)[1 − 2𝛼 + 𝑛(2 + 𝑛 + 4𝑛𝛼)] = > 0, [(1 + 𝑛) + 2𝑛𝛼] 𝜕𝑛 𝜕𝑄 −𝑛(1 + 𝑛 − 2𝛼)(1 − 𝛼) = < 0, 𝜕𝑐 (1 + 𝑛) + 2𝑛𝛼. 31. (4.21).
(40) 𝜕𝜋0 −𝛺1 = < 0, 𝜕𝑛 [(1 + 𝑛) + 2𝑛𝛼]3 (4.22). 𝜕𝜋0 −𝛺 = < 0, 𝜕𝛼 [(1 + 𝑛) + 2𝑛𝛼]3 𝜕𝜋𝑖 − 𝛹1 = < 0, [(1 + 𝑛) + 2𝑛𝛼]3 𝜕𝑛. (4.23). 𝜕𝜋𝑖 −𝛹 = < 0, 𝜕𝛼 [(1 + 𝑛) + 2𝑛𝛼]3 𝜕𝐶𝑆 𝛷1 = > 0, [(1 + 𝑛) + 2𝑛𝛼]3 𝜕𝑛. (4.24). 𝜕𝐶𝑆 −𝛷 = < 0, 𝜕𝛼 [(1 + 𝑛) + 2𝑛𝛼]3 where 𝛺1 ≡ 2[𝑎(1 + 𝑛) + 𝑐𝑛(1 − 𝛼)(𝑛 + 2𝛼)][𝑎((1 + 𝑛) + 2𝛼) − 2𝑐(1 − 𝛼)(𝑛 + 𝑛 + 𝛼)]and 𝛺 ≡ 2𝑛[𝑎(1 + 𝑛) + 𝑐𝑛(1 − 𝛼)(𝑛 + 2𝛼)][2𝑎(1 + 𝑛) + 𝑐(2𝑛 + 𝑛3 − 3𝑛 − 2 + 4𝛼(1 + 2𝑛 + 𝑛 + 𝑛𝛼))] and 𝛹1 ≡ 2[𝑎(1 + 𝑛) − 𝑐(1 + 2𝑛)(1 − 𝛼)][𝑎((1 + 𝑛) + 2𝛼) − 2𝑐(1 − 𝛼)(𝑛 + 𝑛 + 𝛼)]and 𝛹 ≡ 2[2𝑎𝑛(1 + 𝑛) − 𝑐(1 + 2𝑛)(1 + 4𝑛 + 𝑛 )][𝑎(1 + 𝑛) − 𝑐(1 + 2𝑛)(1 − 𝛼)] and 𝛷1 ≡ [𝑎(1 + 𝑛) − 𝑐𝑛(1 + 𝑛 − 2𝛼)(1 − 𝛼)][2𝑎(𝑛 −. 1)𝛼 − 𝑐(1 − 𝛼)(1 + 2𝑛 + 𝑛 − 2𝛼 + 4𝑛 𝛼)] and 𝛷 ≡ 𝑛[𝑎(1 + 𝑛) − 𝑐𝑛(1 + 𝑛 − 2𝛼)(1 − 𝛼)][2𝑎(1 + 𝑛) − 𝑐(3 + 9𝑛 + 7𝑛 + 𝑛3 − 4𝛼(1 + 2𝑛 + 𝑛 + 𝑛𝛼))].. Proposition 2: Under Cournot competition with foreign ownership, the entrance of inefficient firms may increase the total output and consumer surplus. Proof: (2a) We get that 𝜕𝑄 > 0, 𝜕𝑛. 𝜕𝑄 <0 𝜕𝑐. (2b) We get that 32.
(41) 𝜕𝐶𝑆 >0 𝜕𝑛. The intuition for the above result is as follows. We have seen in (4.24) that, for a given t, an increase in n increases consumer surplus. However, if n increases, it increases subsidy, which tends to increase total output. Since the government policy internalizes the inefficiency due to oligopolistic competition but not the inefficiency due to the cost asymmetry, an increase in n increases total output by increasing subsidy.5 Therefore, considering an industry with asymmetric cost firms and rise in the number of more cost inefficient firms makes the consumers better-off in the presence of a welfare maximizing subsidy policy.. Proposition 3: The social welfare and consumer surplus in the presence of foreign ownership is lower than the one in the absence of foreign ownership. The entry of cost inefficient firm will improve the social welfare and consumer surplus in the presence of foreign ownership. Proof: (3a). 𝜕𝑆𝑊 | 𝜕𝑛. (3b) 𝑆𝑊 | (3c). 5. We get. 𝜕SW 𝜕𝑛. =. ≠0. ≠0. [ (1 𝑛). 𝜕𝑆𝑊 | 𝜕𝑛. < 𝑆𝑊 |. ≠0. 𝜕𝐶𝑆 | 𝜕𝑛. (3d) 𝐶𝑆 |. ≠0. >. >. (1. =0. 𝜕𝐶𝑆 | 𝜕𝑛. < 𝐶𝑆 |. 𝑛)(1. =0. =0. =0. )][ (𝑛 1) [(1 𝑛)2. (1. )(1. 𝑛. 𝑛 ]2. 𝑛 )]. > 0 for c > 0, since 𝑎 >. (1. )[1 𝑛 ( 𝑛 1) ] (𝑛 1). due to the requirement for positive equilibrium outputs. Hence, more cost inefficient firms increases social welfare whenever all firms produce positive outputs.. 33.
(42) Proposition 4: Consider the situation of subsidy. Then, foreign ownership fully restriction leads to high subsidy rates and an increase in welfare. By comparing the equilibrium values of 𝛼 =. 1. and 𝛼 = 0 , we obtain the. following results.6 |𝑡. =. 1|. < |𝑡. 1. <𝑞. 𝑞. 𝑖, =. 𝑄 𝑃. =. 𝜋. <𝑄. 1. >𝑃. 𝑖, =. 𝐶𝑆 𝑆𝑊. 0, =. 1. =. =0 |,. 1. < 𝐶𝑆. 1. 1. < 𝜋𝑖,. =0. < 𝑞0,. =0 ,. =0 ,. <𝜋. =. < 𝑞𝑖,. =0 ,. 1. =. 1. 0, =. =0. < 𝜋0,. =0 ,. =0 ,. < 𝑆𝑊. =0 .. The results indicate the following. Fully restricted leads to an increase in the output on each firm. On the other hand, the total output under foreign ownership restriction is smaller than that under fully restricted. Hence, fully restricted increases consumer surplus, resulting in a positive impact on host-country welfare. Furthermore, fully restricted leads to higher subsidy rates. Therefore, an increase in subsidy rates due to foreign ownership decreases on inefficient firms, thereby creating a positive impact on welfare. However, foreign ownership relocates the partner firm’s profit from the host country to the foreign country. This is called the profit-shifting effect, which has a negative impact on welfare.. 6. For the calculation results, see Appendix.. 34.
(43) 4.4 Conclusion In contrast to the general belief that higher competition makes the consumers better off, using a simple model with asymmetric cost firms under Cournot competition we show that it is robust. A rise in the number of more cost inefficient firm is possible to increase the total output, which means the entry can increase consumer surplus in the presence of a welfare maximizing subsidy policy. On the other hand, we consider the foreign ownership can be improving the social welfare and consumer surplus, which rise in the number of more cost inefficient firm. However, the foreign ownership decreases the social welfare and consumer surplus.. 35.
(44) CHAPTER FIVE: CONCLUSIONS Recent years, public are being to concern about the consumer surplus issues. We consider market-opening policies: free entry, open of foreign ownership restriction and tax/subsidy policy with consumer surplus issues. In chapter two, we first briefly discuss the case of no entry cost as a benchmark, and then examine the case of endogenous entry in the presence of asymmetric cost. We use a simple model with asymmetric cost firms under Stackelberg competition. We show that the higher competition still makes the consumers better off. A rise in the number of more cost inefficient firm is possible to increase the total output, which mean is inefficient firms can increase consumer surplus in the presence of foreign ownership at free entry. In chapter three, we consider that the fully restricted policy versus in the presence of foreign ownership under Stackelberg competition at free entry. This chapter compares output of the each firms and welfare under the fully restricted policy and the equilibrium foreign ownership ratio. We show that welfare is higher under the foreign ownership policy for sufficiently large number of followers, and it is lower under the fully restricted policy for n less than the free entry equilibrium number of followers. In chapter four, we discuss that the government determines the level of tax rate under Cournot competition. In contrast to the general belief that higher competition makes the consumers better off, using a simple model with asymmetric cost firms under Cournot competition we show that it is robust. A rise in the number of more cost inefficient firm is possible to increase the total output, which means the entry can increase consumer surplus in the presence of a welfare maximizing subsidy policy. On the other hand, we consider the foreign ownership can be improving the social welfare 36.
(45) and consumer surplus, which rise in the number of more cost inefficient firm. We can get the summary that open economy may increase in market competition increases consumer surplus or not.. 37.
(46) APPENDIX Chapter Two Comparative statics results yield 𝜕𝑆𝑊 𝑓 𝜕𝑛. |. 𝑛=𝑛. = 8(1. 1 𝑛 )3. (−8. (1 + 𝑛 )3 + 𝑎𝑐(1 − 𝛼)(−5 + 8𝛼 + 𝑛 ) +. 𝑎 (1 − 2𝛼 − 2(1 − 𝛼)𝑛 ) + 𝑐 (1 − 𝛼) (8 − 8𝛼 + 13𝑛 − 8𝛼𝑛 + 12(𝑛 ) − 6𝛼(𝑛 ) + 4(𝑛 )3 − 2𝛼(𝑛 )3 )) > 0, 𝜕𝑆𝑊 𝑓 𝜕. =. 2. 𝑛(. (13 6𝑛 8(. 𝑛) ). 2 (1. 8(1. )(. 4. 9𝑛 10𝑛2 6(. 𝑛)2 )). 𝑛)2. < 0.. Proof of Proposition 4 The cases of 𝜶 = 𝟎 and 𝜶 = 𝟏 When foreign ownership of firm i is banned (𝛼 = 0), the equilibrium outcomes are given as SW 𝑛=0 = SW. 𝑓 =0. =. 𝑎(3 + 2𝑛)[𝑎 + 2(𝑎 − 𝑐)𝑛] + 𝑐 𝑛(8 + 11𝑛 + 4𝑛 ) , 8(1 + 𝑛) 𝑎 (1 + 6𝑛 + 4𝑛 ) + 𝑐[𝑎(8 + 6𝑛) + 𝑐(𝑛 + 2𝑛3 − 8 − 8𝑛)] . 8(1 + 𝑛). When foreign ownership of firm i is permitted (𝛼 = 1), the equilibrium can be obtained as SW 𝑛=1 =. 𝑎 (3 + 6𝑛 + 4𝑛 ) , 8(1 + 𝑛). 𝑓 =1. 𝑎 (1 + 6𝑛 + 4𝑛 ) , 8(1 + 𝑛). SW. =. SW 𝑛=0 − SW 𝑛=1 = SW. 𝑓 =0. − SW. 𝑓 =1. =. 𝑛[2𝑎(𝑎 − 𝑐(3 + 2𝑛)) + 𝑐 (8 + 11𝑛 + 4𝑛 )] , 8(1 + 𝑛) 𝑐[𝑎(8 + 6𝑛) + 𝑐(𝑛 + 2𝑛3 − 8 − 8𝑛)] . 8(1 + 𝑛) 38.
(47) Chapter Three Proof of Proposition 2 𝑓. 𝑞𝑙𝑟 − 𝑞𝑙 =. −. 𝑓. 𝑞𝑖𝑟 − 𝑞𝑖 = 𝑄. 𝑓. − 𝑄𝑟 =. 𝑛( (4 3𝑛). (1 𝑛)(4 (1 𝑛) 𝑛2 𝑛(1 𝑛). −. 𝑛. 𝑛2. 𝑛2. (8 𝑛(9. (1 𝑛)( 8 8𝑛 𝑛2. 𝑛3 8 8𝑛 (4 5𝑛. 𝑛2 ). 𝑛3 8 8𝑛. 𝑛)(1 𝑛)2 cn( 4 𝑛. (. 4. 𝑛 𝑛2 )). ( 4. 𝑛))) 𝑛3 ). 𝑛3. 8 8𝑛. =. =. (. 𝑛( (4 3𝑛). ( 8 8𝑛 𝑛2. 𝑛)( (4 3𝑛). −. ( 𝑛 1)( ) (𝑛 1). 𝑛3 ). (8 9𝑛. (1 𝑛)( 8 8𝑛 𝑛2. 𝑛2 ). 𝑛2 )). (8 9𝑛. 𝑛2 )). 𝑛3 ). > 0,. < 0,. =. > 0, which is assumed to hold.. Proof of Proposition 3 CS CS f 96. 94 C Sr 92. 90 5. 10. 15. 20. 25. 30. n. Figure 3: a=100, c=1, n>4. 𝜕𝐶𝑆 𝑟 (𝑎 − 𝑐) (1 + 2𝑛) = > 0, 𝜕𝑛 4(1 + 𝑛)3 𝜕𝐶𝑆 𝑓 𝜔 = > 0, 𝜕𝑛 (−8 − 8𝑛 + 𝑛 + 2𝑛3 )3 where 𝜔 ≡ 2(4𝑐 + 2𝑎(𝑛 − 2)(1 + 𝑛) − 𝑐𝑛(−4 + 𝑛 + 2𝑛 )) (𝑎(−1 + 𝑛)(1 + 𝑛)(−8 − 4𝑛 + 𝑛 ) + 2𝑐𝑛(2 + 𝑛(7 + 4𝑛))) . 39.
(48) l. 400. 300. f l r l. 200. 100. 10. 15. 20. 25. 30. n. Figure 4: a=100, c=1, n>4. (𝑎 − 𝑐) 𝜕𝜋𝑙𝑟 =− < 0, 𝜕𝑛 4(1 + 𝑛) 𝑓. 𝜕𝜋𝑙 −𝜉 = < 0, (−8 − 8𝑛 + 𝑛 + 2𝑛3 )3 𝜕𝑛 where 𝜉 ≡ (𝑎(𝑎𝑛(−16 + 48𝑛 + 134𝑛 + 54𝑛3 − 36𝑛4 − 17𝑛5 + 2𝑛6 ) + 𝑐(−128 − 352𝑛 − 456𝑛 − 372𝑛3 − 105𝑛4 + 90𝑛5 + 58𝑛6 + 4𝑛7 )) − 𝑐 (−128 − 432𝑛 − 600𝑛 − 398𝑛3 − 55𝑛4 + 102𝑛5 + 60𝑛6 + 8𝑛7 )). Chapter Four Proof of Proposition 3 𝑆𝑊 |. =0. − 𝑆𝑊 |. ≠0. =. ϑ. (1 𝑛)4 4𝑛(1 𝑛)2. > 0,. Where ϑ ≡ 𝑛𝛼(2𝑎(1 + 𝑛)(𝑎(1 + 𝑛) − 𝑐(3 + 6𝑛 + 𝑛2 − 2(1 + 𝑛)𝛼)) + 𝑐2 (6 +. 2𝑛(11 + 12𝑛 + 3𝑛2 ) − 3(1 + 𝑛)2 (2 + 𝑛)𝛼 + 2(1 + 𝑛)2 𝛼2 )) 𝐶𝑆 |. =0. − 𝐶𝑆 |. ≠0. =. ε ((1. 𝑛)3. 𝑛(1 𝑛) )2. > 0.. Where ε ≡ (𝑛𝛼(2𝑎(1 + 𝑛) − 𝑐(3 + 6𝑛 + 𝑛 − 2𝛼 − 2𝑛𝛼))(𝑐𝑛(−2(1 + 𝑛) + (3 + 2𝑛 + 𝑛 )𝛼 − 2(1 + 𝑛)𝛼 ) + 2𝑎(1 + 𝑛)(1 + 2𝑛 + 𝑛 + 𝑛𝛼))) 40.
(49) Proof of Proposition 4 𝟏. The cases of 𝜶 = 𝟐 under subsidy 1. When foreign ownership of firm i is partial restriction (𝛼 = ), the equilibrium outcomes are given as 𝑡. =. 𝑞. 0, =. 𝑄. =. 2𝑎 + 𝑐𝑛 2[1 + 𝑛(3 + 𝑛)]. =−. 1. 1. 𝑞. 𝑖, =. 2𝑎(1 + 𝑛) − 𝑐𝑛 , 2[1 + 𝑛(3 + 𝑛)]. =. 1. (1 + 𝑛)(2𝑎 + 𝑐𝑛) , 2[1 + 𝑛(3 + 𝑛)]. =. 𝑃. =. =. 1. =. 1. 2𝑎(1 + 𝑛) − 𝑐(1 + 2𝑛) 2(1 + 3𝑛 + 𝑛 ). 2𝑎𝑛 + 𝑐𝑛 2(1 + 3𝑛 + 𝑛 ). 𝜋. 1. =. (1 + 𝑛) (2𝑎 + 𝑐𝑛) , 4[𝑛 + (1 + 𝑛) ]. 𝐶𝑆. 1. =. [2𝑎(1 + 𝑛) − 𝑐𝑛 ] 8[1 + 𝑛(3 + 𝑛)]. =. 4𝑎[𝑎(1 + 𝑛) − 𝑐𝑛 ] + 𝑐 𝑛(1 + 3𝑛) 8[1 + 𝑛(3 + 𝑛)]. 0, =. =. 𝑆𝑊. 𝑡. =. 1 = 2. 1. 𝑛. −𝑡 =−. 𝑞𝑖 − 𝑞0,. 1 = 2. 𝑄 −𝑄. 𝑃 −𝑃 𝜋𝑖 − 𝜋0,. =. 1 2. 1 = 2. 1 2. =. =. =. =. =(. (1 n(3. −( 𝑛)). a(1 𝑛) c(1 (1 𝑛)2. 𝑛). −. (1 𝑛)2 cn(1 𝑛) (1 𝑛)2. n(c(𝑛 1)) (𝑛 1)2. a(1 𝑛) c(1 (1 𝑛)2. −. 𝑛). 𝜋. 𝑖, =. =. ( (1 𝑛) 𝑛) ) (1 𝑛)2. (1 𝑛)( 𝑛) (1 n(3 𝑛)). =. [2𝑎(1 + 𝑛) − 𝑐(1 + 2𝑛)] 4[1 + 𝑛(3 + 𝑛)]. 𝑛(. =. 𝑛(. =. (1 𝑛)2 ( 𝑛)2 4(𝑛 (1 𝑛)2 )2. (1 𝑛)(. (3 8𝑛 3𝑛2 )). 𝑛). (1 𝑛)2 (1 3𝑛 𝑛2 ) 𝑛(1 𝑛). 𝑛(1 𝑛)(11 6𝑛 𝑛2 )). (. (1 𝑛)2 (1 3𝑛 𝑛2 ). (1 𝑛)2 𝑛2 ) (1 n(3 𝑛)). −(. 𝑛( 𝑛) (𝑛(𝑛 3) 1). ) −. 1. =. 𝑛(. (1 𝑛). (. 5𝑛 𝑛2 )). (1 𝑛)(1 3𝑛 𝑛2 ). (1 𝑛). 5𝑛 𝑛2 )). (. (1 𝑛)(1 3𝑛 𝑛2 ). 𝐶𝑆 − 𝐶𝑆 𝑛(. 𝑛)(. 1 = 2. =. (1 𝑛)(1. 𝑛(𝑛 1)). 2. (𝑛 1)4 𝑛). 𝑛(1 3𝑛))(. −. > 0,. > 0,. < 0,. = (2𝑐 − (1 + 𝑛)(2𝑎(2 + 𝑛)(1 + 2𝑛) + 𝑐𝑛(−9 − 2𝑛 +. 𝑛 ))) (−2𝑎𝑛(1 + 𝑛) + 𝑐(2 + 𝑛(1 + 𝑛)(11 + 6𝑛 + 𝑛 )))⁄4(1 + 𝑛)4 (1 + 𝑛(3 + 𝑛)) > 0, ( (𝑛 1)2. > 0,. (1 𝑛)2. (. 𝑛2 ). 8(1 𝑛(3 𝑛)). (1 𝑛). 8(1 𝑛)2 (1 3𝑛 𝑛2 )2. 41. (. 2. 5𝑛 𝑛2 )). 2. =. > 0,.
(50) 𝑆𝑊 − 𝑆𝑊. =. 1 2. = 4𝑎(1 + 𝑛)(2 + 𝑛)(𝑎(1 + 𝑛)(1 + 3𝑛) − 𝑐𝑛(3 + 8𝑛 + 𝑛 )) +. 𝑐 𝑛(1 + 3𝑛) (7 + 25𝑛 + 17𝑛 + 3𝑛3 )⁄8 (1 + 𝑛)3 (1 + 3𝑛 + 𝑛 ) > 0.. 42.
(51) REFERENCES Caves, R., M. D.Whinston, and M. A. Hurwitz (1991) “Patent Expiration, Entry, and Competition in the U.S. Pharmaceutical Industry”, Brookings Papers in Economic Activity: Microeconomics, 1-48. Dowrick, S. (1986). “Von Stackelberg and Cournot Duopoly: Choosing Roles,” Rand J. Econ.17, 251–260. Dinda and Mukherjee (2011) “A Note on the Adverse Effect of Competition on Consumers”, Forthcoming. Etro, F., (2008) “Stackelberg Competition with Endogenous Entry,” Economic Journal, 118, 1670-1697. Gans, J., and J. Quiggin (2003) “A Technological and Organizational Explanation of the Size Distribution of Firms”, Small Business Economics 21, 243-256 Grabowski, H. G., and J. M. Vernon (1992) “Brand Loyalty, Entry, and Price Competition in Pharmaceuticals after the 1984 Drug Act”, Journal of Law and Economics 35, 331-50 Han L, Ogawa H (2009) “Partial Privatization, Technology Spillovers, and Foreign Ownership Restriction”, Review of Urban and Regional Development Studies 21:37–49 Hausman, J., and E. Leibtag (2007) “Consumer Benefits from Increase Competition in Shopping Outlets: Measuring the Effect of Wal-Mart”, Journal of Applied Econometrics 7, 1157-77. Klemperer, P. (1988) “Welfare Effects of Entry into Markets with Switching Costs”, Journal of Industrial Economics XXXVII, 159-6. L. F. S. Wang and Mukherjee, A., (2012) “Undesirable Competition”, Economics Letters. 43.
(52) L. F. S. Wang and T.-L. Chen (2011) “Mixed Oligopoly, Optimal Privatization, and Foreign Penetration” Economic Modelling 28, 1465-1470. Lahiri, S., and Y.Ono (1988) “Helping Minor Firms Reduces Welfare”, Economic Journal 98, 1199-1202 Mankiw, N.G. and Whinston, M.D. (1986) “Free Entry and Social Inefficiency." RAND Journal of Economics, Vol. 17, pp.48-58. Metzenbaum, H. M. (1993) “Antitrust Enforcement: Putting the Consumers First”, Health Affairs Fall, 137-43. Mukherjee, A. and L. Zhao, 2009, ‘Profit Raising Entry’, Journal of Industrial Economics, 57: 870. Mukherjee, A., (2011) “Social Efficiency of Entry with Market Leaders”, Forthcoming. Ohori, S. (2011) “Environmental Policy Instruments and Foreign Ownership” Environ Econ Policy Stud 13, 65–78. Thomadsen, R. (2007) “Product Positioning and Competition: The Role of Location in the Fast Food Industry”, Marketing Science 26, 792-804.. 44.
(53)
數據
Outline
相關文件
Precisely, the population is estimated as the population as at the end of the previous period, plus the increase in population (number of live births and immigrants) in the
6 《中論·觀因緣品》,《佛藏要籍選刊》第 9 冊,上海古籍出版社 1994 年版,第 1
In the presence of inexact arithmetic cancelation in statement 3 can cause it to fail to produce orthogonal vectors. The cure is process
a) Visitor arrivals is growing at a compound annual growth rate. The number of visitors fluctuates from 2012 to 2018 and does not increase in compound growth rate in reality.
Microphone and 600 ohm line conduits shall be mechanically and electrically connected to receptacle boxes and electrically grounded to the audio system ground point.. Lines in
However, the SRAS curve is upward sloping, which indicates that an increase in the overall price level tends to raise the quantity of goods and services supplied and a decrease in
However, the SRAS curve is upward sloping, which indicates that an increase in the overall price level tends to raise the quantity of goods and services supplied and a decrease in
* All rights reserved, Tei-Wei Kuo, National Taiwan University, 2005..
