Experimental and numerical study on
desilting efficiency of the bypassing tunnel
for Nan-Hua reservoir
Tsung-Chun Ho,Gwo-Jang Hwang, Kao-Shu Hwang, Kuo-Cheng Hsieh,
Lung-Wei Chen
Abstract
Physical model tests were conducted to exam the desilting efficiency of a sediment bypassing tunnel in the Nan-Hua reservoir, Taiwan. The reservoir model was rebuilt with a length scale of 1:81, representing a 9.5 km longitudinal length of the reservoir. Scenarios of sediment bypassing can be mainly classified into two situations of high water level and low water level. In high water level, the density currents may be generated in the upstream side. In low water level, empty flushing method can be utilized for venting originally deposited sediments. The desilting efficiency for these two methods using bypassing tunnel was tested.
In high water level, A scenario simulated the 25 years return flood event of which peak flow rate of 1,618 m3/s. The density currents were found in the test, and the front
velocities of currents is in a good agreement with the result calculated by the empirical formula in the downstream side. The histories of concentration of turbid flow vented out were measured for the bypassing tunnel. Results show that the desilting ratios are 24.1% for the event.
In low water level, a small flood during the rainy season was simulated, and peak flow rate of the event is 300 m3/s. Empty flushing was operated for the event, and concentration of the turbid water and desilting rate were also analyzed. Results show that the desilting ratio is 68.2%.
Furthermore, the Flow 3D was used to analyze the motions of density current and desilting ratio of bypassing tunnel. Scenarios of 25 years return period flood were simulated. The concentration of desilting sediments from bypassing tunnel were simulated by the numerical model and compared with the experimental result.
Keywords: Physical modeling, density current, empty flushing, bypassing tunnel
1 General instructions
Siltation problem are serious in most Taiwan’s reservoirs. Torrential floods have carried huge sediments to most of them. The Nan-Hua reservoir, although it is an off-channel reservoir, its capacity has reduced 30% due to the sediments flushing from upstream side in flood events. To solve this problem, a bypassing tunnel was planned to vent the
turbid flow out of the reservoir for decreasing the deposition rate. “Bypass method” has been applied in some reservoirs, as reported in Emamgholizadeh and Samadi (2008), Auel and Boes (2011) and Fukuoka et al. (2013), and it has been proven to desilt sediments from upstream side. In order to choose proper layout of the, the characteristics of a density current should be clarified first.
In order to vent more sediment from the reservoir, empty flushing was also considered. Based on the submerged dike, the reservoir can be separated into upstream side and downstream side. In the rainy season during March to June, the water level of reservoir should be lower, and the sediment can be sluiced out using empty flushing method. Due to the submerged dike is still in planning procedure (2019), the efficiency of the empty flushing is need to be clarified. In the study, the desilting efficiency of the method of sluicing density current and empty flushing was performed by the physical modeling tests, and numerical model was used and validated by the result of physical model. Vented volume of sediments for flood events of 25 years return period was analyzed by numerical model for validation.
2 Experimental setup
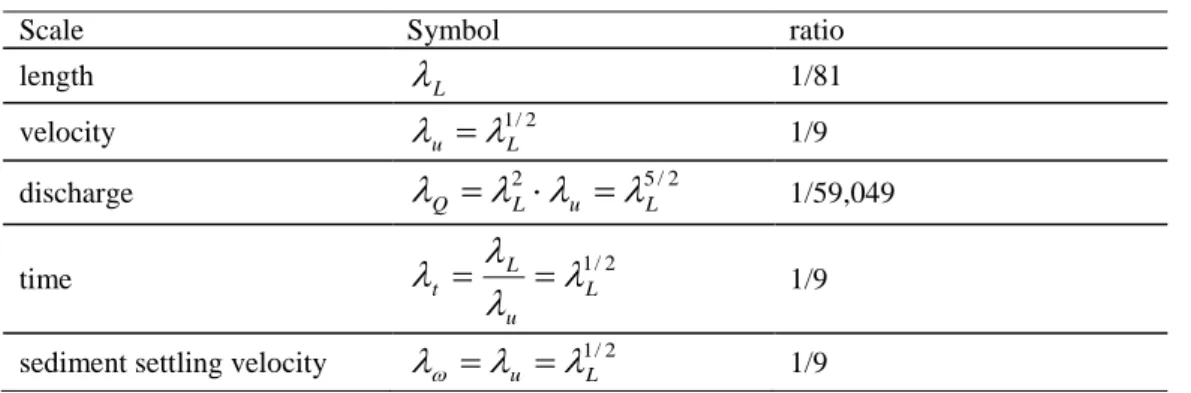
A non-distorted model was constructed in the Tainan Hydraulic Laboratory, NCKU, Taiwan. The length scale is set at 1:81. Related scales were analyzed by the Froude similitude and listed in Table 1. The topography of physical model was based on the data surveyed in 2011.
The plain view of the model was demonstrated in Fig. 1. The upstream end was set at section R39. The entrance of the intake located at the bending corner near the right bank of section R10. Related measuring stations were also marked in the figure.
The intake of the tunnel was made by cast iron. The tainter gate was designed originally in the end of the intake section to control the output discharge, and the tunnel was made by PVC. The following discharges of the tunnel for different stages were validated previously.
This study focused on the concentration at different sections along the path of density current, and the amount of the sediments venting out from the bypassing tunnel. The total weight of sediments input into the reservoir is known, and the concentration of incoming flow in the upstream end must be controlled precisely. A large amount of silts with median grain size d50 equal to 10 μm were added into a high concentration mixing
pool during the tests. To adjust the concentration for different flow discharges, the supplying procedure of turbid water was controlled by a computer. First, all the sediments were put into the mixing pool. The radius of circular pool is 6.0 m and the maximum water depth is 3.1 m. Three turbines were installed in the flume to generate several horizontal and vertical circulations. The turbid water with precise concentration was obtained. In the next step, the turbid water was diluted by clear water in the mixing
process as shown in the Fig. 2. By adjusting the discharges of turbid and clear water, the concentration can be tuned to a precise value. The concentration of turbid water was well monitored in the tests.
3 Experimental Result
3.1 Sediment venting of density current
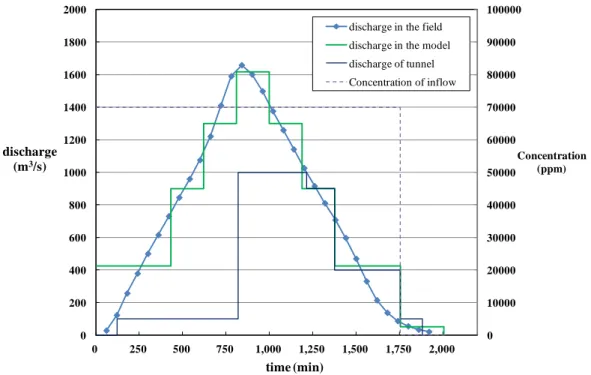
The history of discharge from upstream and concentration for the 25 years return period flood was demonstrated in Fig. 3. The peak discharge of the event is 1,618 m3/s. The concentration was set at 70,000 ppm, and the initial water level was set at El. 175.0 m. During the test, the gate of the tunnel opened while the head of density flow arrived the entrance of the tunnel. The discharge was set at 75 m3/s in the beginning, but it changed to 1,000 m3/s while the water level reached El. 180.0 m.
The velocities of the head of density current were calculated and demonstrated in Fig. 4. They decrease with the distance along the channel. The analyzed result of Morris and Fang (1997) and Ippen and Harleman (1952) were also performed in the Fig. 4. In the upstream side, the predict values based on these two equations are over estimated. In the downstream side, Section 12, the both predict values are close to the experimental result. The slopes at Section 24 and 12 are equal to 0.067 and 0.003. This two values are not in the same order, and it maybe due to these two equations are only suitable to predict the head velocities on the mild slope.
The concentration of the turbid flow venting from the bypassing tunnel were measured while the sluice gate was opened, as shown in Fig. 5. By estimating the concentration history and then divided by the total sediments supplied at the upstream end, the desilted ratio in this case is 24.1%. The concentration decreased rapidly along the channel, and most sediments deposited along the upstream side. The result shows the operation of the tunnel is an important key. If the gate was opened earlier and set suitable discharge, the desilted ratio in the final would be more ideal.
3.2 Sediment venting based on empty flushing
The authority plans to set up a submerged dam to divide impounded area of Nanhua Reservoir into upstream-reservoir and downstream-reservoir. The functions of the submerged dam are: (1) blocking density current from upstream side, (2) storing water in the downstream reservoir during the period to practice empty flushing.
Fig. 1 The plain view of sections and monitoring stations in the model.
Fig. 3 The history of inflow discharge and outlet discharge of sediment bypassing tunnel in the test of 25 years return period flood.
C, V, W C CW CVW C W C W V C W C C C section 20 section 29 section 24 section 12
intake near the spillway tunnel
∞
∞ ∞
Clear water Mixing tank High concentration mixing pool Upstream end of the reservoir 6 m Discharge control 0 10000 20000 30000 40000 50000 60000 70000 80000 90000 100000 0 200 400 600 800 1000 1200 1400 1600 1800 2000 0 250 500 750 1,000 1,250 1,500 1,750 2,000 Concentration (ppm) discharge (m3/s) time (min)discharge in the field discharge in the model discharge of tunnel Concentration of inflow
Fig. 2 Schematic diagram of the system for generating turbid flow
Fig. 4 Flow velocity of density current in the test of 25 years return period flood
Tab. 1 Relative scales of the hydraulic model test
Scale Symbol ratio
length 1/81
velocity 1/9
discharge 1/59,049
time 1/9
sediment settling velocity 1/9
The planner suggested that the submerged dam located downstream of the inlet of the sediment desilting tunnel, and the sketch layout of the submerged dam and the sediment desilting tunnel as Fig. 6.
The initial elevation of water level is set as 160 m considering the operation in the field. The history of inflow and outflow discharge of the tunnel was demonstrated in Fig. 7. The total time is 31.5 hours. The sluice gate was opened from 0 ~ 1.5 hr due to the turbid water comes. In the first step, it is the so called drawdown flush. The flow condition transformed to empty flushing until 2 hours later. The entrance of the tunnel appeared and elevation is 139.4 m at the moment. It becomes open channel flow after that moment. The concentration of incomeing turbid flow was set as 20,000 ppm.
Fig. 8 shows the concentration history of empty flushing procedure for flood event of peak discharge set as 300 m3/sec. Initial concentration was kept about 11,000 ppm in stage I, and concentration reaches 13,500 ppm at stage III. The concentration is higher then that of the upstream section No. 12, and it implies that part of suspension load comes from the bed load in upstream side. Based on the concentration history and total volume input from the upstream side, the amount of sediments vented out from the sluice gate was 263,000 tons, and the disilting rate is 68.2%. Note that part of the
0.0 0.5 1.0 1.5 2.0 2.5 3.0 3.5 4.0 4.5 Flow velocity of density current (m/s) Position experimental result Ippen and Harleman (1952) Morris and Fang (1997)
0 500 1000 1500 2000 2500 3000 0 10000 20000 30000 40000 50000 60000 0 500 1000 1500 2000 2500 Concentration (mg/L) time (min)
Time series of concentration discharge of inflow Discharge of tunnel desilting ratio 24.1% discharge (m3/s) L 2 / 1 L u 2 / 5 2 L u L Q 2 / 1 L u L t 2 / 1 L u
Fig. 5 The history of concentration at outlet of sediment bypassing tunnel in the test of 25 years return period flood
sediment vented from the tunnel is bed load near the entrance of tunnel, and the desilting rate is much higher than that of sediment venting of density current.
Fig. 9 shows the scoured main channel near entrance of bypassing tunnel after empty flushing procedure. The location of main channel was close to left side at Section 12 until it reached flushing cone. The bed was flushed by the river flow, and bed load was iniciated and became suspend load, and then the sediments were carried out from the bypassing tunnel to the downstream side.
Fig. 6 the layout of the submerged dam and sediment desilting tunnel
Fig. 7 Inflow discharge history and outflow discharge history of sluice tunnel for case of peak discharge of 300 m3/sec. 0 0 100 100 200 200 300 300 200 200 100 100 0 0 50 100 150 200 250 300 350 400 0 5 10 15 20 25 30 Discharge (cms) Time (hours)
history of flood event with 300 cms peak discharge discharge of bypassing tunnel sampling time of flow venting from the tunnel
I II III IV V 0 50 100 150 200 250 300 350 400 450 500 0 20,000 40,000 60,000 80,000 100,000 0 3 6 9 12 15 18 21 24 27 30 33 discharge (m3/s) and cumulated desilting sediments (1,000 tons) Concentration (mg/L) time (hr) 300 cms flood event 300 cms flood event--modified Inflow discharge Cumulated desilting sediments
Fig. 8 Concentration history of empty flushing method for flood event of peak discharge set as 300 m3/sec.
(a) (b)
Fig. 9 The scoured bed near entrance of tunnel after empty flushing, and the main channel was close to left side (a) downstream of Sec. 12; (b) scour pattern of flushing cone.
4 Numerical Result
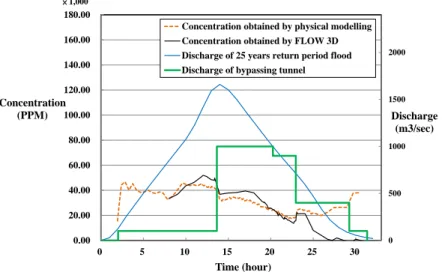
The commercial software Flow 3D was used in this study to simulate the movement of density current and the output concentration of turbid flow venting out of bypassing tunnel. Related parameters of settings were listed in Table 2. These parameters were tested by the present experiment. The comparison between experimental results was shown in Fig. 10. It is found that they match with each other in the most duration time. But in the latest stage, the concentration of experimental study still keeps upper than 20 kg/m3. The concentration of numerical result decrease gradually until the value is close to zero. In the last stage, the turbid water pool already formed near the entrance, and the falling speed of suspension sediments will decrease due to the flocculation. On the other hand, the falling speed is related to the grain size of sediments. So the particle size in the numerical models can be adjusted further to get more accurate result.
Tab. 2 Input parameters of FLOW-3D model
Items contents descriptions
Mesh sizes dx = 12.0m
dy = 12.0m dz = 0.5~2.0m
Grid numbers 3,487,078
Turbulent module Large eddy model Based on the references
Boundary condition of inflow
Volume flow rate Refer to the relationship between
discharge and concentration at upstream side in the field Boundary condition of
outflow
Out flow
Initial water level 175 m
Grain size D1=0.02 mm (50%) D2=0.008
mm (25%) D3=0.002 mm
(25%)
According to the field survey
Fig. 10 Comparison between the experimental and numerical result for the concentration of the turbid water venting out from bypassing tunnel.
5 Conclusion
In high water level, the sediment bypassing method for density currents were conducted, and the front velocities of currents is in a good agreement with the result calculated by the empirical formula in the downstream side. But they are all suitable in the mild slope. Results show that the desilting ratios are 24.1%.
In low water level, empty flushing was operated for the event of peak discharge equal 300 m3/sec. Results show that the desilting ratio is 68.2%. The ratio is much higher than
that of the method for bypassing density current.
The Flow 3D was used to analyze the motions of density current and desilting ratio of bypassing tunnel. Scenarios of 25 years return periods were simulated. Note that the numerical and experimental results match with each other in the most duration time. The concentration of numerical result decrease gradually until the value is close to zero. The falling speed is related to the grain size of sediments, so the particle size in the numerical models should be adjusted further for more precise result.
Acknowledgement
Authors want to give sincerely thanks to Southern Region Water Resources Office, WRA, MOEA and Taiwan Water Corporation for their financial support in the projects. The data in this paper is rearranged from the projects.
References
1. Akiyama, J., and Stefan, H. G. (1984). Plunging flow into a reservoir: Theory. Journal of Hydraulic
Engineering, ASCE, 110(4), 484-499.
2. Alavian, V., Jirka, G. H., Denton, R. A., Johnson, M. C. and Stefan, H. G. (1992). Density currents
0 500 1000 1500 2000 0.00 20.00 40.00 60.00 80.00 100.00 120.00 140.00 160.00 180.00 0 5 10 15 20 25 30 Concentration (PPM) Discharge (m3/sec) Time (hour)
Concentration obtained by physical modelling Concentration obtained by FLOW 3D Discharge of 25 years return period flood Discharge of bypassing tunnel
entering lakes and reservoirs, Journal of Hydraulic Engineering, ASCE, 118(11), 1464-1489.
3. Auel, C. and Boes, R. (2011). Design and construdion of the sediment bypass tunnel at Solis,
Hydropower & Dams, 3, 62-66.
4. Britter, R. E. and Simpson, J. E., (1978). Experiments on the dynamics of a gravity current head,
Journal of Fluid Mechanics, 88(2), 223-240.
5. Cesare, G. D. and Schleiss, A. (1999). Turbidity current monitoring in a physical model flume using ultrasonic Doppler method, 2nd International Symposium on Ultrasonic Doppler Methods for Fluid
Mechanics and Fluid Engineering, 61-64.
6. Emamgholizadeh, S. and Samadi, H. (2008). Desilting of deposited sediment at the upstream of the DEZ reservoir in Iran, Journal of Applied Sciences in Environmental Sanitation, 3(1), 25-35.
7. Fan, J. and Morris, G. L. (1992). Reservoir sedimentation, II: reservoir desiltation and long-term storage capacity, Journal of Hydraulic Engineering, ASCE, 118(3), 370-384.
8. Firoozabadi, B., Afshin H., and Aram, E. (2009). Three-Dimensional Modeling of Density Current in a Straight Channel, Journal of Hydraulic Engineering, ASCE, 135(5), 393-402.
9. Fukuoka, S., Nakagawa, H., Sumi, T., Zhang, H. (2013). Advances in River Sediment Research, CRC Press, U. S. A., 5-7.
10. Garcia, M. H. (1994). Depositional turbidity currents laden with poorly sorted sediment, Journal of
Hydraulic Engineering, 120(11), 1240-1263.
11. Hwang, J. S. (1985). The study and planning of reservoir desilting in Taiwan, Water International, 10(1), 7-13.
12. Lee, H. Y. and Yu, W. S. (1997). Experimental study of reservoir turbidity current, Journal of
Hydraulic Engineering, ASCE, 123(6), 520-528.
13. Morris, G. L. and Fang J. (1997). Reservoir sedimentation handbook, McGraw-Hill, New York.
Authors
Tsung-Chun Ho (corresponding Author) Email: [email protected]
Gwo-Jang Hwang Kao-Shu Hwang
Tainan Hydraulics Laboratory, National Cheng Kung University, Taiwan Kuo-Cheng Hsieh
Sinotech Engineering Consultants Lung-Wei Chen