Series quartz crystal sensor for remote bacteria population monitoring
in raw milk via the Internet
Ku-Shang Chang
a,b,∗, Hung-Der Jang
a,b, Ching-Fu Lee
c, Yuan-Guey Lee
d,
Chiun-Jye Yuan
e, Sheng-Hsien Lee
baDepartment of Food Science, Yuanpei University of Science and Technology, No. 306, Yuanpei Street, Hsinchu 300, Taiwan, ROC bDepartment of Biotechnolgy and Graduate Institute of Biotechnolgy, Yuanpei University of Science and Technology, Taiwan
cDepartment of Applied Science, National Hsinchu University of Education, Hsinchu, Taiwan dDepartment of Veterinary Medicine, National Pingtung University of Science and Technology, Pingtung, Taiwan
eDepartment of Biological Science and Technology, National Chiao Tung University, Hsinchu 300, Taiwan Received 28 February 2005; received in revised form 15 July 2005; accepted 19 July 2005
Available online 30 August 2005
Abstract
A remote monitoring system based on a piezoelectric quartz crystal (SPQC) sensor was developed for the determination of the bacteria population in raw milk. The system employs the Windows XP server operating system, and its programs for data acquisition, display and transmission were developed using the LabVIEW 7.1 programming language. The circuit design consists of a circuit with a piezoelectric quartz crystal (SPQC) and a pair of electrodes. This system can provide dynamic data monitoring on a web-page via the Internet. Immersion of the electrodes in a cell culture with bacteria inoculums resulted in a change of frequency caused by the impedance change due to microbial metabolism and the adherence of bacteria on the surface of the electrodes. The calibration curve of detection times against density of bacteria showed a linear correlation coefficient (R2= 0.9165) over the range of 70–106CFU ml−1. The sensor could acquire sufficient data rapidly
(within 4 h) and thus enabled real-time monitoring of bacteria growth via the Internet. This system has potential application in the detection of bacteria concentration of milk at dairy farms.
© 2005 Elsevier B.V. All rights reserved.
Keywords: Series piezoelectric quartz crystal; Biosensor; Escherichia coli; Internet
1. Introduction
Ensuring raw milk quality is an important step in suc-cessful dairy processing plant operations. It is considered a critical control point in the Hazard Analysis Critical Control Point (HACCP) plans (Niza-Ribeiro et al., 2000). At the dairy farm, raw milk is drawn from milking machine cups through pipes leading to an insulated stainless-steel holding tank. Raw milk is maintained at a lower temperature in tank trucks, and may be delivered directly to a processing plant. Normally only a general assessment of milk quality is made at the dairy farm. The composition and hygienic quality of milk is usually first determined in a number of tests on
∗Corresponding author. Tel.: +886 3 5381183x8483; fax: +886 3 5385353.
E-mail address: [email protected] (K.-S. Chang).
arrival at the processing plant. The results of these tests are indicative of raw milk quality and have direct bearing on the price paid for the milk. The following are the most common tests carried out on milk supplies: (1) taste and smell, (2) cleaning checks, (3) hygiene test, (4) somatic cell count, (5) bacteria count, (6) protein content, (7) fat content and (8) freezing point. Bacteria counts play a major role in determining the sanitary quality of milk on which grades are largely based. High bacteria counts are responsible for quality defects in pasteurized milk, Ultra high temperature sterilization (UHT) milk, whole milk powder and other milk products (Soler et al., 1995; Celestino et al., 1997; Beloti et al., 2002). For this reason, a 105CFU ml−1bacteria count upon arrival at the dairy processing plant is the critical limit
enforced through Directive 92/46 EEC (European Union,
1992). At the dairy processing plant, it is necessary to
0956-5663/$ – see front matter © 2005 Elsevier B.V. All rights reserved. doi:10.1016/j.bios.2005.07.015
adequately manage the raw milk received. High bacteria counts are responsible for quality defects in pasteurized milk. Management decisions are made relative to the possible processes to which the milk may be subjected. For example, a heat treatment may be needed during processing or an assessment of the capacity of the milk to stand for a long time may be required (Niza-Ribeiro et al., 2000). Conventional microbiological methods for determining bacteria counts in raw milk are time-consuming, taking up to two days. Additionally, a large number of tests lead to great expense due to labor, material costs and huge storage costs in the food industry. As a result, various rapid methods have been developed for the determination of bacteria counts in the past several decades, including ATP estimations (Niza-Ribeiro et al., 2000), direct epifluorescent filter technique (Rosmini et al., 2004) and electrical methods (Yang et al., 2004; Felice et al., 1999). The ATP method and epifluorescent filter method are fast but complicated. Electrical methods are simple but require an expensive instrument. Impedance microbiology (Firstenberg-Eden and Zindulis, 1984) was one of the earliest electrical methods for the detection of bacteria in foods, and has been developed as a rapid method that can detect bacteria within 24 h (Silley and Forsythe, 1996; Wawerla et al., 1999). It is based on the measurement of changes in electrical impedance of a medium or a reaction solution resulting from the growth of bacteria. The majority of previous studies on the determination of bacterial counts have focused on the modification of the medium, aiming at the optimization of the electrical signals (Easter and Gibson, 1985; Gibson, 1987; Ogden and Cann, 1987; Pettipher and Watts, 1989) or supporting the selective growth of target bacteria against other bacteria (Ogden, 1988). The impedance method was approved as an official method for the detection of Salmonella in foods by the Association
of Analytical Communities (AOAC) (Yang et al., 2004;
Salmonella in foods, 1996). Recent studies have focused on the separate measurements of impedance change in the electrode and medium components for the rapid detection of bacteria in foods (Yang et al., 2004; Laureyn et al., 2000; Ong et al., 2001; Futschik et al., 1988; Pless et al., 1994) known as impedance-splitting (IS) methods. Felice et al. (1999)
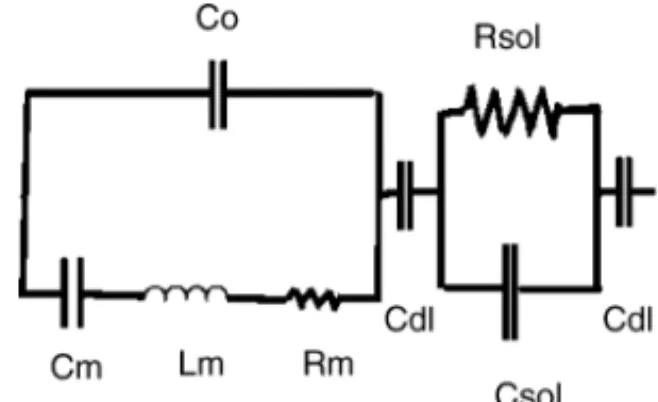
reported an IS method based on the measurement of the change in the electrode interface capacitance during bacteria growth for the quantification of bacteria in milk. Research has indicated that electrode impedance is an important component of the total impedance. Yoa et al. reviewed the characteristics of electrode-electrolyte interfacial impedances when a pair of electrodes was connected with a crystal in series (Yoa et al., 1994a). For sinusoidal inputs, the terminal characteristics of an electrode have both a resistive (Rsol) and a reactive (Csoland Cdl) component, where Rsolis
the reciprocal of the solution conductance, Csolis the
permit-tivity of the solution and Cdlis the double layer capacitance
between the electrodes and the fluid establishing contact with the electrode (Fig. 1) (Laureyn et al., 2000; Firstenberg-Eden and Zindulis, 1984). When a pair of electrodes was connected
Fig. 1. The equivalent circuit of the SPQC sensor. Cm, Lm, Rmand C0are the motional capacitance, motional inductance, motional resistance and static capacitance of the crystal. Rsolis the reciprocal of the solution conductance, Csolis the permittivity of the solution and Cdlis the double layer capacitance between the electrodes and the fluid establishing contact with the electrode.
to the crystal in series and was placed within the bacteria culture solution of interest, microbial metabolism typically decreased both the resistance and the capacitance of the culture solution (Felice et al., 1999), causing a variation of the Csol, Cdland Rsolof the circuit loop and thereby altering
the frequency of the oscillator. These features permit the use of such a system in the real-time monitoring of bacteria growth within a sealed opaque container.
Conventional conductivity and impedance measurement techniques have proved useful for bacteria counting in commercial applications (Felice et al., 1999; Silley and Forsythe, 1996). Devices based on these techniques monitor microbial metabolism in a growth medium by immersing electrodes directly into the medium and measuring the permittivity and/or conductivity (Ong et al., 2001). Despite their widespread application, these techniques have many disadvantages including polarization of the probe electrodes, decreased sensitivity of the device in more conductive media and the high cost of instruments used (Deak and Beuchat, 1993). By contrast, quartz crystal impedance systems appear very attractive because they work at very high frequency and hence have the potential to eliminate electrode polarization (Welsch et al., 1996). Recent studies detected the electrode impedance change by converting the signal to frequency change using a crystal oscillator (Qu et al., 1998; Zhang et al., 2002). The circuit components of a crystal are the motional capacitance (Cm), motional inductance (Lm), motional
resis-tance (Rm) and static capacitance (C0), respectively (Fig. 1).
The components Cm and Lm determine the resonance
frequency of the crystal. When a load capacitor (Cl) is
con-nected to the crystal in series, the frequency of the oscillator is increased by a frequency Df, where Df is Cm/2(C0+ Cl)
(Hafner, 1985; Vig, 1992). The frequency is decreased with the increase of Cl. As the load capacitance increases, the
frequency decreases. This crystal system is characterized by its low cost and compactness. However, it is limited by poor sensitivity (Qu et al., 1998; Zhang et al., 2002) and still requires several hours incubation time to perform a bacteria count (Zhang et al., 2002). In this study, we propose a remote measuring method to solve this problem. By this way, a real-time bacteria count in raw milk can be determined right
at the dairy farm which usually can not be executed until shipping to the dairy processing plant. It allows the hygienic quality to be ascertained before the arrival of raw milk at the dairy processing plant. Using this system, we believe it may be possible to enforce a critical control point (CCP) for bacteria in raw milk at the dairy farm. The application of remote field testing and measurement via the Internet has attracted enormous recent attention but its use has not been reported in the area of raw milk monitoring. Application in milk production for that allows assess to seamlessly shared data between systems and the ability to view test results instantly are not yet commercially available. This paper explores a system which dynamically monitors bacterial count data from a remote site on a web-page system. The system employs the LabVIEW 7.1 software for data acqui-sition, display and transmission of data obtained via a digital interface with a SPQC sensor. This system combines the features of Internet convenience, simple operation and com-pactness of a SPQC sensor to provide a rapid determination of bacteria concentration of raw milk at a remote site.
2. Materials and methods 2.1. Reagents and materials
Milk samples were directly sampled from the milk holding tank on a dairy farm in Hsinchu County (Hsinchu, Taiwan). The dairy farm is located within 1 km radius of Yuanpei University. To keep the raw milk samples as fresh as they were in the dairy farm, the temperature of the raw milk was maintained at 4◦C during the delivery. The raw milk
samples was pre-warmed at 37◦C for 10 min prior to the assay. Bacteria counts were performed within 30 min after the milk was collected from the dairy farm. Escherichia coli (ATCC 43886) obtained from the Food Industry Research and Development Institute (FIRDI, Hsinchu, Taiwan) was inoculated into nutrient broth (Difco) and incubated at 37◦C overnight. The milk sample volume was ca. 0.5 ml for each experiment. The electrodes were immersed in the reaction cell and connected to an 8 MHz quartz crystal. After each inoculation the cell cultures were incubated at 37◦C for 15 h and measurements were taken every minute. Spread plates were prepared from these dilutions and incubated at 37◦C for 24 h. All colonies were counted 24 h after they were incubated. The reaction cell was constructed from a Teflon cup (i.d. = 5 mm, l = 20 mm). A Teflon cover which held two identical gold electrodes (o.d. = 1 mm, l = 10 mm) with a cell constant of approximately 1 cm was fabricated in our labo-ratory. The AT-cut quartz crystal with 8 MHz frequency used in this study was obtained from the Tai Tien Electric Co., Ltd., Taiwan. All other reagents were of analytical grade.
2.2. Apparatus
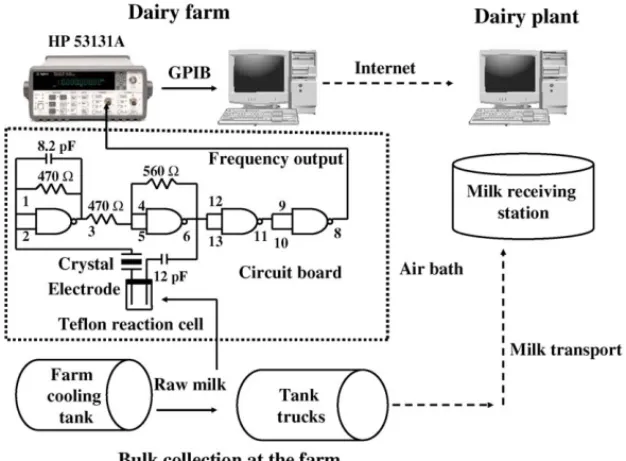
The series piezoelectric quartz crystal (SPQC) sensor was constructed by connecting an AT-cut piezoelectric crystal with 8 MHz frequency and a pair of gold electrodes in series. A homemade TTL oscillator was employed to drive the crystal.Fig. 2shows the experimental set-up. The oscillation signal was connected to a frequency counter with a coaxial cable (HP 53131A, Hewlett-Packard, USA). The signal from the frequency counter was coupled to a PC (Pentium 1.8 GHz) using a PCMCIA–GPIB interface (GPIB National
Fig. 2. Schematic diagram of the experimental set up for monitoring the growth of bacteria and model of a system for transfer of microbial information to dairy producers. Collection and delivery of milk by tanker can be divided into steps of loading the tanker via a hose to the outlet valve on the farm cooling tank, followed by transport by road to the delivery area. Monitoring of bacteria growth can be accomplished remotely during collection of raw milk using our system.
Instruments, Austin, TX, USA). Data acquisition and display were programmed using the LabVIEW 7.1 software package (National Instruments, Austin, TX, USA). The dynamic data was monitored on a web-page via the Internet.
2.3. Detection procedure
To eliminate cross contamination during bacteria concen-tration monitoring experiments, the Teflon reaction cell and electrodes were washed and rinsed with distilled water and sterilized at 121◦C for 15 min before each incubation and prior to immersion in any of the solutions. Then the raw (unsterilized) milk collected from the dairy farm was added to the reaction cell, which was then fitted with the electrodes. Unless otherwise stated, the milk sample volume was ca. 0.5 ml for each experiment. The electrodes were immersed in the reaction cell and connected to an 8 MHz quartz crys-tal. After each inoculation the cell cultures were incubated at 37◦C for 15 h and measurements were taken every minute. The sensor was placed in an air bath with precise temper-ature control within±0.2◦C. Frequency was displayed and recorded by the computer until the incubation was completed. The time until an initial small change in frequency occurred was defined as the detection time (DT). The detection times were plotted against the bacteria count determined by the plate count method for the solutions in a calibration graph. The hygienic quality was determined before the raw milk in tank trucks arrived at the dairy. For the determination of growth curve, a concentration of E. coli of ca. 108colony forming units per milliliter (CFU ml−1) in the nutrient broth was used to prepare ca. 101–102CFU ml−1 E. coli in the
commercial aseptic milk. The concentration of E. coli in the dilution was confirmed by both plate counting method and SPQC method. The growth curve of E. coli in this commer-cial aseptic milk at 37◦C was obtained by determining the bacterial counts of sample every 2–3 h.
3. Results and discussion
3.1. Description of the remote sensing system
Unlike event systems, remote monitoring/controlling of dynamic systems via the Internet is needed to avoid transmission bottlenecks in a real-time fashion. Our system solves this problem by using remote panels of LabVIEW 7.1 to provide control via the internet. LabVIEW is a graphical programming language used for development of applica-tions in automation, testing, measurement, data acquisition (DAQ), analysis and instrument control. When entering the LabVIEW program, the user first chooses the tool Menu bar, and then selects the Web publishing tool to configure the Web server root directory and Web Brower access. Users on the network can interact with the LabVIEW application running on their system through a standard Web browser window without the need for additional programming.
Entering only the Website server address allows the user to embed the front panel in a standard Web browser. Thereafter, designated users can control applications remotely from a standard Web browser without installing LabVIEW.
3.2. Frequency profile of the sensor in sterile milk
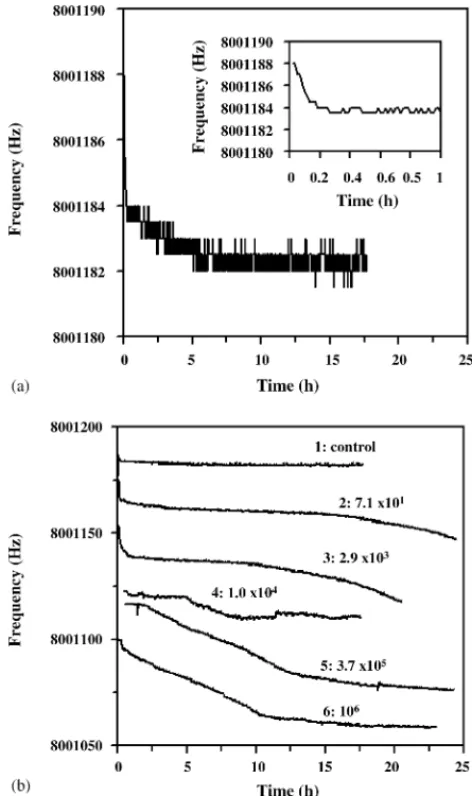
The frequency profile of the sensor when the electrodes were immersed in a reaction cell containing commercial aseptic milk was studied (Fig. 3(a)). The frequency decreased ca. 4 Hz (Fig. 3(a), Inset) during the first ten minutes due to the increasing temperature of the sample. Previous study has shown that the temperature increase in raw milk sample would result in the conductance increase and thereby the frequency decrease during bacterial count measurement (Eden and Eden, 1984). The frequency decreased slowly in the following 5 h with a total frequency drift of ca. 1 Hz. This decrease in frequency may be due to the protein adsorbed on the surface of the electrode leading to an increase in
Fig. 3. Frequency profile of the SPQC sensor when the electrodes were immersed in sterile milk (a) and raw milk sample (b). The sample volume was 0.5 ml and the sensor was placed in an incubator with the temperature precisely controlled at±0.2◦C.
the double layer capacitance (Cdl). Thereafter, the sensor
response remained stable for more than 10 h. The noise level of the sensor was±0.5 Hz and the relative frequency stability was 6.3× 10⁻⁸Hz based on the observed signal-to-noise ratio over an average period of 10 h. This result indicates that the physical and/or chemical factors unrelated to microbial growth of the milk only affect the frequency of the sensor at a negligible level.
3.3. Optimization of the bacterial growth monitoring system and frequency profile of bacteria in raw milk
A further study was carried out to investigate the effect of sample volumes of 0.2, 1.0 and 1.5 ml on the response of the sensor. As the sample volume increased, the fundamen-tal frequency of the SPQC sensor decreased but this did not influence the frequency profile of the detection. However, if the sample was larger than 1.5 ml, a longer time was required for the sensor to reach a steady state. In order to minimize the interference from the sample volume, an operation volume of ca. 0.5 ml was used for the following tests. The influence of the temperature on the response of the SPQC sensor was also studied. Previous studies (Aaku et al., 2004; Soler et al., 1995) have shown that total mesophilic counts (TMC) and total psychrotrophic counts (TPC) of aerobic organisms in raw milk range from 106to 3× 10⁷and from 4× 10⁵to 107CFU ml−1respectively. TMC is only two- to three-fold the TPC (Aaku et al., 2004; Soler et al., 1995). However, the metabolic activity produced by microbes at 37◦C yielded six-fold the activity of that produced at 5◦C (Gardea et al., 2002). In preliminary tests for this study, the SPQC system still works at low temperature (∼5◦C) that the milk is trans-ported at. However, longer time is needed than that at 37◦C for this system to obtain an optimal response. It would not be not possible to take quick corrective actions for milk pro-cessing using the SPQC used at the chilled temperatures used to transport the milk, as it would take too long for the sensor to give a result. Therefore, in the following study a higher temperature (37◦C) was used to facilitate the optimal growth of target organisms instead of the chilled temperatures used for the transport of milk.
Fig. 3(b) shows the frequency response of the sensor when the electrodes were immersed in reaction containing raw milk. The frequency decreases dramatically in the ini-tial period (ca. 30 min), then decreases slowly throughout the period of bacterial growth until a threshold time is reached and then the frequency starts to decrease rapidly. This result is not in agreement with the findings ofZhang et al. (2002). In their study, the growth of the bacteria led to an increase of the frequency. Nevertheless, our observations are consis-tent with those of Zhang et al. for two reasons. First, several lines of evidence have shown that when the electrodes are immersed in a low conductive solution, the frequency may decrease as the electrolytic conductivity increases (Yoa et al., 1994b). On the contrary, in a high conductive solution, the frequency may increase in response to the increase of
electrolytic conductivity. Zhang et al. used a culture medium containing 0.5% sodium chloride, which could be classified as a high electrolytic conductivity medium. Thus, the growth of the bacteria would consumes large amounts of nutrients leading to a quick increase in conductivity, thus producing an increase in the frequency response. However, raw milk was used as media in our experiments. The electrolytic con-ductivity of the media in our study could thus be classified as low. Therefore, it should be expected that a frequency decrease will be found in response to the growth of bacteria. A second reason our observations of a frequency decrease in response to bacterial growth are consistent with Zhang et al. is that the capacitance between the electrode and the amplifier affects the frequency change of the SPQC system (Yoa et al., 1994b). The frequency increases with increasing conductivity when the capacitance of the capacitor is greater than a critical value, whereas it decreases when the capaci-tor has a smaller value. Thus differences between our SPQC circuit design and that used by Zhang et al. could account for the different relation between bacteria growth and fre-quency change. As previously reported (Yang et al., 2004), the bacteria adsorbed on the surface of the electrodes leads to an increase in the Cdl, which may account for this drop
of frequency. Nevertheless, as shown in Fig. 3(b), when a concentration of 71 cells was initially inoculated into the reaction cell, a drop of 25 Hz occurred immediately. Since it is unlikely that cells died immediately and protein could not be adsorbed this fast, the rapid drop of frequency in the initial period might also be attributable to other parameters, e.g. the presence of somatic cells (Khayat and Richardson, 1986) and/or the separation of fat from the raw milk. The frequency drop continued throughout the period of bacte-rial growth but with a slower rate. The frequency drop was due to the adsorption of dead bacteria on the surface of the electrodes. The bacteria adsorbing on the surface of the elec-trodes leads to an increase in the Cdl, which may account for
this drop of frequency (Yang et al., 2004). When the bacte-ria concentration exceeded 106CFU ml−1(Fig. 3(b), line 6), the frequency could not reach a stable state. This is due to the initial concentration of bacteria exceeding the threshold level, as will be discussed in the next section.
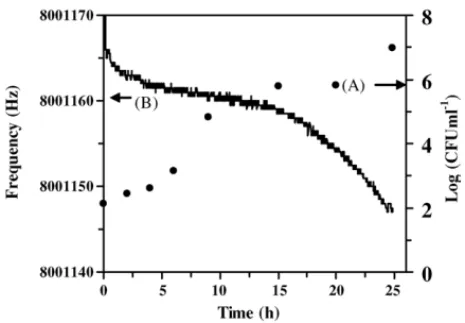
3.4. Detection time (DT) versus standard plate count Fig. 4shows an example plot of the frequency response (Fig. 4(B)) and growth curve (Fig. 4(A)) of an E. coli culture inoculums of 102CFU ml−1. The growth and the frequency response against time after E. coli inoculation was studied. The time required to identify readily detectable changes (DT) provides an approximate measure of the number of microbial organisms in the initial inoculums. The initial small change in frequency (DT) occurred in the 7th hour (line B) when the cell concentration reached 105–106CFU ml−1(called the microbial threshold level), which was less than the range usu-ally determined using the conventional impedance method (Easter and Gibson, 1989). Hence, the detection time of the
Fig. 4. Growth (A) and frequency response curves (B) of E. coli in asep-tic milk at 37◦C using the SPQC sensor with inoculums of approximately 102CFU ml−1. The sample volume was 0.5 ml and the sensor was placed in an incubator with the temperature precisely controlled at±0.2◦C.
proposed sensor is shorter than that of sensors designed based on the conventional impedance method. Compared with the growth curve (line A) of E. coli in milk, the DT occurred at the initial stationary phase. The sensor response remained stable during the early period of incubation for several rea-sons. First, a typical pure culture of bacteria does not initially undergo a significant increase in population. This is due to low population densities as the bacteria adapt to their new environment, and is called the lag period of growth. The lag phase in this experiment was less than 2 h as shown in
Fig. 4(A). Second, following the lag period an explosive phase of exponential population growth occurs. In the expo-nential phase the living bacteria population increases rapidly with time, with an exponential growth in numbers. Although the bacteria multiplied at a maximal rate, the concentration of bacteria in this period was still much lower than that at the stationary phase. Therefore, the concentration of bacte-ria in the media was not high enough to cause a significant increase in conductance of the electrode. In this case, fre-quency would not be markedly changed during this period. Third, the frequency of the SPQC sensor decreases rapidly during the initial stationary phase. During this phase, new organisms are constantly being produced while other organ-isms are dying so that the birth rate equals the death rate. The fragments of dead bacteria adhere on the surface of the electrode, leading to an increase in Cdl, and thereby
decreas-ing the frequency. In addition, durdecreas-ing the stationary phase, the microorganism concentration was high enough to pro-duce a large amount of ions, leading to increased conductance in the reaction cell and resulting decreased frequency of the SPQC sensor. Substrates in microbiological growth media are generally uncharged or weakly charged. They are normally transformed into highly charged end products following the organism’s normal metabolic pathways. Simple examples include the conversion of glucose from a non-ionized sub-strate to two molecules of lactic acid or the conversion of protein to several molecules of peptide and ammonic acid
with a corresponding increase in conductivity. Finally the last phase of growth is the death phase. In this period the overall number of organisms decreases so the death rate is greater than the birth rate. The living bacteria population decreases with time during this phase due to a lack of nutrients and the accumulation of toxic metabolic by-products. In addition to growth curves for E. coli as illustrated inFig. 4, the growth curves of many bacteria, including B. subtilis, B. cereus,
Enterobacter aerogenes, Staphylococcus aureus, Salmonella typhinuruni, Streptococcus lactis and Pseudomonas aerugi-nosa, were also determined. These microorganisms comprise
species of genera that are normally associated with milk (Aaku et al., 2004). Except for S. lactis, the frequency pro-files of these bacteria (data not shown) were similar to that of E. coli (Fig. 4). The results demonstrated that the SPQC sensor can indiscriminatively monitor the growth of most of the bacteria tested in this study which represent an adequate spectrum of bacteria species for field testing of milk contam-ination (Except for S. lactis, however inability to monitor S.
lactis is not a problem because it comprises only a small
per-centage of contaminants). This is an essential feature for our SPQC sensing system, because, in milk, there are numerous different genera of bacteria, each of which has its own rate of metabolism and growth curve. Based on the Directive 92/46 EEC, a regulation on milk quality of the European Union (European Union, 1992), a critical limit of 105CFU ml−1 bacteria counts in raw milk is strictly forbidden upon arrival at the dairy processing plant. Using our SPQC sensing system the total bacterial counts in different raw milk samples may be quickly and precisely determined on site. The informa-tion about the quality of raw milk can be transmitted via the Internet and allow the dairy processing plant to adequately manage the raw milk received.
3.5. Detection of bacteria concentration in raw milk
If psychotrophs and mesophilics are combined for exam-ple, the frequency changes of the SPQC as will be affected by the superimposed growth curves and metabolism changes of the different organisms and their different concentrations. However, previous studies (Aaku et al., 2004; Soler et al., 1995) have shown that total mesophilic counts (TMC), which include coliform in raw milk usually about two- to three-fold the total psychrotrophic counts (TPC). Soler et al. (1995)
also found that counts of psychrotrophs was closely corre-lated with the total mesophilic counts. Since psychotrophs would grow more slowly than mesophilics at higher tempera-ture, the metabolism changes of the psychotrophs would have only a negligible influence on the frequency shift of the SPQC system. These relationships allow us to determined the total mesophilic counts in raw milk at higher temperature and rely on the correlation between total mesophilic counts (TMC) and total psychrotrophic counts (TPC) of aerobic organisms in raw milk (Soler et al., 1995) to provide an estimate of psychotropic counts. On the other hand, although a large amounts of psychrotrophic bacteria may grows in raw milk
after extending storage at low temperature. However, they can be easily detected by our SPQC system even though psy-chotrophs grow more slowly than mesophiles at higher tem-perature. Because a significant level of extracellular enzymes appears when large amount of psychrotrophs appear in the
raw milk (Sorhaug and Stepaniak, 1991; Manzano et al.,
2005). These enzymes can degrade milk proteins and increase the conductivity of samples. The quantity of these enzymes correlates with the breakdown of milk with a correspond-ing sharply increase in conductivity.Felice et al. (1999)and
Gnan and Luedecke (1982)used impedance system to detect the total microbial count at 37◦C and reported calibration curves with correlation coefficients range from −0.78 to
−0.88 between the impedance change time and the initial
concentration of bacteria in milk. Although these correlation coefficients are not very high, these studies raise the possi-bility that the initial concentration of bacteria in raw milk can be determined by the impedance change time even the psychotrophs and mesophilics are combined in the sample. Therefore, we decide to monitor the bacteria counts at 37◦C in the following experiment to obtain a more rapid response. The genera of bacteria differ from dairy farm to dairy farm, but only several genera of bacteria is likely to show predomi-nance in all milk samples from the same dairy farm (Soler et al., 1995; Aaku et al., 2004). In order to avoid confounding due to inter-farm variation in contamination, all the raw milk samples in this study were obtained from the same dairy farm.
Fig. 3(b) shows the frequency response curves of the SPQC sensor for various concentrations of bacteria in milk at 37◦C. The elapsed time before the frequency began to decrease was related to the number of microbial organisms in the milk sam-ple. In the preliminary experiment, a greater frequency drop was observed when the solutions had higher initial bacteria levels. However, many parameters could affect the frequency profile in the initial period once the raw milk was placed into the reaction cell, including temperature, initial ion concentra-tion (Yoa et al., 1994b), somatic cell (Khayat and Richardson, 1986) and/or the separation of fat from the raw milk. The fre-quency fluctuated rapidly and all curves cannot be expected to originate at the same frequency when the solutions had more initial bacteria. Therefore, we collected data starting from the 30th minute after placing raw milk in the reaction cell.
Fig. 5(a) shows the scattergrams of detection times against the logarithm of the initial bacteria concentration of the sam-ples. The data revealed a linear relationship when the log of the concentration of bacteria (from 70 to 106CFU ml−1) was plotted against the frequency detection time. The regres-sion equation was Y = 0.2314–5.8007X over the range of 70 to 106CFU ml−1and a correlation coefficient (R2) of 0.9165 was obtained. This high correlation strongly suggests the suit-ability of our sensor for this application. However, further work is required to plot the calibration curves for raw milk samples from different dairy farms with this SPQC system to confirm its reliability. The graph illustrates the relation-ship between microbial numbers in the sample and detection time (DT). The time from the inoculation to the initial small
Fig. 5. (a) Scattergrams of detection times against the logarithm of the initial bacteria concentration in raw milk. (b) Scattergrams of the rate of frequency decrease (between the 3rd and 4th hour) against the logarithm of the initial bacteria concentration in raw milk. The sample volume was 0.5 ml and the sensor was placed in an incubator with the temperature precisely controlled at±0.2◦C.
change in frequency was exponentially related to the num-ber of microbial organisms inoculated. Additionally, when the bacteria concentration was lower than 100 CFU ml−1, the relationship between the bacteria concentration and fre-quency detection time became non-linear (data not shown). This was due to the uneven distribution of the bacteria growth in the cell culture, which prevented the system from perform-ing accurate measurements for lower bacteria concentrations. This finding is in agreement with previous experiments using conventional impedance systems (Firstenberg-Eden, 1983; Hardy et al., 1977; Gnan and Luedecke, 1982; Martins and Selby, 1980). Further studies involving pre-inoculation of the sample before testing for lower bacteria concentrations may help elucidate whether these sensitivity limitations can be overcome (Firstenberg-Eden and Zindulis, 1984). As shown inFig. 3(b), line 6, the frequency could not reach a stable state when the concentration of bacteria exceeded 106CFU ml−1. This is because the microorganism concentration reached the threshold value before the sensor reached a steady state in cultures with high concentrations of bacteria. Comparison of the results of the present study with those of a previous study using a similar system (Qu et al., 1998) revealed that the sensor had 300-fold greater sensitivity for bacterial con-centration determination. Furthermore, our study monitored
the growth of bacteria in a commercial raw milk sample and no other reagents were required for performing mea-surement. By contrast, the addition of Tachyples amebocyte lysate (TAL) was required in the study ofQu et al. (1998).
The initial concentration of microbial organisms in milk can also be determined by calculating the decrease in the fre-quency rate using the proposed SPQC sensor. As shown in
Fig. 5(b), the rate of frequency decrease was relative to the log of the concentration of bacteria. This finding is similar to the results of previous experiments using a conventional capaci-tance detection system (Felice et al., 1999) and conductance detection system (Cousins and Marlatt, 1990), but is not in agreement with results using an impedance detection system (Yang et al., 2004;Firstenberg-Eden, 1983).Fig. 5(b) shows the scattergrams of the decrease in frequency rate (between the 3rd and 4th hour) against the logarithm of the initial bacteria concentration of the samples. A poor correlation coefficient (R2) of 0.6491 was obtained, making it difficult to determine the relationship between the rate of frequency decrease and bacterial concentration between the 3rd and 4th hour. Nevertheless, the rate of frequency decrease of 3 Hz h−1 found was sufficient to classify a batch of raw milk samples into pass/fail groups in accordance with the requirements of the HACCP system (European Union, 1992). The frequency decreased moderately when the bacteria concentration was lower than 105CFU ml−1, but decreased rapidly (more than 3 Hz h−1) when the initial bacteria concentration was higher than 105CFU ml−1. Accordingly, the decreasing frequency rate of 3 Hz h−1was selected as the cutoff limit for classify-ing a batch of raw milk samples into pass/fail groups. The initial bacteria concentration can be estimated by comparing the rate of decrease in frequency with the cutoff limit. The rapid decrease in frequency at high concentrations of bacteria culture is attributable to the fact that raw milk held at refriger-ation temperatures for several days before processing invari-ably shows the presence of bacteria of several of the following genera: Enterococcus, Proteus, Lactococcus, Streptococcus,
Leuconostoc, Lactobacillus, Microbacterium, Propionibac-terium, Micrococcus, Pseudomonas, Bacillus and coliforms
(Aaku et al., 2004). Extended refrigerated storage of raw milk allows growth of psychrotrophic bacteria, which pro-duce large amounts of proteases and lipases (Sorhaug and Stepaniak, 1991; Manzano et al., 2005). Significant levels of extracellular enzymes appear when bacteria counts exceed 106CFU ml−1(Manzano et al., 2005). The quantity of these enzymes correlates with the breakdown of milk to shorter peptides and ammonic acid with a corresponding increase in conductivity. Therefore, the frequency decreases rapidly when the initial bacteria concentration is high. Interestingly, as shown inFig. 3(b), there was an approximately 150 Hz dif-ference between six logs of growth. However, inFig. 4(B), there was only a 20 Hz difference when the concentration of bacteria in solution increased from 102to 107CFU ml−1(six logs). This phenomenon may be explained by the observa-tion that all curves cannot be expected to originate at the same frequency because many parameters could affect the initial
frequency once the raw milk was placed into the reaction cell, including temperature, initial ion concentration (Yoa et al., 1994b), somatic cell (Khayat and Richardson, 1986) and/or the separation of fat from the raw milk. Although the detec-tion system used in this study was only set up once and was reused for all measurements of raw milk (not dilutions), the differences in fundamental frequency between each experi-ment were not associated with the concentration of bacteria in solution.
3.6. Comparison of ATP estimation with the SPQC method for bacteria concentration determination
In the application of an HACCP system to milk produc-tion, control of bacteria in milk from different sources is a critical control point (Niza-Ribeiro et al., 2000). ATP biolu-minescence was reported suitable for rapid monitoring of bacteria concentration in raw milk at its reception in the dairy plant (Niza Riobeiro et al., 2000). Comparison of the results obtained from the proposed SPQC method with that of the ATP estimation method (Niza Riobeiro et al., 2000) revealed that the SPQC method is a sensitive but slow method for bacteria concentration determination. Although the pro-posed SPQC method was slower than the ATP method, it possesses several advantages over the ATP method. (1) The SPQC method requires only a small quantity of reagents and does not require any special preparation. (2) A real time and completely automated procedure are possible in combination with a web-page through Internet. (3) The proposed SPQC sensor is suitable for rapid monitoring of bacteria concentra-tion in raw milk, at the dairy farm instead of at recepconcentra-tion in the dairy plant (Niza Riobeiro et al., 2000). The frequency profile of the sensor can be monitored in real-time by the plant on a web-page via the Internet during transport. The use of our SPQC sensor would enable the plant to ensure via the Internet that it would obtain hygienic quality raw milk before the arrival of tank trucks at the dairy plant. Since sev-eral hours may be required for raw milk to be collected in tank trucks before transport to the processing plant, remote assessment of the quality of the raw milk allows appropriate decisions concerning the milk processing to be made before transport and delivery.
4. Conclusions
This study presents a novel design for a remote series quartz crystal sensor for bacteria population monitoring. The system can determine the viable bacteria concentration in milk by the frequency change of the sensor. Both the detec-tion time method and the rate of frequency decrease can be used for determination of the initial bacteria concentration. The former method is more accurate, while the later method is faster. The major reason for the frequency decrease after inoculation was considered to be adherence of the fragments of dead bacteria on the surface of the electrode leading to an
increase in Cdl. Compared with conventional bacteria plating
methods and the ATP estimation method, this technique is rel-atively simple and, therefore, does not require the expertise of highly skilled technicians. Another important advantage of our sensor is that it can provide dynamic data from a remote site via the Internet. This enables the milk manufacturer to monitor the growth of bacteria on a web-page via the Internet when the raw milk was collected in the dairy farm.
Acknowledgement
The authors would like to thank the National Science Council of the Republic of China for financially supporting this research under Contract No. NSC-93-2113-M-264-001.
References
Aaku, E.N., Collison, E.K., Gashe, B.A., Mpuchane, S., 2004. Micro-biological quality of milk from two processing plants in Gaborone Botswana. Food Control 15, 181–186.
Beloti, V., Barros, M.A.F., Nero, L.A., Souza Pachemshy, J.A., Santana, E.H.W., Franco, B.D.G.M., 2002. Quality of pasteurized milk influ-ences the performance of ready-to-use systems for enumeration of aerobic microorganisms. Int. Dairy J. 12, 413–418.
Celestino, E.L., Iyer, M., Roginski, H., 1997. The effects of refrigerated storage of raw milk on the quality of whole milk powder stored for different periods. Int. Dairy J. 7, 119–127.
Cousins, D.L., Marlatt, F., 1990. An evaluation of a conductance method for enumeration of Enterobacteriaceae in milk. J. Food Prot. 53, 568–570.
Deak, T., Beuchat, L.R., 1993. Comparison of conductimetric and tradi-tional plating techniques for detecting yeasts in fruit juices. J. Appl. Bacteriol. 75, 546–550.
Easter, M.C., Gibson, D.M., 1989. Detection of microorganisms by elec-trical measurements. In: Adams, M.R., Hope, C.F.A. (Eds.), Rapid Methods in Food Microbiology, vol. 26. Elsevier, Amsterdam, p. 70. Easter, M.C., Gibson, D.M., 1985. Rapid and automated detection of
Salmonella by electrical measurements. J. Hygiene 94, 245–262. Eden, G., Eden, R., 1984. Enumeration of microorganisms by their AC
conductance patterns. IEEE Trans. Biomed. Eng. 31, 193–198. European Union, 1992. Council Directive 92/46/EEC of 16 June 1992.
Laying down the health rules for the production and placing on the market of raw milk heat-treated milk and milk based products. Official Journal L 268, 1–34.
Felice, C.J., Madrid, R.E., Olivera, J.M., Rotger, V.I., Valentinuzzi, M.E., 1999. Impedance microbiology: quantification of bacterial content in milk by means of capacitance growth curves. J. Microbiol. Methods 35, 37–42.
Firstenberg-Eden, R., 1983. Rapid estimation of the number of microor-ganisms in raw meat by impedance measurement. Food Technol. 37, 65–70.
Firstenberg-Eden, R., Zindulis, J., 1984. Electrochemical changes in media due to microbial growth. J. Microbiol. Methods 2, 103–115. Futschik, K., Pfutzner, H., Doblander, A., Asperger, H., 1988. Automatic
registration of microorganism growth by a new impedance method. Abstr. Int. Meet. Chem. Eng. Biotechnol. Achema 88, 3.
Gardea, A.A., Carvajal-Millan, E., Higuera-Ciapara, I., Figueroa, C., Molina-Corral, J., Rascon, A., Orozco, A., Inda, A., 2002. Calorimet-ric assessment of microbial growth in milk as affected by different conditions. Thermochim. Acta 394, 179–184.
Gibson, D., 1987. Some modification to the media for rapid automated detection of Salmonellas by conductance measurement. J. Appl. Bac-teriol. 63, 299–304.
Gnan, S., Luedecke, L.O., 1982. Impedance measurements in raw milk as an alternative to the standard plate count. J. Food Prot. 45, 4–7.
Hafner, E., 1985. Resonator and device measurements. In: Gerber, E.A., Ballato, A. (Eds.), Precision Frequency Control, vol. 2. Academic Press, pp. 1–44.
Hardy, D., Kraeger, S.J., Dufour, S.W., Candy, P., 1977. Rapid detection of microbial contamination in frozen vegetables by automated impedance measurements. Appl. Environ. Microbiol. 34, 14–17.
Khayat, F.A., Richardson, G.H., 1986. Detection of abnormal milk with impedance microbiology instrumentation. J. Food Prot. 49, 519– 522.
Laureyn, W., Nelis, D., Van Gerwen, P., Baert, K., Hermans, L., Magnee, R., Pireaux, J.J., Maes, G., 2000. Nanoscaled interdigitated titaniu m electrodes for impedimetric biosensing. Sens. Actuators B 68, 360–370.
Manzano, S., Ordonez, J.A., Hoz, L., Fernandez, M., 2005. A rapid method for the estimation of the microbiological quality of refriger-ated raw milk based on the aminopeptidase activity of Gram-negative bacteria. Int. Dairy J. 15, 79–84.
Martins, S.B., Selby, M.J., 1980. Evaluation of a rapid method for the quantitative estimation of coliforms in meat by impedimetric proce-dure. Appl. Environ. Microbiol. 39, 518–524.
Niza-Ribeiro, J., Louza, A.C., Santos, P., Lima, M., 2000. Monitoring the microbiological quality of raw milk through the use of an ATP bioluminescence method. Food Control 11, 209–216.
Ogden, I., Cann, D., 1987. A modified conductance medium for the detec-tion of Salmonella spp. J. Appl. Bact. 63, 459–464.
Ogden, I., 1988. A conductance medium to distinguish between Salmonella and Citrobacter spp. Int. J. Food Microbiol. 7, 287– 297.
Ong, K.G., Wang, J., Singh, R.S., Bachas, L.G., Grimes, C.A., 2001. Monitoring of bacteria growth using a wireless, remote query resonant-circuit sensor: application to environmental sensing. Biosens. Bioelectron. 16, 305–312.
Pettipher, G.L., Watts, Y.B., 1989. Effect of carbohydrate source in selen-ite cystine trimethylamine oxide broth on the detection of Salmonellas using the bactometer. Lett. Appl. Microbiol. 9, 241–242.
Pless, P., Futschik, K., Schope, E., 1994. Rapid detection of Salmonellae by means of a new impedance-splitting method. J. Food Prot. 57, 369–376.
Qu, X., Bao, L., Su, X., Wei, W., 1998. A new method based on gelation of tachypleus amebocyte lysate for detection of Escherichia coliform using a series piezoelectric quartz crystal sensor. Anal. Chim. Acta 374, 47–52.
Rosmini, M.R., Signorini, M.L., Schneider, R., Bonazza, J.C., 2004. Eval-uation of two alternative techniques for counting mesophilic aerophilic aerobic bacteria in raw milk. Food Control 15, 39–44.
Salmonella in foods, 1996. Automated conductance method: AOAC Offi-cial Method 991.38. In: OffiOffi-cial Methods of Analysis of AOAC International, 16th ed. Association of Analytical Communities Inter-national, Gaithersburg, MD.
Silley, P., Forsythe, S., 1996. Impedance microbiology—a rapid change for microbiologists. J. Appl. Bacteriol. 80, 233–243.
Soler, A., Ponsell, C., Paz, M.D., Nunez, M., 1995. The microbiologi-cal quality of milk produced in the Balearic Island. Int. Dairy J. 5, 69–74.
Sorhaug, T., Stepaniak, L., 1991. Microbial enzymes in the spoilage of milk and dairy products. In: Fox, P.F. (Ed.), Food Enzymology, vol. 1. Elsevier, London, pp. 169–218.
Vig, J. R., 1992. Crystal unit equivalent circuit. In: Introduc-tion to Quartz Frequency Standards, Electronics and Power Sources Directorate Fort Monmouth, U.S.A. http://www.ieee-uffc.org/freqcontrol/quartz/vig/vigtoc.htm.
Welsch, W., Klein, C., von Schickfus, M., Hunklinger, S., 1996. Devel-opment of a surface acoustic wave immunosensor. Anal. Chem. 68, 2000–2004.
Wawerla, M., Stolle, A., Schalch, B., Eisgruber, H., 1999. Impedance microbiology: applications in food hygiene. J. Food Prot. 62, 1488–1496.
Yang, L., Li, Y., Griffis, C.L., Johnson, M.G., 2004. Interdigitated microelectrode (IME) impedance sensor for the detection of viable Salmonella typhimurium. Biosens. Bioelectron. 19, 1139–1147.
Yoa, S., Chen, K., Liu, D., Nie, L., 1994a. Circuit network analysis method applied to surface acoustic wave impedance system in liquids. Anal. Chim. Acta 294, 311–318.
Yoa, S., Chen, K., Zhu, F., Shen, D., Nie, L., 1994b. Surface acoustic wave sensor system for the determination of total salt content in serum. Anal. Chim. Acta 287, 65–73.
Zhang, S., Wei, W., Zhang, J., Mao, Y., Liu, S., 2002. Effect of static magnetic field on growth of Escherichia coli and relative response model of series piezoelectric quartz crystal. Analyst 127, 373–377.