Mode Distinction and Radiation-Efficiency Analysis
of Planar Leaky-Wave Line Source
Yu-De Lin,
Member, IEEE,and Jyh-Wen Sheen
Abstract—Using the first microstrip-line higher order mode as
an example, mode distinction and radiation efficiency of leaky-wave line sources in the radiation region are presented in this paper. The spectral-domain approach is used to calculate complex power flows, leaving the line source in the transverse directions and those guided down the line source. By observing the behavior of these complex power flows in different frequency regions, the leaky-wave line source can be distinguished into the antenna mode and the reactive mode in the radiation region. Experimental results are shown to confirm this mode distinction. Moreover, by comparing the power carried away by the surface and the space waves, radiation efficiency of the first microstrip-line higher order mode of various structural parameters is analyzed. The microstrip line is more efficient as a leaky-wave line source when its substrate is thin, the dielectric constant of the substrate is low, and the antenna main beam is away from the end-fire direction.
Index Terms— Leaky-wave antenna, first microstrip-line higher-order mode, radiation efficiency, space wave, surface wave.
I. INTRODUCTION
D
UE to their simplicity in fabrication, the leaky modes of uniform open waveguides are very suitable for high millimeter-wave antenna applications. There are two ways to create the leaky modes of a uniform open waveguide. One is the employment of the higher order modes of the structure. The other is by periodically creating longitudinal perturbations. Possible applications of uniform open-waveguide leaky modes as a leaky-wave antenna have been intensively investigated both theoretically and experimentally in [1]–[8]. In [1], ex-perimental verification of a microstrip-line higher order mode leaky-wave antenna was conducted without explaining the physics underlying the design of the antenna. In [2], [3], Oliner explained the physics underlying the leaky-wave antenna design constructed in [1], and presented analysis data for the antenna design. In [4], a two-dimensional (2-D) scanning linear phased array is proposed and analyzed by a tee network in a transverse resonance method. This leaky-wave line sourceManuscript received December 12, 1995; revised June 20, 1997. This work was supported in part by the National Science Council under Grants NSC 85-2221-E-009-030 and NSC 84-NSPO-A-RDD-009-01.
Y.-D. Lin is with the Institute of Communication Engineering, National Chiao Tung University, Hsinchu, Taiwan, R.O.C.
J.-W. Sheen was with the Institute of Communication Engineering, National Chiao Tung University, Hsinchu, Taiwan, R.O.C. He is now with Computer and Communication Laboratories, Industrial Technology Research Institute (ITRI), Hsinchu, Taiwan, R.O.C.
Publisher Item Identifier S 0018-9480(97)07101-9.
of phased array is a modified printed-circuit version of offset-groove-guide leaky-wave antenna in [5]. In [6], space-wave leakage phenomena from higher order modes on various planar transmission-line structures with conductor sidewalls were investigated.
There is much effort made to obtain the complex propaga-tion constants of leaky modes of uniform open waveguides. In [5], the mode-matching method and the transverse equivalent network were used. In [7], [9], the familiar spectral-domain analysis was used, with the appropriate choice of branch cuts and integration contours. In [7], the propagation region of the microstrip-line higher order modes is divided into three frequency regions with decreasing frequency:
1) bound-mode region;
2) surface-wave region, where the guided mode leaks power into the surface wave supported by the sur-rounding dielectric waveguide;
3) radiation region, where the guided mode leaks power into the space wave as well as into the surface wave. When the phase constant of the guided mode in the leaky-wave line source is smaller than that of the free-space wavenumber, the mode is in the radiation region [2], [7]. In [3], Oliner pointed out that the first microstrip-line higher order mode in the radiation region with a larger attenuation constant is reactive and below cutoff, and has a different mode nature from that with a smaller attenuation constant. Therefore, this radiation-frequency region can further be divided into two regions with decreasing frequency: the antenna-mode region where most of the guided power leaks away in the forms of space wave and surface wave, and the reactive-mode region, where most of the power is reflected back to the feed line. In design of leaky-wave antennas, this distinction of mode nature in the radiation region is essential since the antenna efficiency is low in the reactive-mode region. In [8], feeding structures are designed for the excitation of the first microstrip-line higher order mode. Experimental results show that in the radiation region, there is the antenna-mode region and the reactive-mode region, as described above.
As mentioned above, a planar leaky-wave line source leaks power into the space and surface waves in the radiation region. How the leaked power is divided into these two forms of leaky waves determines the radiation efficiency of the leaky-wave line source under study. If most of the power is coupled to the space wave, the line source is an efficient leaky-wave antenna. Rather, if most of the power is coupled to the surface wave, the line source is not very efficient, which leads 0018–9480/97$10.00 1997 IEEE
to undesired crosstalk with neighboring circuits. Therefore, analysis of radiation efficiency is essential in the design of the leaky-wave antenna. There are few research results concerning the radiation efficiency of planar leaky-wave line sources. In [10], Lee uses the mode-matching method to analyze the radiation efficiency of a microstrip line with a top cover. For convenience, the dielectric layer in the outside region of the microstrip line is neglected, and the radiation efficiency is obtained by the ratio of the power radiated into the TEM mode to the total radiated power. Thus, the analysis in [10] is only an approximation and not rigorous. Also, Lee’s statement that the total radiated power is almost all in the form of a space wave in the radiation region when the thickness between the ground plane and the top cover is very large is not entirely correct in some cases. In this paper, we will use a rigorous approach to analyze the radiation efficiency of the microstrip-line leaky-wave antenna by comparing the amount of power being radiated into the space and surface waves, respectively. The analysis is similar to that used to analyze the radiation loss and the surface-wave loss of microstrip discontinuities in [11]. Also, the mode nature in different frequency regions will be distinguished by examining the power propagating in different directions. In Section II, the spectral-domain approach is employed to calculate the fields. Under the assumption that there is no wave mutual reaction in the far-field region, the fields corresponding to the excited surface and space waves can be obtained, respectively, by an appropriate choice of integration paths. In Section III, complex power flows propagating toward different directions in the radiation region are used to distinguish the mode nature in different frequency regions. An experiment is also performed to confirm this mode distinction. In Section IV, the radiation efficiency associated with the geometric parameters and the antenna main-beam direction will be discussed.
II. CALCULATION OF FIELDS AND POWER FLOWS
A. Calculation of Total Fields
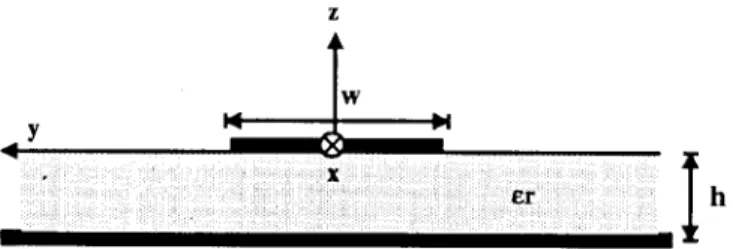
For the microstrip line shown in Fig. 1, the fields are given by the following equations:
(1)
(2)
Fig. 1. Geometric configuration of the microstrip line.
where is the observation point, is the
source point, , are the spectral variables in the -and -direction, is the spectral-domain Green’s function due to infinitesimal electric dipole, which can be derived by the procedure described in [12], is the function of the transverse variation of currents on microstrip line, and and are the phase and attenuation constants of the first microstrip-line higher order mode. The propagation constant and the transverse variation of currents are precalculated by the familiar spectral-domain approach [13] before the evaluation of the fields. After simplification, the fields on the observation plane at are as follows:
(3)
(4) where is the Fourier transform of .
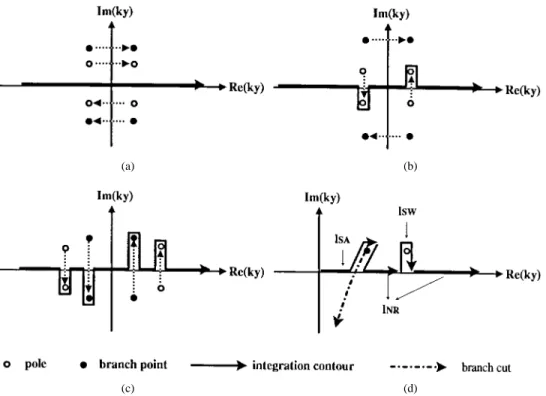
In order to correctly obtain the total fields, the integration contours in (3) and (4) must be properly chosen to satisfy the physical conditions in different propagation regions. Fol-lowing the analysis described in [7] and [14], we can obtain these integration contours, shown in Fig. 2, by requiring the continuity of the solutions when the material loss is changed from a high-loss case to a low-loss limit. Here, we denote as the propagation constant of the surface wave supported by the surrounding dielectric waveguide and as the free-space wavenumber. In the bound-mode region , the migration of the surface-wave poles and the branch points when the material loss is changed from a high-loss case to a low-loss limit is shown in Fig. 2(a). No deformation of the integration contour is needed to ensure the continuity of the
solutions. In the surface-wave region , the
situation is as shown in Fig. 2(b). The surface-wave poles move from quadrants II and IV to quadrants III and I. The integration contour has to be deformed as shown to assure the continuity of the solutions. In the radiation region , the situation is as shown in Fig. 2(c). The surface-wave poles
(a) (b)
(c) (d)
Fig. 2. Spectral integration contours and migration paths of poles and branch points for different propagation regions. (a) Bound-mode region. (b) Surface-wave region. (c) Radiation region. (d) Spectral integration contours and branch cut in the right-half ky-plane used to calculate the constituent fields in the radiation region.
and the branch points move from quadrants II and IV to quadrants III and I, respectively. The choice of the branch cut and the deformation of the integration contour in the right-half -plane are shown in Fig. 2(d). The corresponding choice of the branch cut and the deformation contour in the left-half -planes follows the same reasoning. In the radiation region, the portion of the deformed integration path , shown in Fig. 2(d), corresponds to the excitation of surface waves supported by the surrounding dielectric waveguide. The portion of the deformed integration path , shown in Fig. 2(d), corresponds to the excitation of space waves in the open medium. For the movement of poles and branch points and the choice of branch cut, more details can be found in [7].
B. Calculation of the Constituent Fields
If the observation point is in the far-field region and no field interaction is assumed, the total fields can be classified according to their propagation properties as the excited surface and space waves, respectively. These outgoing traveling waves contribute to the total field by including some portions of a plane-wave spectrum in the spectral-domain integration contour. In the following analysis, superscript denotes the surface wave, superscript denotes the space wave, superscript denotes the nonradiative wave, and superscript denotes the total waves including the surface, space, and nonradiative waves, respectively. The fields due to the excited surface wave can be obtained from the residues in (3), (4) by choosing the integration contour in the right-half -plane in Fig. 2(d). The corresponding choice of the integration contour in the left-half -plane follows the same reasoning.
They are in the form of
(5)
(6)
where .
In calculating the fields in the radiation region, the choice of branch cut in the right-half -plane, as shown in Fig. 2(d), is arbitrary, but it must obey the following two constraints. First, the cut must approach infinity asymptotically along the negative imaginary axis. Second, the cut must pass through quadrant I and then cross the real axis to quadrant IV [15]. Such cuts do not separate the spectral sheet from the non-spectral sheet in the complex -plane. The spectral sheet and the nonspectral sheet are defined by letting
(a) (b)
(c)
Fig. 3. Closed contours used to find the finite power flows toward different directions.
in the spectral-domain Green’s functions and is defined as [12]. The plane-wave spectrum lying on the spectral sheet satisfy the radiation condition (fields exponentially decrease upwardly), but those on the nonspectral sheet do not (fields exponentially increase upwardly). In order to calculate the fields due to the excited space waves, the branch cut must be properly chosen to separate these fields from those contributed by other excited waves. Therefore, the plane-wave spectrum lying on the nonspectral sheet defined by contributes to the excited space wave. The fields due to the excited space wave can be obtained by choosing the integration path in the right-half -plane as shown in Fig. 2(d), and are expressed as
(7)
(8) For the sake of convenience in numerical integration, the branch cut in Fig. 2(d) is chosen as a vertical line starting from the branch point. The fields corresponding to the nonradiative waves can be obtained by choosing the integration path in the right-half -plane, as shown in Fig. 2(d). The planar-wave spectrum of the nonradiative planar-waves does not contribute to outgoing waves. These fields decrease exponentially in the
transverse direction away from the microstrip line. They are given as
(9)
(10) Although these nonradiative fields are not outgoing fields, they play an important role in power coupling. When the leaky mode is propagating, the power carried by the nonradiative fields will eventually be transferred to the excited surface-and space-wave fields, resulting in the fields exponentially decaying in the propagation direction.
C. Calculation of Power Flows Toward Different Directions In the radiation region, the fields of an infinitely long microstrip line increase exponentially in the transverse direc-tion, indicating that there is a nonphysical infinite source at . Therefore, the power densities away from the mi-crostrip line will diverge with increasing distance between the microstrip line and the observation point. In this situation, we use finite closed contour , shown in Fig. 3(a), to calculate the finite complex power flows toward different directions, including that propagating down the line in the longitudinal direction and those traveling away in the transverse directions. The finite complex power flows in the finite region are obtained by performing the integrals of Poynting vectors in different directions. These integrals are given as follows.
The total -directed power (in the longitudinal direction) enclosed by contour in Fig. 3(a) is
The total -directed power per unit length (in the trans-verse direction sideways) outward, normal to the closed con-tour in Fig. 3(a) is
(12) The total -directed power per unit length (in the trans-verse direction upward) outward, normal to the closed contour
in Fig. 3(a) is
(13) Under the assumption that there is no wave interaction happening in the far-field region and the property that space, surface, and nonradiative waves are orthogonal to each other (this assumption will be proven to be proper in the following section), constituent portions of the power can be obtained as follows.
The power per unit length due to the excited surface, space, and nonradiative waves propagating outward, normal to the contours , in Fig. 3 are
(14) (15) (16) In the far-field region, the nonradiative fields approach zero and the nonradiative power can be omitted. Therefore, by choosing the closed contours , lying in the far-field region, only the excited space- and surface-wave powers still propagate toward the transverse direction. The radiation efficiency can then be analyzed by comparing the amounts of the excited surface- and space-wave powers.
D. Power Conservation and Interaction Check
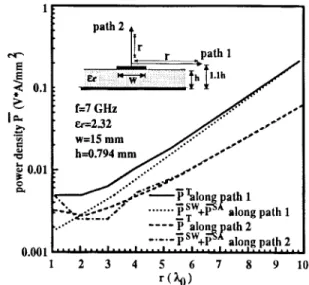
In the near-field region, field distributions are very compli-cated and there are mutual coupling of fields due to different wave modes. Due to this field interaction, the total outgoing power density along different paths, shown in the inset of Fig. 4, might not be equal to the sum of those of the excited space and surface waves if the observation point is not far enough. The observation paths in the insets of Figs. 4 and 5 can be chosen arbitrarily by obeying the following rule that it goes away from the center of the structure transversely. In this paper, the choice of straight paths is for simplicity. The choice that the height of path 1 is equal to is for avoiding more complicated numerical calculation of fields at the dielectric interface if we choose the height equal to . Here, we will first check how far away the closed contours , in Fig. 3 should be placed to ensure that the amount of the power of the nonradiative waves has decayed to the amount of being negligible, and the total power can be divided into the excited surface- and space-wave power, respectively. Fig. 4 shows the real power densities of the total outgoing power and the sum of those of the excited surface and space waves as a function of
Fig. 4. Real power densities for different distancesr along different paths used to check the power conservation in the far-field region and power interation in the near-field region.
the distance in Fig. 4. The distance corresponds to the sizes of contours and . We can see that the difference between these two power densities decreases with farther observation distance, and is negligible if the contours are placed farther than 10 . Fig. 5 shows the outgoing power density of the nonradiative waves as a function of the observation point. The power densities of the nonradiative waves decay exponentially with increasing distance , indicating the power eventually carried by the nonradiative waves being transferred to surface waves and space waves. Therefore, if the distance is larger than 10 , the total power density is almost equal to the sum of the excited surface- and space-wave power density. It indicates that the power conservation is satisfied and the assumption that there is no wave interaction happening in the far-field region and the property that space, surface, and nonradiative waves are orthogonal to each other is valid. For observation paths in the insets of Figs. 4 and 5, different heights of path 1 and different elevation angels of path 2 are also tried, and the same phenomena as shown in Figs. 4 and 5 are observed.
III. MODEDISTINCTION IN THERADIATIONREGION By employing the closed contour , shown in Fig. 3(a), we can calculate the power flows propagating toward different directions. The closed contours used here can be arbitrarily chosen and verification of the mode nature is not influenced by the choice. The propagation constants of the first microstrip-line higher order mode are obtained (using the spectral-domain approach with an appropriate choice of integration contours as in [7]) and are shown in Fig. 6. Validity of our numerical data has been affirmed by checking with data in [2], [3], and [7]. The power flows propagating toward different directions are shown in Fig. 7. In the bound-mode region ( ), the normalized attenuation constant is zero. No imaginary power propagates toward the propagation direction ( -direction) and no outgoing power propagates toward the transverse direction. In the surface-wave region
Fig. 5. Real nonradiative power densities for different distances r along different paths used to check the power interaction.
toward the propagation direction and only very little power propagates transversely toward the -direction, indicating that only surface-wave leakage occurs. In the antenna-mode region ( ), the attenuation constant gradually changes and has a small value. The imaginary power propagating toward the propagation direction is little compared with the real power propagating toward the propagation direction, and there is little power propagating transversely toward the - and -directions, indicating that both the space-wave leakage and the surface-wave leakage occur. In the reactive-mode region ( ), the attenuation constant changes rapidly and has a large value, resulting in increased transverse outgoing power. However, this does not mean the radiation becomes stronger, since the imaginary power propagating toward the propagation direction is large compared with the real power toward the propagation direction. The fields are reactive and the mode is almost cutoff in nature. Therefore, the large value of attenuation constants in this region is due to the nature of cutoff modes in guided structures, but not due to the stronger leakage. Also, the leaky mode does not contribute to the fields when the attenuation constant is very large.
Since the microstrip line is not a closed waveguide, there is no clear-cut cutoff frequency point to distinguish the reactive-mode region from the antenna-reactive-mode region. Here, we define the reactive-mode region as the frequency region in which the imaginary power propagating toward the propagation direction is larger than the real power propagating toward the propaga-tion direcpropaga-tion. Therefore, the cutoff frequency point roughly corresponds to the frequency point where the imaginary power and the real power mentioned above are equal. It is found that the frequency point where the attenuation constant is equal to the phase constant is almost the same as the frequency point where the normalized imaginary power propagating toward the propagation direction is equal to one. It remains so even if different closed contours are used. Therefore, the cutoff frequency point can be obtained from the crossing point of the dispersion curves of the phase constants and the attenuation constants without calculation of power flows. The definitions
Fig. 6. Behaviors of the normalized phase constants and the normalized attenuation constants of the first microstrip-line higher order mode with high dielectric constant substrate and low aspect ratiow=h.
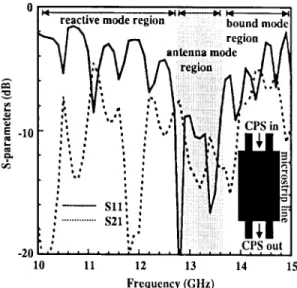
Fig. 7. Normalized power flows obtained by the closed contourC1, shown in Fig. 3(a), with high dielectric constant substrate and low-aspect ratiow=h. of the antenna-mode region and the reactive-mode region mentioned above are based on this reasoning. Therefore, if the operational frequency point is chosen before the cutoff frequency point, a small portion of real power or almost no real power can propagate toward the propagation direction, and most of power will be reflected back to the feeding structure. To confirm the mode distinction described above, the microstrip-line leaky-wave antenna fed by conductor-backed coplanar strips was constructed. A conductor-backed coplanar waveguide to conductor-backed coplanar-strips transition circuit was also used in the antenna feeding structure. The circuit configuration is shown in the inset of Fig. 8. The relative permittivity of the substrate is . The substrate thickness is equal to 0.635 mm. The geometric parameters are as follows:
CPS: strip spacing 0.557 mm
strip width 0.386 mm Microstrip line: strip width 3 mm
Fig. 8. Return and insertion losses for different propagation regions in this experiment.
The return and the insertion losses of the circuit are shown in Fig. 8. As shown in Fig. 8 (in the reactive-mode region (from dc to 12.7 GHz) from Figs. 6 and 7) the return loss is high and most of the power is reflected back into the feed line. The power loss along the leaky-wave antenna circuit is shown in Fig. 9. As can be seen, in the antenna-mode region (from 12.7 to 13.7 GHz) most of the power is radiated. The ripples in the reactive-mode region in Figs. 8 and 9 are due to the excited dominant microstrip-line mode in the antenna, which results from the even coupled microstrips mode being inadvertently excited from the coplanar waveguide (CPW) to continuous phase-shift (CPS) transition circuit. Some conductor losses are also observed in Fig. 9. Experimental results obtained by feeding the microstrip-line leaky-wave antenna with a slotline also confirm this mode distinction. The results are shown in [8], and will not be repeated here.
IV. RADIATIONEFFICIENCY OF THE FIRSTMICROSTRIP-LINE HIGHERORDER MODE AS ALEAKY-WAVEANTENNA Due to orthogonality of waves, the total power of the leaky-wave line source in the far-field region can be divided into the excited surface- and space-wave power. The radiation efficiency of first microstrip-line higher order mode can be analyzed by comparing these two types of excited powers. In this paper, we choose the closed-contour , shown in Fig. 3(b), to calculate the excited space-wave power, and the closed-contour , shown in Fig. 3(c), to calculate the excited surface-wave power. The distances between the observation points and the center of structure for contours and are chosen to be 30 for the numerical convergence.
In designing a leaky-wave antenna, two factors must be predetermined: the main-beam direction and the operational frequency. For a fixed main-beam direction, an antenna op-erating in the desired frequency point can be achieved by choosing different antenna aspect ratios and substrate dielectric constants. Different combination of these structural parameters will lead to different antenna efficiency. How the variation
Fig. 9. Power dissipation for different propagation regions in this experi-ment.
Fig. 10. Radiation efficiencies of the first microstrip-line higher order mode as a function of the normalized phase constant with different substrate thicknesses.
of these parameters influences the antenna efficiency is very important and must be understood in designing a leaky-wave antenna. Additionally, how the antenna efficiency depends on the main-beam direction should be understood. Therefore, in this paper, we use the factor , which determines the main-beam direction for analysis. The relation between the factor
and the main-beam direction is as follows:
(elevation angle) (17)
where the elevation angle is defined as the angle between the main-beam direction and the end-fire direction.
The efficiencies in different structures are compared accord-ing to their main-beam directions. The radiation efficiencies are also shown only in the radiation region where the attenua-tion constant is less than the phase constant (the antenna-mode region). The radiation efficiencies due to different aspect ratio and are shown in Fig. 10. Here, the efficiency of
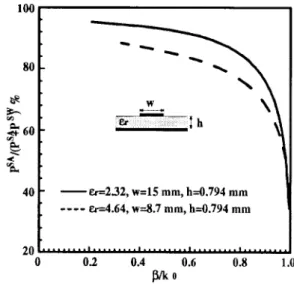
Fig. 11. Radiation efficiencies of the first microstrip-line higher order mode as a function of the normalized phase constant with different dielectric constants.
the leaky-wave antenna is determined by the ratio of power radiated into the space waves to the total power radiated into the space and surface waves, which shows that the radiation efficiencies are poor, with high . Since high results in a small angle between the main-beam direction and the end-fire direction, little space wave can be excited by the phase-matching condition (the excited waves must have the same phase constant in the longitudinal direction as that of the leaky mode). Also, the radiation efficiency is better in the structure with higher aspect ratio . The radiation efficiencies due to the different dielectric constant and are shown in Fig. 11. They show that the radiation efficiencies are also poor with high . The radiation efficiency is also better in structures with lower dielectric constant. The variation in radiation efficiency due to different dielectric constants is very small if the dielectric constant approaches high value, as shown in Fig. 11. Finally, from Figs. 10 and 11 the following statements are deduced. The radiation efficiency is better in structures with lower dielectric constants and higher aspect ratio . Radiation efficiency is also better when the main-beam direction is away from the end-fire direction. Therefore, if we use different structures to operate the microstrip-line leaky-wave line source in the same frequency band (as shown in Fig. 12), we can find that the radiation efficiency will be better with lower dielectric constant and higher aspect ratio , as shown in Fig. 13. Fig. 13 is obtained by transforming the frequency variable in Fig. 12 into the variable . The same radiation efficiency, by using low dielectric constant substrate, can be achieved by increasing the aspect ratio of structures with high dielectric constant. Although the radiation region of a microstrip leaky-wave antenna with
is from 6 to 8.2 GHz, and that with
is from 7 to 8.2 GHz (as shown in Fig. 12), the ranges of the main-beam directions are not quite different, as shown in Fig. 13. Namely, in low dielectric constant structures, the radiation region and the variation range of the main-beam direction are wider, but the frequency scannable sensitivity is poorer.
Fig. 12. Radiation efficiencies of two first microstrip-line higher order modes with different structural parameters, operating in the same frequency band.
Fig. 13. Radiation efficiencies of two first microstrip-line higher order modes with different structural parameters, operating in the same frequency band.
V. CONCLUSIONS
The mode nature of the first microstrip-line higher order mode as an example of a planar leaky-wave line source has been theoretically and experimentally verified. Finite closed contours are introduced to calculate the power flows propa-gating toward different directions and avoid the divergence of power due to the nonphysical infinite source at . From these Poynting vector integrations, the radiation efficiency has also been fully analyzed.
According to the mode nature, the radiation region can be further divided into two regions following our analysis in this paper. In the frequency region where the attenuation constant is small, we find the imaginary power propagating toward the propagation direction is small and there is some power propagating toward the transverse direction. This frequency region can be defined as the antenna-mode region. In the frequency region where the attenuation constant is large, we find that the field is almost reactive, with very little real power
propagating down the propagation direction. Therefore, the large attenuation constant is due to the cutoff nature and not due to radiation. In fact, if the attenuation constant is very large, the leaky mode does not have physical meaning and does not contribute to the fields. This frequency region can be defined as the reactive-mode region.
After investigating the dependence of the radiation effi-ciency of the first microstrip-line higher order mode on the main-beam direction and the geometric parameters, we find the radiation efficiency is poorer, with the mean-beam direction close to the end-fire direction. Additionally, we find the radiation efficiency is better in structures with lower dielectric constant and higher aspect ratio , and the aspect ratio dominates the variation of radiation efficiency if the main-beam direction is fixed. From the above discussions, several design criteria can be outlined as follows. First, the structures with low dielectric constants and high aspect ratio are better choices due to higher radiation efficiency and larger vari-ation range of the main-beam direction, but in such structures, the frequency scannable sensitivity is poorer in applications of scanning antenna array. Second, the employment of the first microstrip-line higher order mode in the regions where the main-beam direction is close to the end-fire direction and where the attenuation constant is larger than the phase constant should be avoided.
REFERENCES
[1] W. Menzel, “A new traveling-wave antenna in microstrip,” Archiv f¨ur
Electronik und ¨Ubertragungstechnik, vol. 33, pp. 137–140, Apr. 1979.
[2] A. A. Oliner and K. S. Lee, “The nature of the leakage from higher order modes on microstrip line,” in IEEE MTT-S Int. Microwave Symp.
Dig., Baltimore, MD, Jan. 2–4, 1986, pp. 57–60.
[3] A. A. Oliner, “Leakage from higher modes on microstrip line with application to antenna,” Radio Sci., vol. 22, no. 6, pp. 907–912, Nov. 1987.
[4] P. Lampariello and A. A. Oliner, “A novel phased array of printed-circuit leaky-wave line sources,” in Proc. 17th European Microwave
Conf., Rome, Italy, Sept. 1987, pp. 555–560.
[5] P. Lampariello, F. Frezza, H. Shigesawa, M. Tsuji, and A. A. Oliner, “Guidance and leakage properties of offset groove guide,” in IEEE
MTT-S Int. Microwave Symp. Dig., Las Vegas, NV, June 1987, pp.
731–734.
[6] Z. Ma and E. Yamashita, “Space wave leakage from higher order modes on various planar transmission line structure,” in IEEE MTT-S Int.
Microwave Symp. Dig., San Diego, CA, May 1994, pp. 1033–1036.
[7] J. S. Bagby, C. H. Lee, D. P. Nyquist, and Y. Yuan, “Identification of propagation regimes on integrated microstrip transmission lines,” IEEE
Trans. Microwave Theory Tech., vol. 41, pp. 1887–1894, Nov. 1993.
[8] Y. D. Lin, J. W. Sheen, and C. K. C. Tzuang, “Analysis and design of feeding structures for microstrip leaky wave antenna,” in IEEE MTT-S
Int. Microwave Symp. Dig., Orlando, FL, May 1995, pp. 149–152.
[9] N. K. Das and D. M. Pozar, “Full-wave spectral-domain computation of material, radiation, and guided wave losses in infinite multilayered printed transmission lines,” IEEE Trans. Microwave Theory Tech., vol. 39, pp. 54–63, Jan. 1991.
[10] K. S. Lee, “Microstrip line leaky wave antenna,” Ph.D. dissertation, Dept. Electrophysics, Polytechnic Univ., Brooklyn, NY, 1986. [11] T. S. Horng, S. C. Wu, H. Y. Yang, and N. G. Alexopoulos, “A
generalized method for distinguishing between radiation and surface-wave losses in microstrip discontinuities,” IEEE Trans. Microsurface-wave
Theory Tech., vol. 38, pp. 1800–1807, Dec. 1990.
[12] T. Itoh, Numerical Techniques for Microwave and Millimeter-Wave
Passive Structures. New York: Wiley, 1989, ch. III.
[13] T. Itoh and R. Mittra, “Spectral domain approach for calculating the dispersion characteristics of microstrip lines,” IEEE Trans. Microwave
Theory Tech., vol. MTT-21, pp. 496–499, July 1973.
[14] J. Boukamp and R. H. Jansen, “Spectral domain investigation of surface wave excitation and radiation by microstrip lines and microstrip disk resonators,” in Proc. 13h European Microwave Conf., Nurnburg, Germany, Sept. 1983, pp. 721–726.
[15] J. M. Grimm and D. P. Nyquist, “Spectral analysis considerations relevant to radiation and leaky modes of open-boundary microstrip transmission line,” IEEE Trans. Microwave Theory Tech., vol. 41, pp. 150–153, Jan. 1993.
Yu-De Lin (S’88–M’91) received the B.S. degree in electrical engineering from National Taiwan University, Taipei, Taiwan, R.O.C., in 1985, and the M.S. and Ph.D. degrees in electrical engineering from the University of Texas at Austin, in 1987 and in 1990, respectively.
In 1990, he joined the faculty of the Department of Communication Engineering, National Chiao Tung University, Hsinchu, Taiwan, R.O.C., where he is currently an Associate Professor. His current research interests include numerical methods in electromagnetics, characterization and design of microwave and millimeter-wave planar circuits, and analysis and design of microwave and millimeter-wave antennas.
Jyh-Wen Sheen received the B.S. degree in control engineering, and the M.S. and the Ph.D. degrees in communication engineering from the National Chiao Tung University, Hsinchu, Taiwan, R.O.C., in 1991, 1993, and 1996, respectively.
In 1996, he joined Computer and Communica-tion Laboratories, Industrial Technology Research Institute (ITRI), Hsinchu, Taiwan, R.O.C., as an RF Engineer and is currently developing the miniatur-ized RF filter and high-gain antenna. His research interests include the analysis and design of vari-ous planar-type leaky-wave antennas, and the investigation of surface-wave leakage phenomena of uniplanar transmission lines.