Article
Multicriteria Decision Analysis to Develop Effective
Sustainable Development Strategies for Enhancing
Competitive Advantages: Case of the TFT-LCD
Industry in Taiwan
Iuan-Yuan Lu1, Tsuanq Kuo1, Ting-Syuan Lin1, Gwo-Hshiung Tzeng2,3,* and Shan-Lin Huang3,4
1 Department of Business Management, National Sun Yat-sen University, 70, Lien-Hai Rd., Kaohsiung City 80424, Taiwan; [email protected] (I.-Y.L.); [email protected] (T.K.); [email protected] (T.-S.L.)
2 Institute of Management of Technology, National Chiao Tung University, Hsinchu 30010, Taiwan 3 Graduate Institute of Urban Planning, College of Public Affairs, National Taipei University, 151,
University Rd., San Shia District, New Taipei City 23741, Taiwan; [email protected]
4 Zhongshan Institute, University of Electronic Science and Technology of China, Zhongshan 528402, China
* Correspondence: [email protected] or [email protected]; Tel.: +886-2-8674-1111; Fax: +886-2-8671-5221
Academic Editor: Kannan Govindan
Received: 13 March 2016; Accepted: 24 June 2016; Published: 9 July 2016
Abstract: In the Internet of Things era, panel displays play a major role in human life, because humans frequently use liquid crystal displays to monitor their electrical devices. The display industry creates remarkable economic output, but every manufacturing process inevitably has some undesirable effects on the environment. With the increasing awareness of environmental protection, balanced development is necessary to address the emerging market trends. However, short-sighted manufacturing corporations that focus solely on financial performance can achieve only short-term profits. The purpose of this study was to develop the most effective sustainable improvement strategies that can enhance competitive advantages in real-world situations. The proposed method combines the balanced scorecard and a new hybrid modified multiple attribute decision-making model which together adopt the DEMATEL technique to construct the influential network relation map and develop the DEMATEL-based ANP with the VIKOR method to deliver strategies that integrate environmental sustainability and competitive advantage. Finally, a real-world case study applying the proposed method to the cases of liquid crystal display manufacturers was conducted. Then, this paper discusses the effective use of natural resources, development of enterprises, and sustainable competitive advantage in this context. Various manufacturers, communities, and stakeholders can benefit from the coopetition solutions explained by the proposed method.
Keywords:sustainable improvement strategies; competitive advantage; ESG (environment, society, and governance); BSC (balanced scorecard); DEMATEL (decision making trial and evaluation laboratory); DANP (DEMATEL-based ANP); hybrid modified VIKOR; TFT-LCD (thin-film transistor liquid crystal display)
1. Introduction
In the Internet of Things era, human life is intimately interconnected with digital technologies, such as thin-film transistor liquid-crystal displays (TFT-LCDs). Consumers rely on display panels to monitor their electrical devices, and growing demand has motivated the development of the
TFT-LCD industry in the world. Although TFT-LCD manufacturing processes yield highly desirable products, such processes create undesirable byproducts in addition to producing pollution that can endanger the environment. Alarmed by climate change and roused to action by environmental education efforts, communities are calling for environmental protection. The common consensus is that a balance must be established among the environment, society, and governance (ESG) [1]. This environmental consciousness guides consumers’ opinions when they make purchasing decisions. Numerous advanced countries have started to redefine economic development and growth from a different perspective. However, almost all electronic products still rely on display panels for monitoring and/or control, which are manufactured by TFT-LCD factories. Even though a particular industry might produce notable quantities of pollution, that industry can commit to a constant process of improvement to become sustainable. Hence, manufacturers can embed concepts of clean production, also called green production, in their governance plans for sustainable improvement to achieve an aura of eco-friendliness in response to corporate social responsibility (CSR). Furthermore, balanced development satisfies customers’ needs while protecting the environment; this market trend will continue to be necessary in the future [2–4]. Therefore, the aim of this study was to develop the most effective sustainable improvement strategies for enhancing competitive advantages in real-world situations.
Before environmental awareness became widespread, the business term “competitive advantage” often referred to the pursuit of business goals, which usually meant profitability as a means to pay returns to investors and stakeholders. Stakeholders in different periods have sought different types of competitive advantage; the concept has evolved from the simple pursuit of economic growth to the maximization of ethical business. Financial performance has dominated the measurement of competitive advantage, but unsustainable growth at any cost causes short-sighted, short-term profits for corporations. Currently, companies have begun to pursue long-term and sustainable competitive advantage on the basis of the balanced scorecard (BSC) involving four dimensions: (1) Learning and Growth; (2) Internal Business Processes; (3) Customer; and (4) Financial. However, the interactions among the BSC dimensions necessitate seeking reasonable real-world solutions that are relevant to a manufacturer’s industrial characteristics [5]. Because high-tech industries have numerous attributes that can be configured in various manners, grueling competition and complicated operational processes engender resource differentials and adequacy challenges; this is especially true in the TFT-LCD panel industry in Taiwan. This study integrated sustainability and competitive advantage concepts to develop the most effective solutions for enterprises that use natural resources.
Simon received the Nobel Prize in Economics in 1978 [6] for ideas relating to sustainable competitive advantage and aspiration levels. A visionary TFT-LCD company must implement a systematic plan of sustainable improvement; this plan must grow into a comprehensive development map that combines the characteristics of the TFT-LCD panel industry with the BSC concepts of ecological responsibility. Comprehensive development maps (referred to as the influential network relation map (INRM)) and influential weights of DEMATEL-based ANP (DANP) may benefit from the DEMATEL (decision making trial and evaluation laboratory) technique, and modified VIKOR (VlseKriterijumska Optimizacija I Kompromisno Resenje, in Serbian) method challenges by integrating the BSC and the influential weights of DANP with a modified VIKOR (DANP-V). DANP-V has two main characteristics: (1) it can be analyzed under the guidelines of the appraisal program; and (2) it systematically approaches continuous improvement of its proposals. The modified VIKOR method in DANP-V can be used for bridging the performance gap by setting an “aspired-worst” benchmark to replace the “max–min” benchmark used in the conventional VIKOR approach (to avoid “picking only the best apple from a barrel of rotten apples”); this thus prevents the application of “piecemeal, stop-gap tactics” and enables achieving aspiration levels through systematic improvements based on INRM.
Since 1999, Taiwanese enterprises and the government have provided a considerable amount of talent, training, and finances to enable the TFT-LCD panel industry to obtain competitive advantage
cutting-edge specialized field technology and patents because of their wide range and application in many types of electronic merchandise. The key players within the TFT-LCD manufacturing field are clustered in Taiwan and South Korea, constituting approximately 83% of the total worldwide TFT-LCD sales [7]. The industrial structures of these two countries are quite different. Compared to the Korean TFT-LCD industry, which is built up by consortium support by National Plan, the Taiwanese TFT-LCD industry consists of small and medium firms that are merged into a group [8]. Hence, the TFT-LCD panel industry business success of note, which affects the survival on a wide level, has become an indicator of Taiwanese industry. Within the past decades, numerous Taiwanese TFT-LCD panel companies have implemented cost reduction strategies and reduced the costs of production, and intense price competition was generated in the industry as an empirical real case. Taiwanese TFT-LCD firms were gradually losing ground to the competition in the global market. A resource integration strategy was executed by merging five major panel companies into two groups, Companies A and I; each group was assisted by the government and accounted for the formation of a duopoly market in Taiwan. However, these two companies still cannot effectively enhance their sustainable competitive advantage over competitors with the same technology level. TFT-LCD technology has to take into consideration the intense competition in the industry. These corporations are facing the pressure of upgrade sustainability capacity from advanced countries and the challenge to employ technology or raw materials to manufacture products in an environmentally friendly manner. If corporations do not have a standardized environmental protection policy, they cannot provide module or semi-finished products, particularly in electronic merchandise, to downstream manufacturers for produce and/or import to those advanced countries [9,10]. Therefore, the concept of sustainability has driven electronics firms to develop continuous improvement strategies intended to achieve an environmentally relevant aspiration level in Taiwan. Strategies of sustained competitive advantage for achieving the desired aspiration level are explained in terms of continuous improvement and sustainable development in the context of existing interrelationships. Through the analysis of the two companies’ architectures of performance, the problem is explained and solutions that create sustainable competitive advantage are discussed.
The research topic of this study is as follows: two major Taiwanese TFT-LCD companies are gaining consumers in advanced countries with the rise and spread of environmental awareness and face the early implementation of a cleaner production program towards the approach of sustainable development of enterprises to maintain a business competitive advantage. Sustainable development is a continuous improvement progress, thus companies will need to continue investing resources for improving ability to achieve the expectation goal in the future. However, understanding how to invest and improve in the right path for systematically sustainable development is an urgent and important issue.
The main contribution of this study is the comprehensive solution for two major TFT-LCD companies to deal with the fundamental problem (gap) of clearly understanding how to implement the company operations for sustainable development in real-world situations. Furthermore, this study also found the requirement to keep investing in the continuously improving path (INRM) with a resource integration relationship to bridge the gap, in order to make the cooperation plan of these two TFT-LCD companies toward achieving aspiration levels in the future.
The remainder of this paper is organized as follows. Section2presents a literature review to establish the indicator framework, and Section3presents the DANP-V method. Section4reviews the empirical facts regarding TFT-LCD companies in Taiwan, and Section5presents conclusions. 2. Literature Review on Establishment of the Indicator Framework
2.1. Sustainable Competitive Advantage and BSC
According to the definition by Kaplan and Norton [11], sustainability “formulates a relationship between dynamic human economic systems and slower changing ecological systems in which
human life can continue indefinitely, human individuals can flourish, and human cultures can develop, while diversity, complexity, and function of the ecological life support system are protected”. Various methods that formalize knowledge of manufacturing tools and concepts can also systematize sustainability performance; among such tools are the analytic hierarchical process (AHP) [12] and the balanced scorecard method [13,14]. Such methods may help to define objectives, plan performance improvement and control practices for performance improvement [15–18], and factors (dimensions and criteria) assumed for each other’s independence.
Competition has been described as a means of encouraging “the search of new regenerating combinations of resources, skills, and processes”, whereas cooperation has been described as facilitating “access to rare and complementary resources” [19]. Numerous companies have begun adopting the BSC as a tool to measure valuable resources in their operational processes, which are analyzed in terms of independent dimensions [20–22]. Previous research on sustainability strategies has focused on success factors [23], coordination and control aspects [24], and governance [25]. Hence, in this research, how is the combination of BSC and DANP-V for measuring sustainable competitive advantage a reasonable solution for continuously improving strategies in the real world? This presents an important issue for analysis.
2.2. Assessment Framework of Sustainable Competitive Advantage
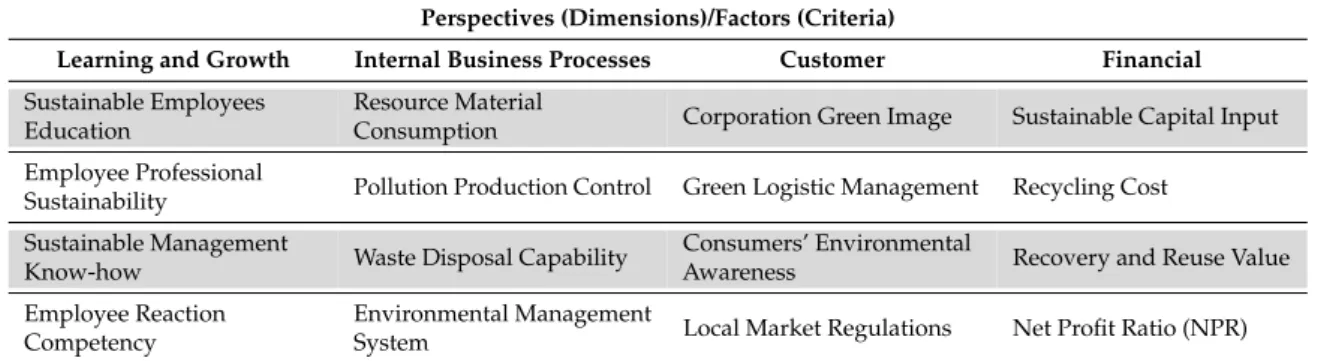
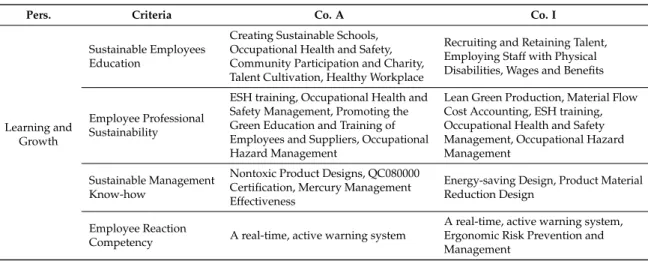
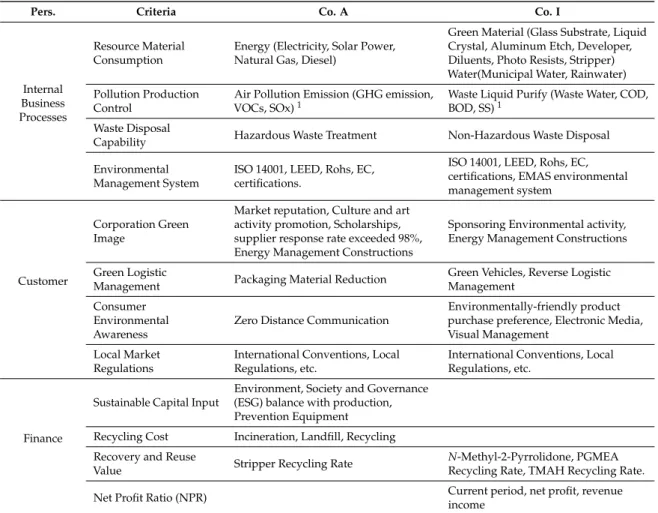
Evaluating the measures and criteria of sustainable development requires a strategy, a feasibility model for minimizing the performance gaps among criteria, and a method for analyzing the complicated interrelationships among dimensions and criteria in the multiple attribute decision-making (MADM) process. Decision makers engage in bridging gaps, preventing decision errors, and diminishing planning bias by using the BSC and this comprises learning and growth, internal business processes, customer, and financial dimensions. This technique was applied as a robust measure of organizational performance; however, the interactions and interrelationships among the four dimensions and criteria vary depending on the industry. The DANP-V model was applied to elucidate the interactions and interrelationships of multiple criteria and dimensions of the BSC. This process is conducted with the industrial attribute of aiming to facilitate improvement strategies under holistic diagnosis for comprehension to achieve sustainable competitive advantages for TFT-LCD companies. The BSC can be used as a tool to assist decision makers who have the authority to select ground plans on the basis of competitive advantage strategies adopted in pursuit of continuous improvement and sustainable development [26–33]. Consequently, the BSC was developed to facilitate decision making with dimensions of coordinated development and analysis and merged with the ESG concept (Table1). The following comprehensive list of dimensions and criteria that can enhance TFT-LCD firms’ sustainable development competency was obtained on the basis of the BSC and ESG. The Learning and Growth dimension (D1) comprises four criteria: the Sustainable Employee Education (C11), Employees Professional Sustainability (C12), Sustainable Management Know-how (C13), and Employee Reaction Competency (C14). The Internal Business Processes dimension (D2) comprises four criteria: Resource Material Consumption (C21), Pollution Production Control (C22), Waste Disposal Capability (C23), and Environmental Management System (C24). The Customer dimension (D3) comprises four criteria: the Corporation Green Image (C31), Green Logistic Management (C32), Consumer Environmental Awareness (C33), and Local Market Regulations (C34). Finally, the Financial dimension (D4) comprises four criteria: the Sustainable Capital Input (C41), Recycling Cost (C42), Recovery Reuse Value (C43), and Net Profit Ratio (NPR) (C44). The dimensions and criteria are described as follows.
Table 1.The performance evaluation factors (criteria) for the pre-test questionnaire. Perspectives (Dimensions)/Factors (Criteria)
Learning and Growth Internal Business Processes Customer Financial Sustainable Employees
Education
Resource Material
Consumption Corporation Green Image Sustainable Capital Input Employee Professional
Sustainability Pollution Production Control Green Logistic Management Recycling Cost Sustainable Management
Know-how Waste Disposal Capability
Consumers’ Environmental
Awareness Recovery and Reuse Value Employee Reaction
Competency
Environmental Management
System Local Market Regulations Net Profit Ratio (NPR) Note: The shade is to distinguish the Dimensions, criteria for reader easier to read. Resource: [10,11,33–78]. 2.2.1. Learning and Growth
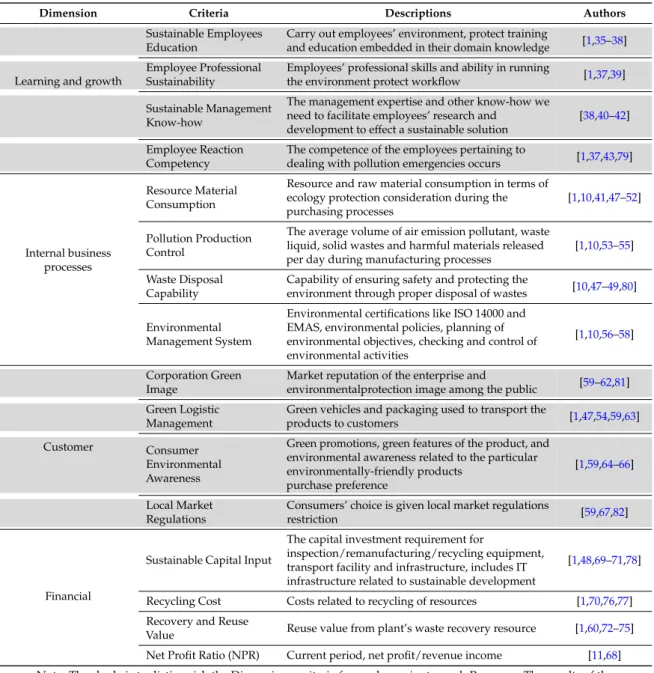
The effect of continual enhancement of sustainability and an increase in competency accumulation on learning can be observed and discussed through imperceptible influence processes. Knowledge and technology for sustainable development are achieved by learners through formal and/or informal transfer processes. Therefore, a sustainable base for lifelong learning and training processes includes Sustainable Employees Education, Employee Professional Sustainability, Sustainable Management Know-how, and Employee Reaction Competency [10,34–43,79]. The Sustainable Employees Education criterion composing eco-friendly and sustainable supply chain activities in service training, seminar, or technical exchange programs merges domain knowledge with the organizational partnership to respond to the environmental awareness of employees [37]. Sustainable employee training was also identified as a major challenge that should be addressed to endorse environmental protection and merge education with domain knowledge [35,38]; the Employee Professional Sustainability criterion for employees’ professional capacity was constructed through a long-term continual cultivated development process, embedded in the sustainability practice with high-quality procedures in the professional domain [39]. Building upon existing knowledge, skills and science expertise in sustainability applications were integrated into the routine workflow, and the requirement of environmental protection was carefully addressed in professional communities [34]. The Sustainable Management Know-how criterion comprises the relative sustainable competitive advantage of business firms from the creation, ownership, protection, and use of difficult-to-imitate commercial production methods and industrial knowledge assets [40]. It includes the intangible assets as tacit knowledge and codified know-how, both of which are generated from technical and organizational aspects, which are protected or normed through the law of intellectual property, such as trade secrets, copyrights, and patents. Management expertise and other types of know-how can facilitate employees’ research and development, facilitating the effective execution of sustainable solutions [10,38,41]. The Employee Reaction Competency criterion involves the successful management of emergency events and immediate damage control when environmental pollution is caused during an operation. Employees’ ability to manage contingency for the survival of an organization depends on how efficiently it can maintain the organizational reputation and gain a market share in particular industries. To achieve this objective, employees must be constantly prepared to prevent environmental pollution events during operations. Only employees with correct and updated knowledge, skills, and acceptable operational behaviors, and who practice them repeatedly to improve reaction ability, make an appreciable difference in resolving a crisis in their companies. Therefore, effective employee training is a critical component of Employee Reaction Competency in an organization’s strategy [42]. The competence of employees in managing pollution emergency occurrences is crucial in Employee Reaction Competency [43,79] (Table2).
Table 2.Descriptions of dimensions and criteria.
Dimension Criteria Descriptions Authors
Sustainable Employees Education
Carry out employees’ environment, protect training
and education embedded in their domain knowledge [1,35–38] Learning and growth
Employee Professional Sustainability
Employees’ professional skills and ability in running
the environment protect workflow [1,37,39] Sustainable Management
Know-how
The management expertise and other know-how we need to facilitate employees’ research and
development to effect a sustainable solution
[38,40–42] Employee Reaction
Competency
The competence of the employees pertaining to
dealing with pollution emergencies occurs [1,37,43,79]
Internal business processes
Resource Material Consumption
Resource and raw material consumption in terms of ecology protection consideration during the purchasing processes
[1,10,41,47–52]
Pollution Production Control
The average volume of air emission pollutant, waste liquid, solid wastes and harmful materials released per day during manufacturing processes
[1,10,53–55] Waste Disposal
Capability
Capability of ensuring safety and protecting the
environment through proper disposal of wastes [10,47–49,80] Environmental
Management System
Environmental certifications like ISO 14000 and EMAS, environmental policies, planning of environmental objectives, checking and control of environmental activities
[1,10,56–58]
Corporation Green Image
Market reputation of the enterprise and
environmentalprotection image among the public [59–62,81] Green Logistic
Management
Green vehicles and packaging used to transport the
products to customers [1,47,54,59,63] Customer Consumer
Environmental Awareness
Green promotions, green features of the product, and environmental awareness related to the particular environmentally-friendly products
purchase preference
[1,59,64–66]
Local Market Regulations
Consumers’ choice is given local market regulations
restriction [59,67,82]
Financial
Sustainable Capital Input
The capital investment requirement for
inspection/remanufacturing/recycling equipment, transport facility and infrastructure, includes IT infrastructure related to sustainable development
[1,48,69–71,78]
Recycling Cost Costs related to recycling of resources [1,70,76,77] Recovery and Reuse
Value Reuse value from plant’s waste recovery resource [1,60,72–75] Net Profit Ratio (NPR) Current period, net profit/revenue income [11,68] Note: The shade is to distinguish the Dimensions, criteria for reader easier to read. Resource: The results of the literature review.
2.2.2. Internal Business Processes
Govindan et al., 2016 [10] reported that “stakeholders and competitive priorities drive profit and non-profit organizations towards the implementation of sustainability-related measures in their internal operations and in their supply chains planning”. Internal Business Processes were related to supply chain activity, particularly in the fusion with production management. The Internal Business Processes dimension comprises Resource Material Consumption, Pollution Production Control, Waste Disposal Capability, and Environmental Management System [10,41,47–58,83,84]. The Resource Material Consumption criterion was developed with reference to the Euro map 60, offering a facilitative measurement strategy and benchmarking concept; for example, measurements of energy efficiency were performed under standardized conditions such as the use of comparable raw materials [50,51]. Resource and raw material consumption were considered in the context of ecological protection during purchasing processes [10,41,47–49,52]. The Pollution Production Control criterion comprises command-and-control mechanisms applied to enforce companies’ solutions for implementing cleaner
production processes, such as changing production processes to reduce or eliminate the emission of cleaning and diluting pollutants. Environmental regulations were focused on pollutant damage control in the operational process, that is, on reparation and setting limits to harmful activities, end-of-pipe cleaning and diluting technologies, and other cleanup strategies [55]. The average volume of air pollutants, waste liquids, solid wastes, and harmful materials released per day during manufacturing must be considered in pollution control [10,53–55]. The Waste Disposal Capability criterion comprises the highest standards in the European Union, such as those regarding landfills. Recycle collaboration firms have long been recognized for their role in influencing firms to re-consider their waste disposal options [83,84]. If a TFT-LCD company plans to sell products to advanced countries, such as European Union members, the capability of the company to ensure safety and protect the environment through proper waste disposal is a crucial process that must be considered [10,47–49,80]. The Environmental Management System criterion comprises the environmental policy regarding basic requirements for a systematic approach to management, including the generic requirements of the international standard STN EN ISO 14001 and the eco-management and audit scheme (EMAS) environmental management systems [49]. Environmental certifications, such as ISO 14000 and EMAS, environmental policies, planning environmental objectives, and verifying and environmental activities are crucial in business process operation [10,56,57] (Table2).
2.2.3. Customer
Govindan et al. (2013) [59] reported that “sustainable supply chain management has received much attention from practitioners and scholars over the past decade owing to the significant attention given by consumers, profit and not-for-profit organizations, local communities, environmental legislation and regulation, and social and corporate responsibility”. Environmental concepts have currently attracted attention because of the pressure generated by the competition in the market for a green image through government regulations, non-governmental organizations, customer demands, diffusion by the media, and so on [85–89]. The Corporation Green Image criterion comprises customers’ awareness that a company does not have a green image, thus preventing the company from selling its products. Integrating green supply chain management practices requires cooperation at all levels, both internal (from top management, and engineers to laborers) and external (from distributors and vendors to sellers) [81]. The market reputation of an enterprise and environmental protection image presented to the public are crucial [59–63]. As such, the importance of sustainability is increasing, and modern enterprises are focusing on a green image. A corporate image shaped by an environmentally conscious mission is the preferred marketing strategy for modern enterprises. The Green Logistic Management criterion comprises product transportation, packaging, and delivery from the factory to the consumer. Such activities are associated with an increase in the total environmental footprint. In some consumer electrical product supply chains, greenhouse gasses are emitted because of the transportation of total emissions over the product life cycle [63]. Green vehicles used for transporting products to customers provide a type of green solution in operational management [47,54,59]. The Consumer Environmental Awareness criterion comprises the major influences of consumers’ selection of a green product or discount in price, operating price benefits (such as reduced electricity bills), green promotions, green features of a product, and environmental awareness related to a product [59,64–66]. The Local Market Regulations criterion comprises regulations by public policy organizations on the content of environmental notifications that restrict consumer choices in a local market [59,67]. Environmental notifications refer to changes in local governmental regulations [82] (Table2).
2.2.4. Financial
Financial goals and measurements are common to all BSC dimensions. The BSC considers the financial dimension to be a measure of the financial performance that is a reflection of the past within BSC’s own existence. Financial goals and profitability-related metrics that are commonly employed in recent years are operating income, return on capital use, and added economic value.
Financial goals may be to create rapid revenue growth or cash flow. However, a compromise using eco-friendly solutions is still required for sustainable development in enterprises. A visionary enterprise should consider the long-term plan, sustainability, short-term plan, and net-income simultaneously. This implies that the enterprise should devise a sustainability plan, balance eco-friendliness and production efficiency, and investigate the efficiency of the multiple effects of technological change, productivity growth, separability, aggregation, and new generation or substitution facility possibilities. The financial dimension comprises Sustainable, Recycling cost, Recovery, Reuse Value and Net Profit Ratio aspects [11,48,60,68–75,90]. The Sustainable Capital Input criterion comprises capital investment requirements for inspecting, re-manufacturing, recycling equipment, transport facilities, and infrastructure, including information technology infrastructure related to sustainable development [48,69,70,90]. The Recycling Cost criterion comprises the capital cost of augmentations that are factored into the daily recycling cost per unit of waste and the recycling facilities that are the most favored for capacity increase [76]. All types of costs related to recycling resources applied to operational processes tend to clear production [70,77]. The Recovery and Reuse Value criterion considers costs related to the direct reuse of the surplus material recycled during the production process estimation of activity costs for cleaning, inspection, and testing and the reuse value of a plant’s waste recovery resources [60,72–75]. The Net Profit Ratio (NPR) criterion comprises the relationship between the most significant calculated rates and the net profits of the company during the current period (net profit/revenue income) [11,68] (Table2).
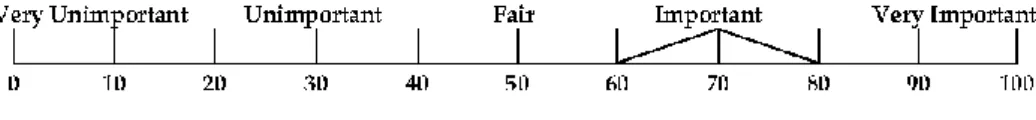
In this study, the scale of the importance level ranged from 0 to 100; levels of 0–20, 21–40, 41–60, 61–80, and 81–100 were defined as very unimportant, unimportant, fair, important, and very important, respectively (Figure1).
Sustainability 2016, 8, 646 8 of 31
and testing and the reuse value of a plant’s waste recovery resources [60,72–75]. The Net Profit Ratio (NPR) criterion comprises the relationship between the most significant calculated rates and the net profits of the company during the current period (net profit/revenue income) [11,68] (Table 2).
In this study, the scale of the importance level ranged from 0 to 100; levels of 0–20, 21–40, 41–60, 61–80, and 81–100 were defined as very unimportant, unimportant, fair, important, and very important, respectively (Figure 1).
Figure 1. Linguistic and range of importance level. 3. Method: DANP-V Model
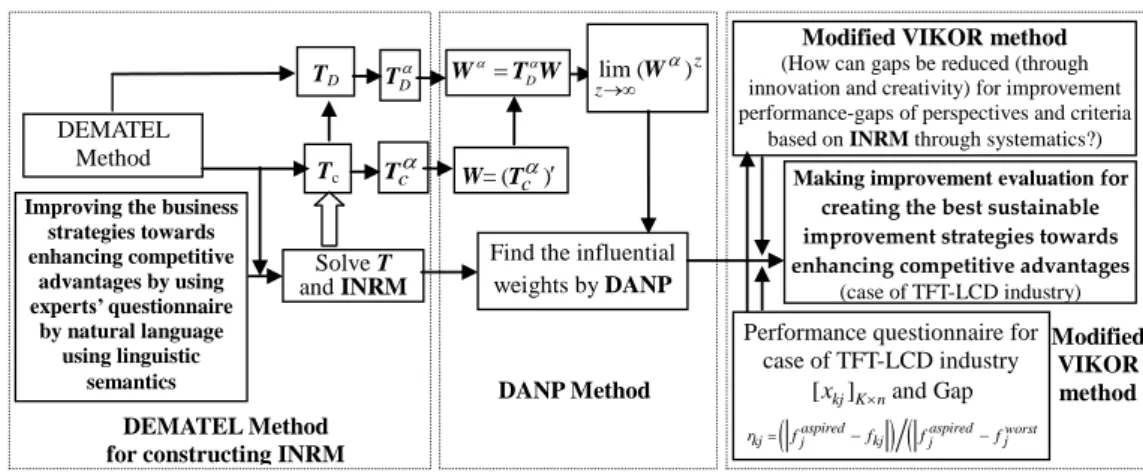
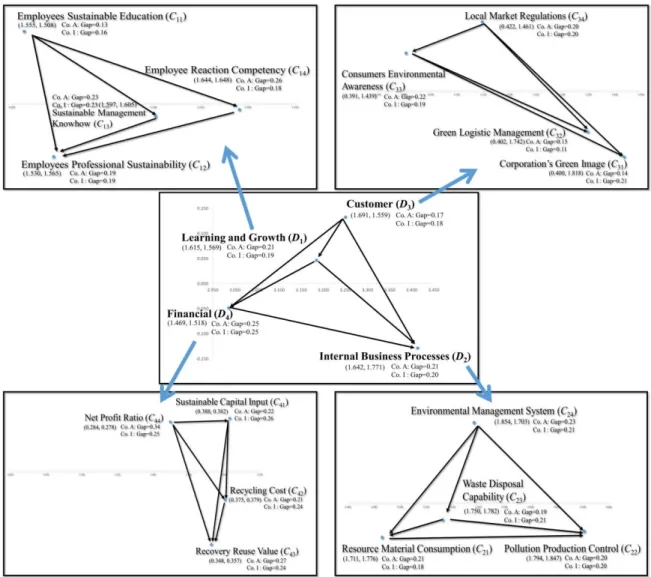
This study used a hybrid modified MADM model combined with the DEMATEL technique to construct the INRM (Figures 2–4). The influential weights (IWs) of the DANP were calculated to confirm the causes and effects associated with each perspective and criterion in the existing relationships and to measure and evaluate the importance of each factor. The DANP-V model is a hybrid modified MADM model, also called the modified VIKOR-DANP model [27], developed on the basis of the aforementioned studies, and it is appropriate for assessing and improving business competitiveness [91] and bridging the performance gaps in each criterion. The dimensions and criteria were generated using the DEMATEL technique to construct the INRM and determine the IWs through a procedure of the DANP, which is a hybrid adopting the basic ANP concept by Saaty [84] and using the DEMATEL technique (Equations (7)–(12)). The global weights can also be obtained using the influence relation matrix through these hybrid methods [28]. Because the influence level is a characteristic of the weights, this study referred to these as the IWs of DANP [28–33,92–95]. The modified VIKOR method was then used to calculate the ratio of the gap between the real performance fkj and the aspiration level
aspired j
f in the alternative k (k1, 2,...,K) of criterion j (j1,2,..., )n ; that is rkj (| fjaspired fkj |) / (|fjaspiredfjworst|)such that the calculations of the IWs are integrated among various programs. Finally, the problems of each program were determined through the modified VIKOR method (If the gap value of a criterion is larger, the problems are more acute and should receive priority for improvement). The INRM was applied to determine the crux criterion through path analysis of influential directions among criteria to identify the cause of the problem and to determine how to formulate improvement strategies through systematics [29] to avoid the “stop-gap piecemeal practice” [30,31,33,92–95].
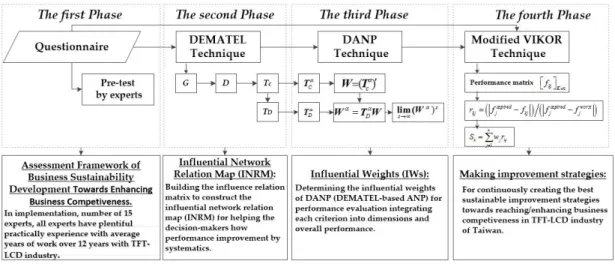
In this study, the DANP-V model was executed in four phases [31]: the first phase was a pretest of the measures in the framework, the second phase established the comprehensive, influential network diagram, the third phase entailed determining the correct training value of IWs, and the fourth phase involved programs for developing improvement strategies, as shown in Figure 2.
The main purpose of the first phase was to determine the degree of influence of each criterion on the research goal on the basis of experience of experts to ensure the reliability of the overall study. A questionnaire was designed and divided into two parts: the first part applied a 5-point Likert scale on which some of the experts evaluated the importance of each criterion; the second part of the questionnaire comprised open-answer items for enhancing the quality of the questionnaire through experts’ sharing of their experience and modified the criteria and connotations. The expert questionnaires were used to survey senior practitioners of sustainable development in the TFT-LCD industry. The selected criteria were identified by experts in fields relevant to the TFT-LCD industry. An appointment was made in advance, and the experts were asked when they could complete the expert questionnaires; the survey was then conducted. The personal information of the experts interviewed was kept confidential in accordance with the principles of research ethics. Only the relevant basic information required for this survey was disclosed. All experts had considerable
Figure 1.Linguistic and range of importance level. 3. Method: DANP-V Model
This study used a hybrid modified MADM model combined with the DEMATEL technique to construct the INRM (Figures2–4). The influential weights (IWs) of the DANP were calculated to confirm the causes and effects associated with each perspective and criterion in the existing relationships and to measure and evaluate the importance of each factor. The DANP-V model is a hybrid modified MADM model, also called the modified VIKOR-DANP model [27], developed on the basis of the aforementioned studies, and it is appropriate for assessing and improving business competitiveness [91] and bridging the performance gaps in each criterion. The dimensions and criteria were generated using the DEMATEL technique to construct the INRM and determine the IWs through a procedure of the DANP, which is a hybrid adopting the basic ANP concept by Saaty [84] and using the DEMATEL technique (Equations (7)–(12)). The global weights can also be obtained using the influence relation matrix through these hybrid methods [28]. Because the influence level is a characteristic of the weights, this study referred to these as the IWs of DANP [28–33,92–95]. The modified VIKOR method was then used to calculate the ratio of the gap between the real performance
fkjand the aspiration level f aspired
j in the alternative k pk “ 1, 2, ..., Kq of criterion j pj “ 1, 2, ..., nq; that is rkj“ p|fjaspired´fkj|q{p|fjaspired´fjworst|qsuch that the calculations of the IWs are integrated among various programs. Finally, the problems of each program were determined through the modified VIKOR method (If the gap value of a criterion is larger, the problems are more acute and should receive priority for improvement). The INRM was applied to determine the crux criterion through path analysis of influential directions among criteria to identify the cause of the problem and to determine
how to formulate improvement strategies through systematics [29] to avoid the “stop-gap piecemeal practice” [30,31,33,92–95].
In this study, the DANP-V model was executed in four phases [31]: the first phase was a pretest of the measures in the framework, the second phase established the comprehensive, influential network diagram, the third phase entailed determining the correct training value of IWs, and the fourth phase involved programs for developing improvement strategies, as shown in Figure2.
The main purpose of the first phase was to determine the degree of influence of each criterion on the research goal on the basis of experience of experts to ensure the reliability of the overall study. A questionnaire was designed and divided into two parts: the first part applied a 5-point Likert scale on which some of the experts evaluated the importance of each criterion; the second part of the questionnaire comprised open-answer items for enhancing the quality of the questionnaire through experts’ sharing of their experience and modified the criteria and connotations. The expert questionnaires were used to survey senior practitioners of sustainable development in the TFT-LCD industry. The selected criteria were identified by experts in fields relevant to the TFT-LCD industry. An appointment was made in advance, and the experts were asked when they could complete the expert questionnaires; the survey was then conducted. The personal information of the experts interviewed was kept confidential in accordance with the principles of research ethics. Only the relevant basic information required for this survey was disclosed. All experts had considerable practical experience, with average years of work of over 12 years within the TFT-LCD industry; they were serving as persons in charge of sustainable development duties. The experts had received Ph.D. and Master’s degrees relevant to the field as academia, industry, and government representatives.
Sustainability 2016, 8, 646 9 of 31
practical experience, with average years of work of over 12 years within the TFT-LCD industry; they were serving as persons in charge of sustainable development duties. The experts had received Ph.D. and Master’s degrees relevant to the field as academia, industry, and government representatives.
Figure 2. Procedures of the new MADM model for achieving the best effectiveness of sustainable improvement strategies.
The second phase entailed establishing a comprehensive INRM through a systematic thought process. This phase of the survey involved a pair of experts who compared the degree of influence between the criterion value, aggregated it into a matrix that was initialized, and then by using the DEMATEL technique calculated the dimensions (TD) and criteria (TC) of the total influence relation
matrix [83]. The INRM was constructed on the basis of the influence intensity among dimensions (TD) and criteria (TC) and then overlapped it; the overall effect diagram (see INRM in Figure 4) was
then completed.
The third phase involved the DEMATEL technique, which is detailed as follows:
Step 1: Calculate the direct influence relation average matrix G. Assume the number of experts to be
H and number of criteria to be n. The pairwise comparisons between any two criteria are assigned and denoted by an integer score of 0, 1, 2, 3, or 4, representing the range from “absolutely no influence (0)” to “very high influence (4)” according to natural language (e.g., semantics) and denoting the degree to which each criterion i affects each criterion j. The answers by each expert form a n n nonnegative matrix Xh [xij n nh] , h1, 2,...,H, where X1,...,Xh,...,XH are the answer matrices of the H experts with practical experience, and the elements of Xh are denoted by
h ij
x from expert H (h1, 2,...,H). Therefore, an n n average matrix G of all experts given can be constructed using Equation (1).
11 1 1 1 1 G j n i ij in n nj nn g g g g g g g g g (1)
The average score of the H experts is 1
1 H h
h
ij ij
g x
H
. The average matrix is called the initial direct relation matrix G and represents the degree of influence that one criterion exerts on another criterion as well as the degree of influence it receives from other criteria.
Figure 2. Procedures of the new MADM model for achieving the best effectiveness of sustainable improvement strategies.
The second phase entailed establishing a comprehensive INRM through a systematic thought process. This phase of the survey involved a pair of experts who compared the degree of influence between the criterion value, aggregated it into a matrix that was initialized, and then by using the DEMATEL technique calculated the dimensions (TD) and criteria (TC) of the total influence relation matrix [83]. The INRM was constructed on the basis of the influence intensity among dimensions (TD) and criteria (TC) and then overlapped it; the overall effect diagram (see INRM in Figure4) was then completed.
The third phase involved the DEMATEL technique, which is detailed as follows:
Step 1: Calculate the direct influence relation average matrix G. Assume the number of experts to be H and number of criteria to be n. The pairwise comparisons between any two criteria are assigned and denoted by an integer score of 0, 1, 2, 3, or 4, representing the range from “absolutely no influence (0)” to “very high influence (4)” according to natural language (e.g., semantics) and denoting the degree to
which each criterion i affects each criterion j. The answers by each expert form a n ˆ n nonnegative matrix Xh“ rxijhs
nˆn, h “ 1, 2, ..., H, where X
1, ..., Xh, ..., XHare the answer matrices of the H experts with practical experience, and the elements of Xhare denoted by xhijfrom expert H (h = 1, 2,||, H). Therefore, an n ˆ n average matrix G of all experts given can be constructed using Equation (1).
G “ » — — — — — — — – g11 ¨ ¨ ¨ g1j ¨ ¨ ¨ g1n .. . ... ...
gi1 ¨ ¨ ¨ gij ¨ ¨ ¨ gin .. . ... ... gn1 ¨ ¨ ¨ gnj ¨ ¨ ¨ gnn fi ffi ffi ffi ffi ffi ffi ffi fl (1)
The average score of the H experts is gij “ H1řHh“1xhij. The average matrix is called the initial direct relation matrix G and represents the degree of influence that one criterion exerts on another criterion as well as the degree of influence it receives from other criteria.
Step 2: Normalize the initial direct influence relation matrix. The normalized initial direct influence relation matrix D is acquired by normalizing the average matrix G. The matrix D is easily derived from Equations (2) and (3), in which all principal diagonal criteria are equal to 0:
D “ G{s (2)
s “ max !
max1ďiďnÿnj“1gij,max1ďjďnÿni“1gij )
(3) Step 3: Obtain the total influence-relation matrix T. A continual decrease in the indirect effects of problems was observed with the increasing powers of the matrix D, for example, D2, D3, . . . , D8, and limqÑ8Dq“ r0snˆn, for limqÑ8pI ` D ` D2`. . . ` Dqq “ pI ´ Dq´1, where I is an n ˆ n unit matrix. The total influence relation matrix T is an n ˆ n matrix, and is defined by T ““tij
‰
nˆn, i, j “ 1, 2, . . . , n as shown in Equation (4).
T “D ` D2`... ` Dq
“DpI ` D ` D2`... ` Dq´1q
“DpI ` D ` D2`... ` Dq´1qpI ´ DqpI ´ Dq´1, then
T “ DpI ´ Dq´1, when limqÑ8Dq “ r0snˆn (4)
where D “ “dij ‰
nˆn, pI ´ DqpI ´ Dq ´1
“I, pI ` D ` D2`... ` Dq´1qpI ´ Dq “ pI ´ Dqq “ I (when limqÑ8Dq “ r0snˆn), 0 ď dij ă1, 0 ă řnj“1dij ď 1 and 0 ăřni“1dij ď1, and at least one row or column of the summation, but not all, equals one; then, limqÑ8Xq “ r0snˆncan be guaranteed.
Using the total influence relation matrix T “ rtijsnˆn, (Tc“ rtijsnˆn|măn,řm
j“1mj“nby criteria and
TD“ rtijsmˆmby dimensions), the INRM can be acquired according to Equation (4). Equations (5) and (6) are used to generate each row sum and column sum in the matrix T “ rtijsnˆn, respectively.
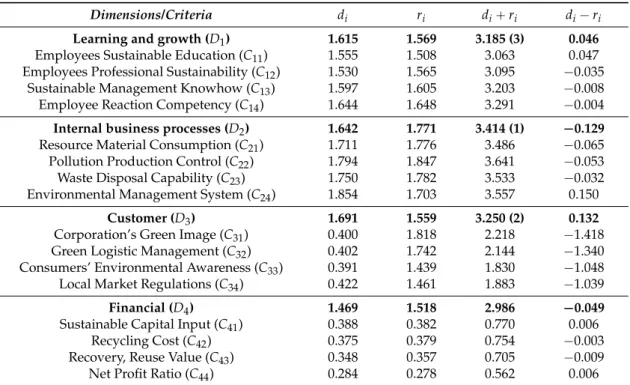
d “ pdiqnˆ1“ ”ÿn j“1tij ı nˆ1“ pd1, ..., di, ..., dnq 1 (5) r “ prjqnˆ1“ prjq11ˆn“ ”ÿn i“1tij ı1 1ˆn“ pr1, ..., rj, ..., rnq 1 (6)
where diis the row sum in the total influence relation matrix T “ rtijsnˆn, which represents the total effects (both direct and indirect) of a criterion or perspective i on all other criteria or perspectives ”
řn j“1tij
ı
nˆ1. Similarly, rjis the column sum in the total influence relation matrix T “ rtijsnˆn, which represents the total effects (both direct and indirect) that a criterion or perspective j receives from all other criteria or perspectives“ři“1n tij
‰1
strength of the total influences given and received; that is, pdi`riqindicates the degree of importance of the criterion or perspective i in the system. In addition, pdi´riqprovides an index of the degree of the cause of total influence. If pdi´riqis positive, then the criterion or perspective i is a net causer, and if pdi´riqis negative, then the criterion or perspective i is a net receiver.
The third phase involved assigning weights to training data. The total influence relation matrix (TDand TC) of the second phase was determined using the basic ANP concept [79,84], and the proposed training processes affected the accuracy of the values; this method is called the DANP.
The IWs can be obtained through the DANP as follows (see AppendixB.3DEMATEL-based technique to determine the IWs in DANP (DEMATEL-based ANP):
Step 1: Total influence relation matrix TC. The DEMATEL technique is used to construct the total influence relation matrix TCfrom each perspective (dimension or cluster), with different degrees of influence relation for the criteria, as shown in Equation (7), whereřmj“1mj “n, m ă n, and Tijc as an miˆmjmatrix.
Sustainability 2016, 8, 646 11 of 31
Step 1: Total influence relation matrix TC. The DEMATEL technique is used to construct the total
influence relation matrix TC from each perspective (dimension or cluster), with different degrees of
influence relation for the criteria, as shown in Equation (7), where
1 m j j m n
, mn, and ij c T as an mimj matrix. 11 12 1 1 1 2 1 2 1 11 11 1 1 1 1 11 1 1 1 1 | , c c c m ci ci cimi cm cm cmm j m m j jmj m mmm i m m j j m D D D c c c c c c D j m c c c i ij im D C c c c m mj mm D c c c n n m n m n T T T T T T T T T T (7)where Dm is the mth cluster,
c
mm is the mth criterion in the mth dimension, and ij cT is a submatrix of the influence relation obtained from a comparison of the criteria of the ith and jth dimensions. In addition, if the ith dimension has no influence on the jth dimension, then submatrix
T
cij
0
showsindependence (no influence relation) in every other criterion.
Step 2: Form an un-weighted super-matrix W . Normalize the total influence relation matrix TC
as shown in Equation (8). 11 12 1 1 1 2 1 2 1 11 11 1 1 1 1 11 1 1 1 1 | , c c c m ci ci cim cm cm cmm j m m j jmj n mmm i i m m j m j D D D c c c c c c D m D i m m mm D n n m n m n T
T
T
T
T
T
T
T
T
T
c c c c c c c c j c ij im C j (8) where C T denotes the normalized total influence relation matrix. Similarly, cmm
T can be obtained. According to pairwise comparisons with the criteria and the basic concept of the ANP, the un-weighted super-matrix W can be obtained by transposing the normalized influence-relation
matrix C
T (basic ANP concept in the form of un-weighted supermatrix; see Appendix B.1 AHP and B2. ANP) by dimensions (clusters); that is, ( C)
W T , as shown in Equation (9). 1 11 11 11 1 1 12 1 1 1 1 2 1 2 1 11 1 1 1 1 | , ( ) W W W W T W W W W W W i m m i imi m mmm m j j j jm j m m m m j j mmm D D D c c c c c c c c D i m c c c D j ij mj C c c m im mm c D n n m n m n c (9)
Step 3: Obtain the weighted super-matrix W . The total influence-relation matrix TD of
dimensions is derived according to the DEMATEL technique, as presented as following matrix.
11 1 1 1 1 D t t t t t t t t t j m i ij im m mj mm m m Τ (7)
where Dmis the mth cluster, cmm is the mth criterion in the mth dimension, and Tijc is a submatrix of the influence relation obtained from a comparison of the criteria of the ith and jth dimensions. In addition, if the ith dimension has no influence on the jth dimension, then submatrix Tijc “ r0s shows independence (no influence relation) in every other criterion.
Step 2: Form an un-weighted super-matrix W. Normalize the total influence relation matrix TCas shown in Equation (8).
Sustainability 2016, 8, 646 11 of 31
Step 1: Total influence relation matrix TC. The DEMATEL technique is used to construct the total
influence relation matrix TC from each perspective (dimension or cluster), with different degrees of
influence relation for the criteria, as shown in Equation (7), where
mj1mj n, mn, andij c T as an mimj matrix. 11 12 1 1 1 2 1 2 1 11 11 1 1 1 1 11 1 1 1 1 | , c c c m ci ci cimi cm cm cmm j m m j jmj m mmm i m m j j m D D D c c c c c c D j m c c c i ij im D C c c c m mj mm D c c c n n m n m n T T T T T T T T T T (7)
where Dm is the mth cluster,
c
mm is the mth criterion in the mth dimension, and ij cT is a submatrix of the influence relation obtained from a comparison of the criteria of the ith and jth dimensions. In addition, if the ith dimension has no influence on the jth dimension, then submatrix
T
cij
0
shows independence (no influence relation) in every other criterion.Step 2: Form an un-weighted super-matrix W . Normalize the total influence relation matrix TC
as shown in Equation (8). 11 12 1 1 1 2 1 2 1 11 11 1 1 1 1 11 1 1 1 1 | , c c c m ci ci cim cm cm cmm j m m j jmj n mmm i i m m j m j D D D c c c c c c D m D i m m mm D n n m n m n T
T
T
T
T
T
T
T
T
T
c c c c c c c c j c ij im C j (8) where C T denotes the normalized total influence relation matrix. Similarly, cmm
T can be obtained. According to pairwise comparisons with the criteria and the basic concept of the ANP, the un-weighted super-matrix W can be obtained by transposing the normalized influence-relation
matrix C
T (basic ANP concept in the form of un-weighted supermatrix; see Appendix B.1 AHP and B2. ANP) by dimensions (clusters); that is, ( C )
W T , as shown in Equation (9). 1 11 11 11 1 1 12 1 1 1 1 2 1 2 1 11 1 1 1 1 | , ( ) W W W W T W W W W W W i m m i imi m mmm m j j j jm j m m m m j j mmm D D D c c c c c c c c D i m c c c D j ij mj C c c m im mm c D n n m n m n c (9)
Step 3: Obtain the weighted super-matrix W . The total influence-relation matrix TD of
dimensions is derived according to the DEMATEL technique, as presented as following matrix.
11 1 1 1 1 D t t t t t t t t t j m i ij im m mj mm m m Τ (8) where Tα
Cdenotes the normalized total influence relation matrix. Similarly, Tαmmc can be obtained. According to pairwise comparisons with the criteria and the basic concept of the ANP, the un-weighted super-matrix W can be obtained by transposing the normalized influence-relation matrix Tα
C(basic ANP concept in the form of un-weighted supermatrix; see AppendixB.1AHP andB.2. ANP) by dimensions (clusters); that is, W “ pTα
Sustainability 2016, 8, 646 12 of 31
Step 1: Total influence relation matrix TC. The DEMATEL technique is used to construct the total
influence relation matrix TC from each perspective (dimension or cluster), with different degrees of
influence relation for the criteria, as shown in Equation (7), where
mj1mj n, mn, andij c T as an mimj matrix. 11 12 1 1 1 2 1 2 1 11 11 1 1 1 1 11 1 1 1 1 | , c c c m ci ci cimi cm cm cmm j m m j jmj m mmm i m m j j m D D D c c c c c c D j m c c c i ij im D C c c c m mj mm D c c c n n m n m n T T T T T T T T T T (7)
where Dm is the mth cluster,
c
mm is the mth criterion in the mth dimension, and ij cT is a submatrix of the influence relation obtained from a comparison of the criteria of the ith and jth dimensions. In addition, if the ith dimension has no influence on the jth dimension, then submatrix
T
cij
0
shows independence (no influence relation) in every other criterion.Step 2: Form an un-weighted super-matrix W . Normalize the total influence relation matrix TC
as shown in Equation (8). 11 12 1 1 1 2 1 2 1 11 11 1 1 1 1 11 1 1 1 1 | , c c c m ci ci cim cm cm cmm j m m j jmj n mmm i i m m j m j D D D c c c c c c D m D i m m mm D n n m n m n T
T
T
T
T
T
T
T
T
T
c c c c c c c c j c ij im C j (8) where C T denotes the normalized total influence relation matrix. Similarly, cmm
T can be obtained. According to pairwise comparisons with the criteria and the basic concept of the ANP, the un-weighted super-matrix W can be obtained by transposing the normalized influence-relation
matrix C
T (basic ANP concept in the form of un-weighted supermatrix; see Appendix B.1 AHP and B2. ANP) by dimensions (clusters); that is, ( C)
W T , as shown in Equation (9). 1 11 11 11 1 1 12 1 1 1 1 2 1 2 1 11 1 1 1 1 | , ( ) W W W W T W W W W W W i m m i imi m mmm m j j j jm j m m m m j j mmm D D D c c c c c c c c D i m c c c D j ij mj C c c m im mm c D n n m n m n c (9)
Step 3: Obtain the weighted super-matrix W . The total influence-relation matrix TD of
dimensions is derived according to the DEMATEL technique, as presented as following matrix.
11 1 1 1 1 D t t t t t t t t t j m i ij im m mj mm m m Τ (9)
Step 3: Obtain the weighted super-matrix Wα. The total influence-relation matrix TDof dimensions is derived according to the DEMATEL technique, as presented as following matrix.
TD“ » — — — — — — — – t11 ¨ ¨ ¨ t1j ¨ ¨ ¨ t1m .. . ... ...
ti1 ¨ ¨ ¨ tij ¨ ¨ ¨ tim .. . ... ... tm1 ¨ ¨ ¨ tmj ¨ ¨ ¨ tmm fi ffi ffi ffi ffi ffi ffi ffi fl mˆm The normalized total influence-relation matrix Tα
Dof dimensions can be obtained through the total influence-relation matrix TDdivided by di “řmj“1tij, i “ 1, 2, ..., m, as shown in Equation (10).
Tα D“ » — — — — — — — – t11{d1 ¨ ¨ ¨ t1j{d1 ¨ ¨ ¨ t1m{d1 .. . ... ... ti1{di ¨ ¨ ¨ tij{di ¨ ¨ ¨ tim{di .. . ... ... tm1{dm ¨ ¨ ¨ tmj{dm ¨ ¨ ¨ tmm{dm fi ffi ffi ffi ffi ffi ffi ffi fl mˆm “ » — — — — — — — — – tαD 11 ¨ ¨ ¨ tαD1j ¨ ¨ ¨ t1mαD .. . ... ... tαD i1 ¨ ¨ ¨ tαDij ¨ ¨ ¨ tαDim .. . ... ... tαD m1 ¨ ¨ ¨ tαDmj ¨ ¨ ¨ tαDmm fi ffi ffi ffi ffi ffi ffi ffi ffi fl mˆm (10) The normalized Tα
D, unweighted super-matrix W (shown as Equation (9)), and weighted super-matrix Wα (normalized super-matrix) can be easily obtained through Equation (11), where tαD
ij is a scalar and řm
j“1mj “n.
Sustainability 2016, 8, 646 12 of 31
The normalized total influence-relation matrix D
T of dimensions can be obtained through the
total influence-relation matrix TD divided by 1
m i j ij d
t , i1, 2,...,m, as shown in Equation (10). 11 1 1 1 1 1 11 1 1 1 1 1 1 / / / / / / / / / D D D j m j m D D D i i ij i im i i ij im D D D m m mj m mm m m m m mj mm m m ΤD t d t d t d t t t t d t d t d t t t t d t d t d t t t (10) The normalized D T , unweighted super-matrix W (shown as Equation (9)), and weighted
super-matrix W (normalized super-matrix) can be easily obtained through Equation (11), where
D ij
t
is a scalar and 1 m j j m n
. 1 11 11 11 1 1 1 12 1 1 1 2 1 2 ... 11 1 1 11 1 1 1 1 1 1 W W W W T W W W W W W W i m m i imi m mmm m j j j jm j m m m mmm D D D c c c c c c c D c D D i D m i m c c c D D j D ij D mj D j ij mj c c D m D im D mm c m im mm D c t t t t t t t t t (11)Step 4: Calculate the limit of the super-matrix W . Limit the weighted super-matrix by raising it to
the zth power until it has converged and become a stable super-matrix. The global priority vectors are obtained, which are called the IWs of the DANP, such as limz(W)z, where z represents any number.
In brief, according to the aforementioned process, the INRM and IWs can be obtained and can be used in resolving the problem of interdependence and feedback to develop the most effective systematic improvement strategies for reducing the gaps in criterion performance, such that all criteria facilitate achievement of the aspiration level.
The fourth phase entailed developing the most effective sustainable improvement strategies for enhancing competitive advantages in the TFT-LCD industry. The gaps can be calculated using the modified VIKOR method, which entails considering each absolute distance between performance values and adopting the aspiration level and worst value, called “aspired-worst”, as benchmarks [80–83,85,93–96], rather than using the relative distance and adopting positive and negative ideal points, called “max-min”, as the benchmarks as in the conventional VIKOR method [86–88,93–96]. Accordingly, the phase involved solving problems through the modified VIKOR programs in the problem criteria; the INRM was then used to identify the crux of the criteria (the criteria on the impact of the problem criteria). The conventional and modified VIKOR methods are compared to demonstrate the concept of continual improvement in sustainability. Finally, the reasons for the impact of the criteria through the crux are elucidated for developing the most effective improvement strategies for reaching the aspiration level.
The fourth phase: The modified VIKOR method is described as follows:
Step 1: Derive the positive and negative-ideal solutions for replacing the aspiration levels and worst value to fit the current real-world situation. Define the aspiration level fjaspired in the j criterion and worst
value fjworst for all criteria j1, 2,...,n, which can be converted from the conventional form into the modified form.
(1) The conventional approach for deriving the positive- and negative-ideal solutions as the benchmarks (max-min) is illustrated as follows.
Positive-ideal solution: (f1,...,fj,...,fn),
f where fjmax {k fkj|k1,2,..., }K ;
(11)
Step 4: Calculate the limit of the super-matrix Wα. Limit the weighted super-matrix by raising it to the zth power until it has converged and become a stable super-matrix. The global priority vectors are obtained, which are called the IWs of the DANP, such as limzÑ8pWαqz, where z represents any number.
In brief, according to the aforementioned process, the INRM and IWs can be obtained and can be used in resolving the problem of interdependence and feedback to develop the most effective systematic improvement strategies for reducing the gaps in criterion performance, such that all criteria facilitate achievement of the aspiration level.