國 立 交 通 大 學
財務金融研究所
碩
士
論
文
Empirical Comparison of Common Dynamic Features in Stock
Returns between Taiwan and Thailand Stock Markets
研 究 生:黃宇瀚
指導教授:王克陸
博士
Empirical Comparison of Common Dynamic Features in Stock
Returns between Taiwan and Thailand Stock Markets
研 究 生:黃宇瀚 Student:Sakol Rattanasekson
指導教授:王克陸 博士
Advisor:Dr. Keh-Luh Wang
國 立 交 通 大 學
財務金融研究所
碩 士 論 文
A Thesis
Submitted to Graduate Institute of Finance College of Management
National Chiao Tung University in partial Fulfillment of the Requirements
for the Degree of Master in Finance
July 2010
Hsinchu, Taiwan, Republic of China
Declaration
Herewith I affirm that I have written this thesis on my own. I did not enlist unlawful assistance of someone else. Cited sources of literature are perceptibly marked and listed at the end of this thesis. The work was not submitted previously in same or similar form to another examination committee and was not yet published.
A
CKNOWLEDGEMENTS
I have received a lot of help and support from many people during the course of this thesis. First of all, I would like to thank my advisor, Professor Dr. Keh-Luh Wang for his time, patience, guidance, support, and understanding. As my teacher and mentor, he has taught me more than I could ever give him credit for here. I also would like to make a special thank to Mr. Wen-Chia Yang for the help of Matlab code checking, as well as mentoring, and enabled me to develop an understanding of the Matlab code and programming. Without these persons’ generous assistance and encouragement, this thesis could never have been completed.
I also wish to express my truly thanks to my Dissertation Committee for their helpful professional comments and suggestions on my thesis.
Without my family’s support I could not have possible completed my study. I dedicate this thesis to my parents who unremittingly supported me during my years of study. They made this work possible. Lastly, I offer my regards and blessings to all of those who supported me in any respect during the completion of the thesis.
Empirical Comparison of Common Dynamic
Features in Stock Returns between Taiwan and
Thailand Stock Markets
Student: Sakol Rattanasekson
Advisor: Dr. Keh-Luh Wang
Abstract
The purpose of this study is to investigate the empirical comparison of common dynamic differences and similarities between stock returns. We introduce a volatility-based method for clustering analysis of financial time series. Using the threshold generalized autoregressive conditional heteroskedasticity (TGARCH) model, we calculate the distances of the stock return volatilities parameters between stocks from the certain measures. The proposed method uses the volatility behavior of the time series and takes into account the problem of different lengths in time. In this study, we examine the similarities between stocks in two international stock markets, Taiwan and Thailand, using daily stock prices with sample sizes from 21 April 2005 to 6 May 2010. We employ the clustering to investigate further the similarities and dissimilarities between the constituent stocks used to compute the FTSE TWSE Taiwan 50 and SET 50 indices.
Table of Contents
1. INTRODUCTION ... 1
2. METHODOLOGY ... 2
2.1VOLATILITY MODELS ... 2
2.2CLUSTERING MODELS AND CLUSTER ANALYSIS ... 5
2.3MULTIDIMENSIONAL SCALING ... 6
3. DATA ... 7
4. RESULTS ... 17
4.1CLUSTER ANALYSIS RESULTS ... 17
4.2MULTIDIMENSIONAL SCALING RESULTS ... 26
5. CLUSTER TREE VERIFICATION ... 30
6. CONCLUSION ... 30
7. REFERENCES ... 32
APPENDIX A - TAIWAN 50 INDEX CONSTITUENT STOCKS BOTH CHINESE NAME AND ENGLISH NAME ... 34
APPENDIX B - SET 50 INDEX CONSTITUENT STOCKS AND STOCK ID IN THE SETSMART ... 35
List of Figures
FIGURE 1:DENDROGRAM FOR TAIWAN 50 STOCKS USING THE MAHALANOBIS-TGARCH DISTANCE. ... 20
FIGURE 2:DENDROGRAM FOR TAIWAN 50 STOCKS USING THE EUCLIDEAN DISTANCE. ... 21
FIGURE 3:DENDROGRAM FOR TAIWAN 50 STOCKS USING THE COMBINED DISTANCE. ... 22
FIGURE 4:DENDROGRAM FOR SET50 STOCKS USING THE MAHALANOBIS-TGARCH DISTANCE. ... 23
FIGURE 5:DENDROGRAM FOR SET50 STOCKS USING THE EUCLIDEAN DISTANCE. ... 24
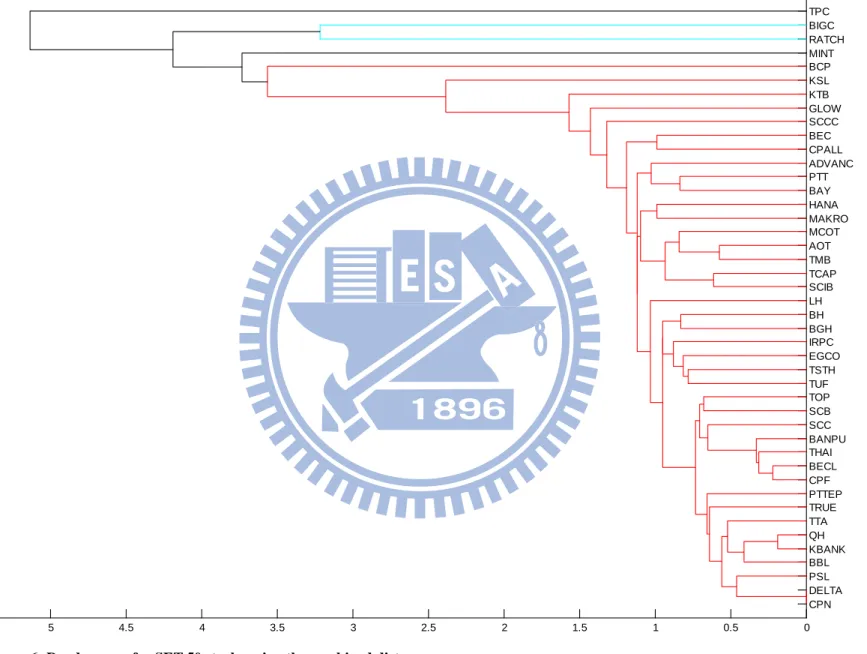
FIGURE 6:DENDROGRAM FOR SET50 STOCKS USING THE COMBINED DISTANCE. ... 25
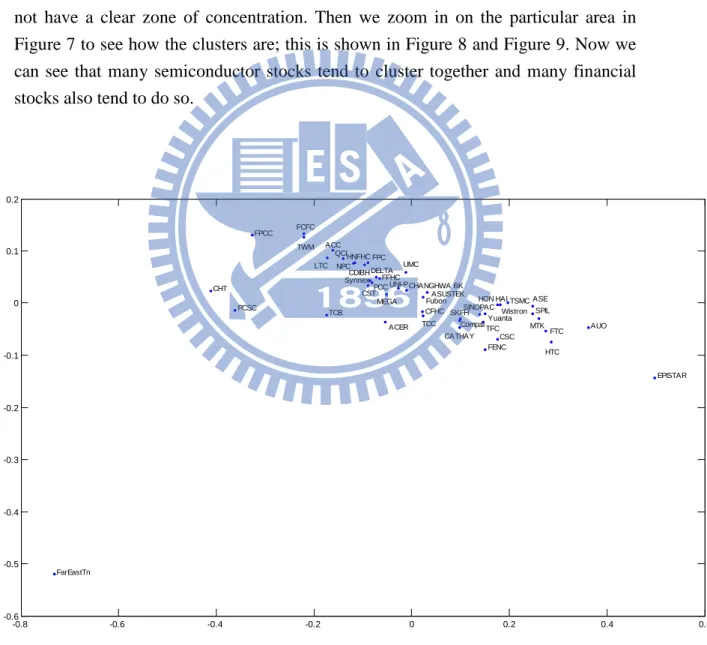
FIGURE 7:TWO-DIMENSIONAL MULTIDIMENSIONAL SCALING MAP OF TAIWAN 50 STOCK RETURNS. ... 26
FIGURE 8:ZOOM IN ON 2-DMDS MAP OF TAIWAN 50 STOCK RETURNS FOR THE X RANGE OF -0.2 TO 0.3. ... 27
FIGURE 9:ZOOM IN ON 2-DMDS MAP OF TAIWAN 50 STOCK RETURNS FOR THE X RANGE OF -0.2 TO 0.3(SHOW INDUSTRY). ... 27
FIGURE 10:TWO-DIMENSIONAL MULTIDIMENSIONAL SCALING MAP OF SET50 STOCK RETURNS. ... 28
FIGURE 12:ZOOM IN ON 2-DMDS MAP OF SET50 STOCK RETURNS. ... 29
List of Tables
TABLE 1:STOCKS USED TO COMPUTE THE FTSETWSETAIWAN 50 INDEX. ... 9
TABLE 2:STOCKS USED TO COMPUTE THE SET50 INDEX. ... 10
TABLE 3:STOCKS USED TO COMPUTE THE TAIWAN 50 INDEX, RECLASSIFIED BY USING THE SAME CRITERIA AS THOSE OF THE SET50 INDEX. ... 11
TABLE 4:INDEX COMPARISON BY INDUSTRY. ... 12
TABLE 5:INSUFFICIENT DATA STOCKS. ... 12
TABLE 6:SUMMARY STATISTICS FOR THE TAIWAN 50 INDEX STOCK RETURNS. ... 13
TABLE 7:SUMMARY STATISTICS FOR SET50 INDEX STOCK RETURNS. ... 14
TABLE 8:ESTIMATED TGARCH(1,1) MODELS ASSUMING GED INNOVATION FOR TAIWAN50 STOCK RETURNS. ... 15
TABLE 9:ESTIMATED TGARCH(1,1) MODELS ASSUMING GED INNOVATION FOR SET50 STOCK RETURNS. ... 16
1. Introduction
Due to the complexity in analysis of financial data structure, several methods have been used to extract the more accurate relationship among the data. However, there still exists some complicated relationship that difficult to analyze. There must be some methods that can be used to extract the relationship between the data more efficiently. Thus, cluster analysis (first used by Tryon, 1939) has been introduced to deal with this problem.
Cluster analysis is the assignment of a set of observations into subsets (called clusters) so that observations in the same cluster are similar in some sense. The cluster analysis had been developed to apply in many areas of sciences, it was used intensively in classifying the data traits according to their characteristics and similarities or dissimilarities. Clustering is a method of unsupervised learning, and a common technique for statistical data analysis used in many fields, including machine learning, data mining, pattern recognition, image analysis, information retrieval, and bioinformatics. The term “cluster analysis” encompasses a number of different algorithms and methods for grouping objects of similar kind into respective categories. A general question facing researchers in many areas of inquiry is how to organize observed data into meaningful structures, that is, to develop taxonomies. In other words cluster analysis is an exploratory data analysis tool which aims at sorting different objects into groups in a way that the degree of association between two objects is maximal if they belong to the same group and minimal otherwise. Given the above, cluster analysis can be used to discover structures in data without providing an explanation. In other words, cluster analysis simply discovers structures in data without explaining why they exist. The cluster analysis of financial time series has also played an important role in several areas of applications.
In this study, we examine the dynamic features of stock return movements, i.e., its volatilities, and try to capture its volatilities’ behavior by using the cluster analysis to find the cluster of each group of stocks that exhibit close relationship among the others. This would have contribution to several areas of finance, such as stock selection process of investment both active and passive strategies, equity market analysis both domestic and international contexts, portfolio diversification, risk management, and so on. Another contribution might lie on helping to explain volatility asymmetry of the stocks in Taiwan and Thailand market from the sample data.
Although there are many available statistical methods for analysis of asset return structure, which mostly imposes condition on the covariance matrix that are hard to apply, various types of multivariate statistical techniques have been used to avoid this
problem. These include 1) principal component analysis (PCA), which takes into account the covariance of asset returns and can be used in dimension reduction (Tsay 2005), 2) factor model for asset return that needs multiple time series to explain the common factors of the return, and 3) cluster analysis by identifying similarities in asset return volatilities.
There are numerous clustering methods, which take different views of distance measures. Among these, the Pearson correlation coefficient seems to be useful in measuring similarity of a pair of stock returns as used by Mantegna (1999), Bonanno, Lillo and Mantegna (2001), however, it has two major problems. First, it does not take into account the stochastic volatility dependence of the processes - in fact, two processes may be highly correlated and have very different internal stochastic dynamics. Second, it cannot be used directly for comparison and grouping stocks with unequal sample sizes; this is a common problem of most existing nonparametric-based methods discussed in Caiado et al. (2009).
In this study, we apply TGARCH model to our data due to the asymmetric cross-correlations and dependences in asset returns considerations, which TGARCH could do a better job in capturing these characteristics of the data. Then use the parameters from the TGARCH as inputs in the distance measure models. Lastly, we plot clustering trees and multidimensional scaling map to explore the existence of clusters in the data structure.
The purpose of this study is also to examine the asset return movements in the direction correlated to the others as in clusters. The rest of this study is organized as follows: Section 2 discusses the empirical methodology and a brief overview of some important theoretical developments in implementation of ARCH and GARCH families; Section 3 describes the data and explores the univariate summary statistics; Section 4 covers the empirical findings using the cluster analysis and the multidimensional scaling results; Section 5 verifies the dendrogram; and Section 6 concludes the study. A detailed bibliography is given at the end of this study.
2. Methodology
2.1 Volatility models
An interesting feature of asset prices is that “bad” news seems to have a more pronounced effect on volatility than does “good” news. For many stocks, there is a strong negative correlation between the current return and the future volatility. The tendency for volatility to decline when returns rise and to rise when returns fall is often called the (asymmetric) leverage effect. Empirical research has brought forth a
considerable number of stylized facts of high-frequency financial time series; Bollerslev, Engle and Nelson (1994) give a complete account of these facts. The purpose of this section is to describe some of these characteristic features and the model proposed. Many of researches show that returns on financial assets display erratic behavior, in the sense that large outlying observations occur with rather high-frequency, that large negative returns occur more than large positive ones; these large returns tend to occur in clusters and that periods of high volatility are often preceded by large negative returns. Because of these stylized facts, it seems necessity to consider nonlinear models to describe the observed patterns in such financial time series adequately. It also should be remarked in this case that the maintained hypothesis for high-frequency financial time series is that logarithmic prices of financial assets display random walk-type behavior (Campbell, Lo and MacKinlay, 1997).
Nowadays, models from the GARCH class are the most popular volatility models among practitioners. GARCH models enjoy such popularity because they are capable of describing not only the feature of volatility clustering, but also certain other characteristics of financial time series, such as their pronounced excess kurtosis or fat-tailedness. The standard GARCH model still cannot capture other empirically relevant properties of volatility. Black (1976) attributes that negative shocks or news tends to affect volatility quite differently than positive shocks of equal size. In the standard GARCH model, however, the effect of a shock on volatility depends only on its size. The sign of the shock is irrelevant. Another limitation of the standard GARCH model is that it does not imply that expected returns and volatility are related directly, as is the case in the CAPM, which postulates a direct relationship between the required return on an asset and its risk.
Among several choices of volatility models, we have considered Threshold GARCH (TGARCH) model, which was introduced by the works of Zakoian (1994) and Glosten et al. (1993) as our tool in analyzing the time series data here because of its ability in capturing the effect of fat-tailed distribution, the so-called stylized facts, and the asymmetric shocks, which Kroner and Ng 1998, and Bekaert and Wu 2000 proposed that volatility tends to be higher after a negative return shock than a positive shock of the same magnitude. The TGARCH (1, 1) model assume the form
yt = xtB + εt (1)
εt = ztσt (2)
σ2
t = ω + βσ2t-1 + αε2t-1 + γε2t-1dt-1 (3)
The equation (1) is the mean equation from the regression with coefficient B (we use the daily log return × 100 as our return metric in the model) and the equation (3) is the variance equation where { zt } is a sequence of independent and identically distributed
random variables with zero mean and unit variance; dt-1 is a dummy variable that dt-1 =
1 if εt-1 is negative, and dt-1 = 0 otherwise. This allows the good and bad news to have
different effects on volatility. In a sense, εt-1 = 0 is a threshold such that shocks greater
than the threshold have different effects than shocks below the threshold. The intuition behind the TGARCH model is that positive values of εt-1 are associated with a zero
value of dt-1. Therefore, if εt-1≥ 0, which implies good news, the effect of an εt-1 shock
on σ2t is α. When εt-1 ≤ 0, which implies bad news and dt-1 = 1, the effect of an εt-1
shock on σ2t is (α+γ). If γ >0, negative shocks will have larger effects on volatility
than positive shocks. The persistence of shocks to volatility can be given by (α+β+γ/2). In addition, if the coefficient γ is statistically different from zero, one can conclude that the data contain a threshold effect.
Also, Nelson (1991) introduced the GARCH model which allows for asymmetric effects between positive and negative stock returns, called the exponential GARCH (EGARCH) model. There are no restrictions on the parameters have to be imposed to ensure that σ2t is non-negative and it assumes the leverage effect is exponential rather
than quadratic.
Moreover, several academic researches point out that the Generalized Error Distribution (GED) better describes fat-tailed returns of stocks; thus, in our analysis, we assume zt follow a fat-tailed distribution as it can be given by the GED, which has
the following probability density function
zt |Ωt-1~ GED(0, σ2t, ν) (4)
f(z) = νexp[-0.5|z/λ|ν]/[λ2(1+1/ν)Γ(1/ν)], 0< ν ≤ ∞, -∞ < z < +∞ (5) where ν is the tail-thickness parameter, Γ(·)is the gamma function and
λ = [2(-2/ν)Γ(1/ν)/ Γ(3/ν)]0.5
, (6)
When n < 2, {zt} is fat-tailed distributed. When n = 2, {zt} is normally distributed.
When n > 2, {zt} is thin-tailed distributed. For detailed example see Tsay (2005, p.
108).
To be able to minimize the kurtosis displayed by financial time series, we fit the TGARCH (1, 1) model parameters by the method of maximum-likelihood estimation (MLE) as stated by Peters (2001), assuming conditional GED distribution to model stock return innovations.
(7) This log-likelihood function is maximized with respect to the unknown parameters to yield the best estimate of the parameters.
2.2 Clustering Models and Cluster Analysis
We apply the concept of a distance measure of the cluster analysis to the financial time series with similar volatility dynamics effects. An important step in most clustering is to select a distance measure, which will determine how the similarity of two elements is calculated. This will influence the shape of the clusters, as some elements may be close to one another according to one distance and farther away according to another. For example, in a 2-dimensional space, the distance between the point (x = 1, y = 0) and the origin (x = 0, y = 0) is always 1 according to the usual norms, but the distance between the point (x = 1, y = 1) and the origin can be 2, or 1 if you take respectively the 1-norm, 2-norm or infinity-norm distance. Accodingly, it is very important to specify which distance measure we use. We use Mahalanobis-like distance, Euclidean distance, and the mixed between the two as our metric in the distance measure. A Mahalanobis-like distance function or sometimes called “quadratic distance” can be defined as:
dTGARCH(x, y) = [(Tx – Ty)′Ω-1(Tx – Ty)]0.5 (8)
where Tx = (αx βx γx νx)′ and Ty = (αy βy γy νy) are the vectors of the estimated ARCH,
GARCH, leverage effect, and tail-thickness parameters with having Ω = Vx+Vy as a
weighting matrix from each stock covariance matrix Vx and Vy. This metric takes into
account the correlation between the data and the information about the stochastic dynamic structure of the time series volatilities. This model is very useful for unequal length time series.
Also, we use the Euclidean distance as another metric for comparison. Euclidean distance is the "ordinary" distance between two points that one would measure with a ruler, and is given by the Pythagorean formula. By using this formula as distance, Euclidean space (or even any inner product space) becomes a metric space. The associated norm is called the “Euclidean norm”. It has the following equation:
(9.1)
or using the matrix notation,
d(x, y) = [(Tx - Ty)(Tx - Ty)′]0.5 (9.2)
The third metric is the combined Mahalanobis and the Euclidean distance by using the inverse of the sample standard deviation of the corresponding pairwise distances as a weight. This translates higher uncertainty in the estimates with a smaller weight, and
less uncertain ones with a larger weight; thus, we believe that it could increase more power of the metric than the previous methods we used. It takes the following equation:
dCombined(x,y) = w1[(Tx – Ty)′Ω-1(Tx – Ty)]0.5 + w2[(Tx - Ty)(Tx - Ty)′]0.5 (10)
where wi , i = 1,2, are weighting parameters. We expect this to be an improved version
of the distance metric we consider.
Cluster analysis of time series attempts to identify clusters of data points in a multivariate data set. We also can regard it as data segmentation due to its relation to grouping or segmenting a collection of objects into subsets or clusters. We use the most commonly used clustering method, i.e., the hierarchical clustering. In hierarchical clustering the data are not partitioned into a particular cluster in a single step. Instead, a series of partitions takes place, which may run from a single cluster containing all objects to n clusters each containing a single object. Hierarchical clustering is subdivided into agglomerative methods, in which one starts at the leaves and successively merges clusters together; or divisive methods, in which one starts at the root and recursively splits the clusters. Agglomerative techniques are more commonly used and in this study, we refer the cluster analysis to this method. Hierarchical clustering may be represented by a two dimensional diagram known as dendrogram which illustrates the fusions or divisions made at each successive stage of analysis. The results of the cluster analysis are shown by a dendrogram, which lists all of the samples and indicates at what level of similarity any two clusters were joined. The x-axis is a measure of the similarity or distance at which clusters join and different programs use different measures on this axis. Clusters may join pairwise, or individual samples may be sequentially added to an existing cluster. Such sequential joining of individual samples is known as ‘chaining’.
2.3 Multidimensional Scaling
Multidimensional scaling (MDS) can be considered to be an alternative to factor analysis. In general, the goal of the analysis is to detect meaningful underlying dimensions that allow the researcher to explain observed similarities or dissimilarities (distances) between the investigated objects. In factor analysis, the similarities between objects (e.g., variables) are expressed in the correlation matrix. With multidimensional scaling, one can analyze any kind of similarity or dissimilarity matrix, in addition to correlation matrices. In general, MDS attempts to arrange objects (our TGARCH (1,1) model parameters here) in a space with a particular number of dimensions, say, two-dimension, so as to reproduce the observed distances. As a result, we can explain the distances in terms of underlying dimensions; in our
data structure analysis, we could explain the distances in terms of the two-dimension map. This plot also helps to identify the clusters.
We begin the MDS by first apply the principal component analysis (PCA) for the dimension reduction purpose. This is the important step in generating dimensions for the multidimensional scaling map. In the PCA, all the observed variance is analyzed while it is only the shared variance that is analyzed in the factor analysis. We also use the Matlab software to facilitate us in this step in calculation of eigenvectors to generate the eigenvalues used in generating data dimensions. Then we plot the two-dimensional graph or multidimensional scaling map of the data to see how far the stocks are from each other when we translate the stock return volatilities into the distance term context.
3. Data
The data used in this article consists of time series of the 50 blue-chip Taiwan daily stocks and the 50 blue-chip Thailand daily stocks used to compute FTSE TWSE Taiwan 50 index and SET 50 index, respectively; these are shown in table 1 and table 2, for the period from 21 April 2005 to 6 May 2010 (1,254 daily observations for Taiwan and 1,232 daily observations for Thailand; please note that the difference is due to the difference in holidays between the two countries, and both indices are market-capitalization weighted index.). We use the constituent stock lists announced in the second quarter of 2010 for both countries as our criteria. The FTSE TWSE Taiwan 50 Index data is obtained from TEJ (Taiwan Economic Journal) and the SET 50 Index data is obtained from SETSMART (SET Market Analysis and Reporting Tool) database - the web-based application from the Stock Exchange of Thailand that can seamlessly integrate comprehensive sources of Thai listed company data. We use the closing price as provided in the two databases to calculate the log-daily return as our major input in the TGARCH (1, 1) model. The two indices have one stock in common, i.e., Delta Electronics PCL (dual-listed stock). Because the different in industry classification between the countries, we have reclassified table 1 by using the same criteria as SET 50 index shown in table 2 for the cross- reference and the consistency in classification; this is shown in table 3. Then we will use this classification at industry level as our proxy in the result analysis.
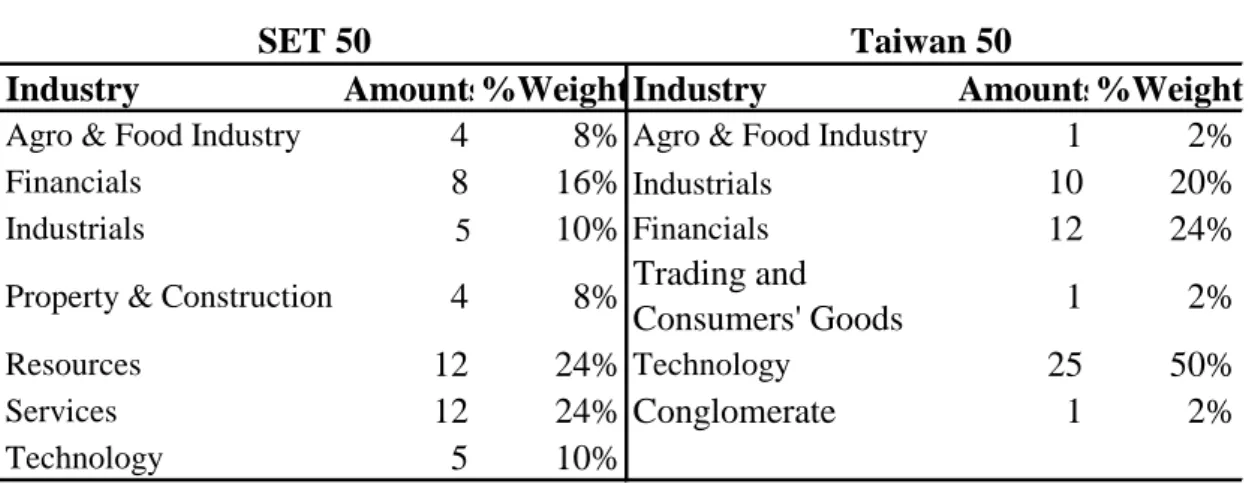
In addition, owing to the fact that we gather numerous stock prices and returns data during a bit long periods, some stocks that listed to the exchange later than 21 April 2005, do not have such available data for us. We also make a brief comparison between the two index compositions by industry classified according to the table 3, which is shown in table 4. It is shown that the greatest weight is laid in technology
industry for Taiwan 50 index then followed by financials and industrials. We see a different picture for SET 50 index; resources and services have equal and greatest weight then financials is the next greater weight while technology and industrials have equal and lower weight. This is partly due to the nature of the industries that fit into each country and different stock-selection criteria between the two indices.
Table 5 presents the stocks that have insufficient observations. These data still can be used in the Mahalanobis-like distance metric, but it cannot be used in the Euclidean distance metric. However, we treated all the data that have sufficient observations the same and omitted the insufficient data observations to avoid the complication in comparison between the time periods. Please note that Pegatron Corp (Taiwan) have no observation since the announcement of Asustek Computer Inc. (Taiwan) to demerge Pegatron Corp, dated 4 May 2010 and 18 June 2010.
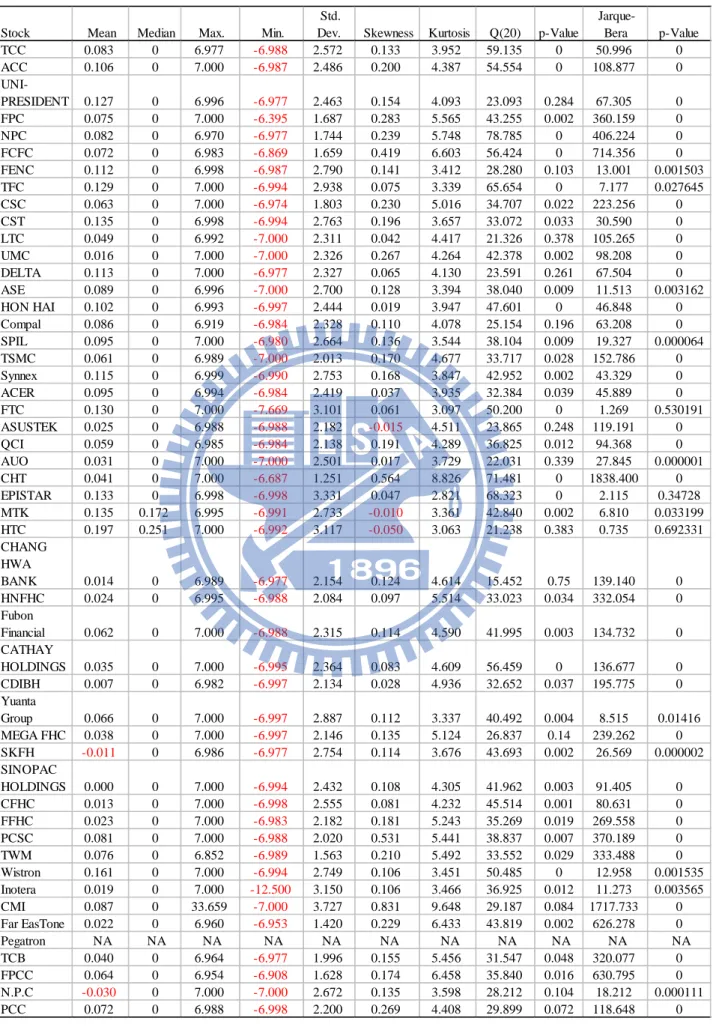
Table 6 and table 7 present the summary statistics (mean, median, maximum, minimum, standard deviation, skewness, kurtosis, Ljung-Box test statistic for serial correlation and its p-value, and Jarque-Bera test statistic and its p-value) for daily stock returns of each index.
For Taiwan 50 index data shown in table 6, Asustek Computer, MediaTek, and HTC; all are in technology industry, exhibit negative skewness, which shows that the distribution of the returns have long left tails, the latter two also have non-zero median. Most stocks have positive mean, except for Shin Kong Financial Holding and Nan Ya Printed Circuit Board. There are no significant more than 10% level up to order 20 in the returns for most stocks, except for Uni-president Enterprises, Far Eastern Textile, Lite-On Technology, Delta Electronics, Compal Electronics, Asustek Computer Inc, AU Optronics, HTC, Chang Hwa Commercial Bank, Mega Financial Holding, and Nan Ya Printed Circuit Board. Moreover, after we checked for the distribution of the daily stock return by calculating Jarque-Bera statistic, we found that Foxconn Technology, Epistar, and HTC have non-normal distribution and most stocks are slightly leptokurtic with the exception of Epistar.
For SET 50 index data shown in table 7, all stocks have zero median, but there are 16 stocks that have negative mean returns; these are TMB Bank, Siam City Cement, Tata Steel, Esso, PTT Aromatics and Refining, Ratchaburi Electricity Generating Holding, Thaioil, Airports of Thailand, Bangkok Expressway, Precious Shipping, Thai Airways International, Thoresen Thai Agencies, Advanced Info Service, DTAC, and True Corporation. There are 18 stocks that have positive skewness. In addition, all stocks are highly leptokurtic. There are 10 stocks that have serial correlation, which are Khon Kaen Sugar Industry, Minor International, TMB Bank, Siam City Cement, Land and Houses, Pruksa Real Estate, The Bangchak Petroleum, Thai Tap Water Supply, Big C Supercenter, and Bumrungrad Hospital.
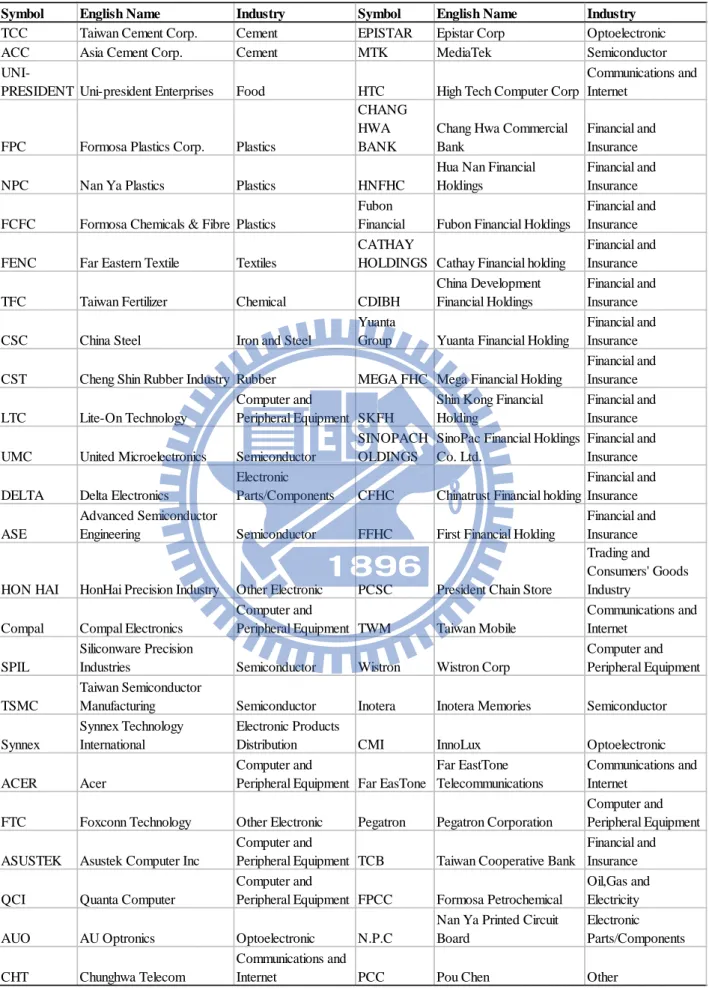
Table 1: Stocks used to compute the FTSE TWSE Taiwan 50 index.
Symbol English Name Industry Symbol English Name Industry TCC Taiwan Cement Corp. Cement EPISTAR Epistar Corp Optoelectronic
ACC Asia Cement Corp. Cement MTK MediaTek Semiconductor
UNI-PRESIDENT Uni-president Enterprises Food HTC High Tech Computer Corp
Communications and Internet
FPC Formosa Plastics Corp. Plastics
CHANG HWA BANK
Chang Hwa Commercial Bank
Financial and Insurance
NPC Nan Ya Plastics Plastics HNFHC
Hua Nan Financial Holdings
Financial and Insurance FCFC Formosa Chemicals & Fibre Plastics
Fubon
Financial Fubon Financial Holdings
Financial and Insurance FENC Far Eastern Textile Textiles
CATHAY
HOLDINGS Cathay Financial holding
Financial and Insurance TFC Taiwan Fertilizer Chemical CDIBH
China Development Financial Holdings
Financial and Insurance CSC China Steel Iron and Steel
Yuanta
Group Yuanta Financial Holding
Financial and Insurance CST Cheng Shin Rubber Industry Rubber MEGA FHC Mega Financial Holding
Financial and Insurance LTC Lite-On Technology
Computer and
Peripheral Equipment SKFH
Shin Kong Financial Holding
Financial and Insurance UMC United Microelectronics Semiconductor
SINOPACH OLDINGS
SinoPac Financial Holdings Co. Ltd.
Financial and Insurance DELTA Delta Electronics
Electronic
Parts/Components CFHC Chinatrust Financial holding
Financial and Insurance ASE
Advanced Semiconductor
Engineering Semiconductor FFHC First Financial Holding
Financial and Insurance HON HAI HonHai Precision Industry Other Electronic PCSC President Chain Store
Trading and Consumers' Goods Industry
Compal Compal Electronics
Computer and
Peripheral Equipment TWM Taiwan Mobile
Communications and Internet
SPIL
Siliconware Precision
Industries Semiconductor Wistron Wistron Corp
Computer and Peripheral Equipment TSMC
Taiwan Semiconductor
Manufacturing Semiconductor Inotera Inotera Memories Semiconductor Synnex
Synnex Technology International
Electronic Products
Distribution CMI InnoLux Optoelectronic
ACER Acer
Computer and
Peripheral Equipment Far EasTone
Far EastTone Telecommunications
Communications and Internet
FTC Foxconn Technology Other Electronic Pegatron Pegatron Corporation
Computer and Peripheral Equipment ASUSTEK Asustek Computer Inc
Computer and
Peripheral Equipment TCB Taiwan Cooperative Bank
Financial and Insurance QCI Quanta Computer
Computer and
Peripheral Equipment FPCC Formosa Petrochemical
Oil,Gas and Electricity AUO AU Optronics Optoelectronic N.P.C
Nan Ya Printed Circuit Board
Electronic Parts/Components CHT Chunghwa Telecom
Communications and
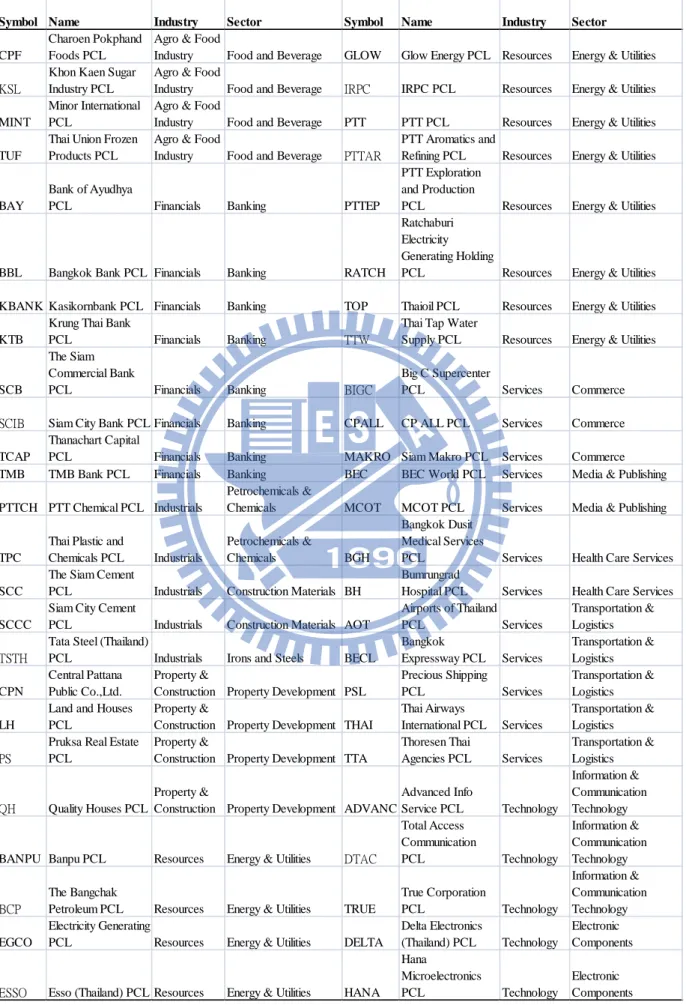
Table 2: Stocks used to compute the SET 50 index.
Symbol Name Industry Sector Symbol Name Industry Sector
CPF
Charoen Pokphand Foods PCL
Agro & Food
Industry Food and Beverage GLOW Glow Energy PCL Resources Energy & Utilities KSL
Khon Kaen Sugar Industry PCL
Agro & Food
Industry Food and Beverage IRPC IRPC PCL Resources Energy & Utilities MINT
Minor International PCL
Agro & Food
Industry Food and Beverage PTT PTT PCL Resources Energy & Utilities TUF
Thai Union Frozen Products PCL
Agro & Food
Industry Food and Beverage PTTAR
PTT Aromatics and
Refining PCL Resources Energy & Utilities
BAY
Bank of Ayudhya
PCL Financials Banking PTTEP
PTT Exploration and Production
PCL Resources Energy & Utilities
BBL Bangkok Bank PCL Financials Banking RATCH
Ratchaburi Electricity Generating Holding
PCL Resources Energy & Utilities KBANK Kasikornbank PCL Financials Banking TOP Thaioil PCL Resources Energy & Utilities KTB
Krung Thai Bank
PCL Financials Banking TTW
Thai Tap Water
Supply PCL Resources Energy & Utilities
SCB
The Siam Commercial Bank
PCL Financials Banking BIGC
Big C Supercenter
PCL Services Commerce SCIB Siam City Bank PCL Financials Banking CPALL CP ALL PCL Services Commerce TCAP
Thanachart Capital
PCL Financials Banking MAKRO Siam Makro PCL Services Commerce TMB TMB Bank PCL Financials Banking BEC BEC World PCL Services Media & Publishing PTTCH PTT Chemical PCL Industrials
Petrochemicals &
Chemicals MCOT MCOT PCL Services Media & Publishing
TPC
Thai Plastic and
Chemicals PCL Industrials
Petrochemicals &
Chemicals BGH
Bangkok Dusit Medical Services
PCL Services Health Care Services SCC
The Siam Cement
PCL Industrials Construction Materials BH
Bumrungrad
Hospital PCL Services Health Care Services SCCC
Siam City Cement
PCL Industrials Construction Materials AOT
Airports of Thailand PCL Services
Transportation & Logistics TSTH
Tata Steel (Thailand)
PCL Industrials Irons and Steels BECL
Bangkok Expressway PCL Services Transportation & Logistics CPN Central Pattana Public Co.,Ltd. Property &
Construction Property Development PSL
Precious Shipping
PCL Services
Transportation & Logistics LH
Land and Houses PCL
Property &
Construction Property Development THAI
Thai Airways
International PCL Services
Transportation & Logistics PS
Pruksa Real Estate PCL
Property &
Construction Property Development TTA
Thoresen Thai Agencies PCL Services Transportation & Logistics QH Quality Houses PCL Property &
Construction Property Development ADVANC
Advanced Info
Service PCL Technology
Information & Communication Technology
BANPU Banpu PCL Resources Energy & Utilities DTAC
Total Access Communication PCL Technology Information & Communication Technology BCP The Bangchak
Petroleum PCL Resources Energy & Utilities TRUE
True Corporation PCL Technology Information & Communication Technology EGCO Electricity Generating
PCL Resources Energy & Utilities DELTA
Delta Electronics
(Thailand) PCL Technology
Electronic Components
ESSO Esso (Thailand) PCL Resources Energy & Utilities HANA Hana
Microelectronics
PCL Technology
Electronic Components
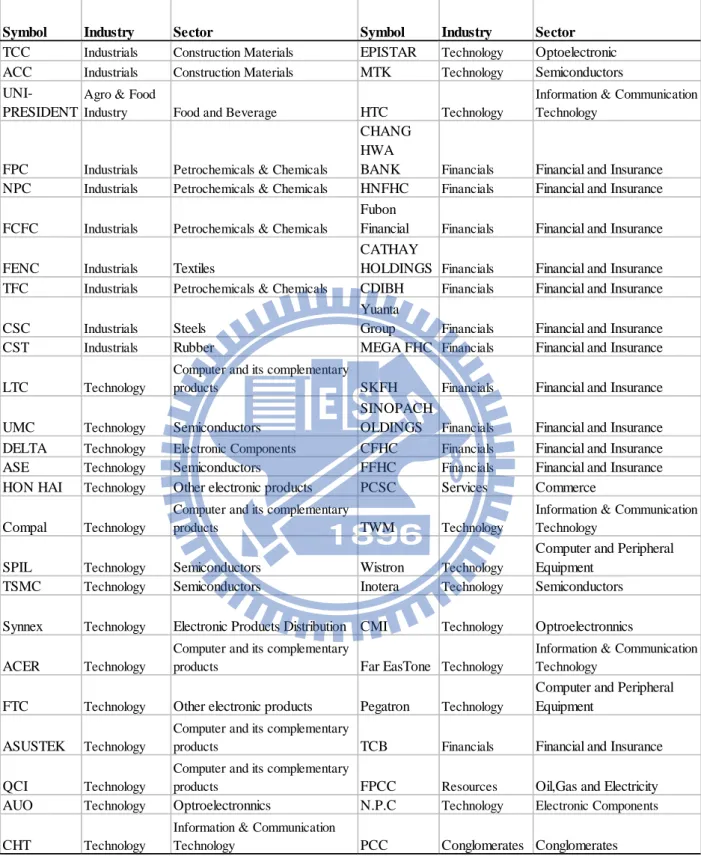
Symbol Industry Sector Symbol Industry Sector TCC Industrials Construction Materials EPISTAR Technology Optoelectronic ACC Industrials Construction Materials MTK Technology Semiconductors
UNI-PRESIDENT
Agro & Food
Industry Food and Beverage HTC Technology
Information & Communication Technology
FPC Industrials Petrochemicals & Chemicals
CHANG HWA
BANK Financials Financial and Insurance NPC Industrials Petrochemicals & Chemicals HNFHC Financials Financial and Insurance FCFC Industrials Petrochemicals & Chemicals
Fubon
Financial Financials Financial and Insurance FENC Industrials Textiles
CATHAY
HOLDINGS Financials Financial and Insurance TFC Industrials Petrochemicals & Chemicals CDIBH Financials Financial and Insurance CSC Industrials Steels
Yuanta
Group Financials Financial and Insurance CST Industrials Rubber MEGA FHC Financials Financial and Insurance LTC Technology
Computer and its complementary
products SKFH Financials Financial and Insurance UMC Technology Semiconductors
SINOPACH
OLDINGS Financials Financial and Insurance DELTA Technology Electronic Components CFHC Financials Financial and Insurance ASE Technology Semiconductors FFHC Financials Financial and Insurance HON HAI Technology Other electronic products PCSC Services Commerce
Compal Technology
Computer and its complementary
products TWM Technology
Information & Communication Technology
SPIL Technology Semiconductors Wistron Technology
Computer and Peripheral Equipment
TSMC Technology Semiconductors Inotera Technology Semiconductors Synnex Technology Electronic Products Distribution CMI Technology Optroelectronnics ACER Technology
Computer and its complementary
products Far EasTone Technology
Information & Communication Technology
FTC Technology Other electronic products Pegatron Technology
Computer and Peripheral Equipment
ASUSTEK Technology
Computer and its complementary
products TCB Financials Financial and Insurance QCI Technology
Computer and its complementary
products FPCC Resources Oil,Gas and Electricity AUO Technology Optroelectronnics N.P.C Technology Electronic Components
CHT Technology
Information & Communication
Technology PCC Conglomerates Conglomerates
Table 3: Stocks used to compute the Taiwan 50 index, reclassified by using the same criteria as those of the SET 50 index.
Table 4: Index Comparison by Industry.
Industry Amounts%Weight Industry Amounts%Weight
Agro & Food Industry 4 8% Agro & Food Industry 1 2% Financials 8 16% Industrials 10 20% Industrials 5 10% Financials 12 24% Property & Construction 4 8% Trading and
Consumers' Goods 1 2% Resources 12 24% Technology 25 50%
Services 12 24% Conglomerate 1 2%
Technology 5 10%
SET 50 Taiwan 50
Table 5: Insufficient data stocks.
Symbol Observation Number Symbol Observation Number
Inotera 1030 PTTCH 1073 CMI 878 PS 1077 Pegatron 0 ESSO 488 N.P.C 1016 PTTAR 571 TTW 477 DTAC 701 Taiwan Thailand
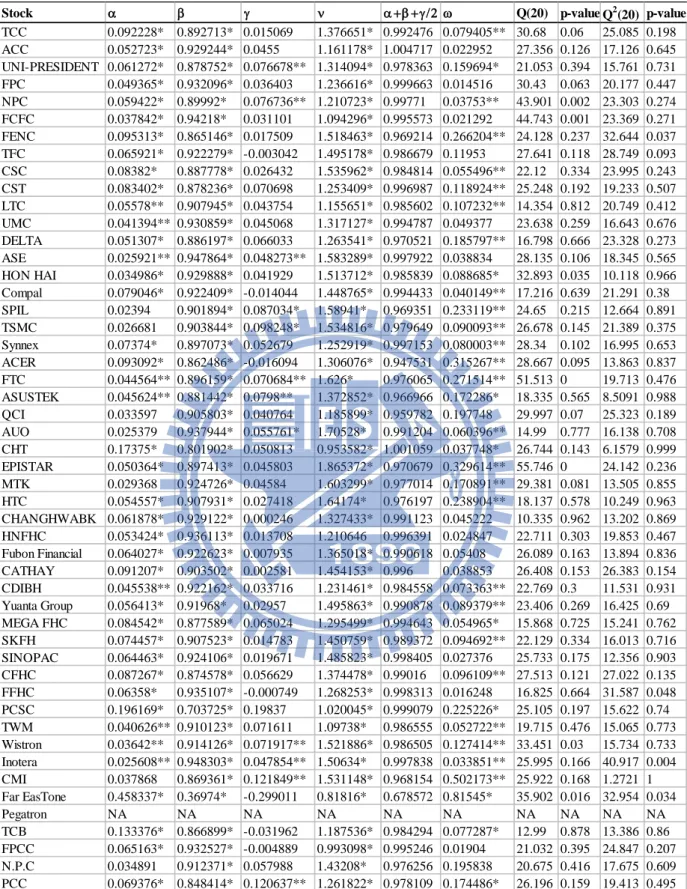
Table 8 and table 9 show the estimated results of TGARCH (1, 1) models for our stock index returns with GED innovations, including diagnostic tests for residual and squared residuals.
Table 8 shows that the estimated coefficients are statistically significant for all stocks except the ARCH (α) estimates for Siliconware Precision Industries, TSMC, Quanta Computer, AU Optronics, MediaTek, and Nan Ya Printed Circuit Board, which are not significant at 5% level, and many stocks show that the leverage effects (γ) are not statistically significant at the same level for Taiwan 50 index; only 12 stocks are significant. The ν results from the table 8 also confirm us that the distribution of the innovation series is fat-tailed for all stocks and the estimated persistence in the conditional variance (α+β+γ/2) is very close to one, which means the less weight that's left over for the long-run variance, or put another way, the greater the persistence to recent variance exists for those of Taiwan.
Stock Mean Median Max. Min.
Std.
Dev. Skewness Kurtosis Q(20) p-Value
Jarque-Bera p-Value TCC 0.083 0 6.977 -6.988 2.572 0.133 3.952 59.135 0 50.996 0 ACC 0.106 0 7.000 -6.987 2.486 0.200 4.387 54.554 0 108.877 0 UNI-PRESIDENT 0.127 0 6.996 -6.977 2.463 0.154 4.093 23.093 0.284 67.305 0 FPC 0.075 0 7.000 -6.395 1.687 0.283 5.565 43.255 0.002 360.159 0 NPC 0.082 0 6.970 -6.977 1.744 0.239 5.748 78.785 0 406.224 0 FCFC 0.072 0 6.983 -6.869 1.659 0.419 6.603 56.424 0 714.356 0 FENC 0.112 0 6.998 -6.987 2.790 0.141 3.412 28.280 0.103 13.001 0.001503 TFC 0.129 0 7.000 -6.994 2.938 0.075 3.339 65.654 0 7.177 0.027645 CSC 0.063 0 7.000 -6.974 1.803 0.230 5.016 34.707 0.022 223.256 0 CST 0.135 0 6.998 -6.994 2.763 0.196 3.657 33.072 0.033 30.590 0 LTC 0.049 0 6.992 -7.000 2.311 0.042 4.417 21.326 0.378 105.265 0 UMC 0.016 0 7.000 -7.000 2.326 0.267 4.264 42.378 0.002 98.208 0 DELTA 0.113 0 7.000 -6.977 2.327 0.065 4.130 23.591 0.261 67.504 0 ASE 0.089 0 6.996 -7.000 2.700 0.128 3.394 38.040 0.009 11.513 0.003162 HON HAI 0.102 0 6.993 -6.997 2.444 0.019 3.947 47.601 0 46.848 0 Compal 0.086 0 6.919 -6.984 2.328 0.110 4.078 25.154 0.196 63.208 0 SPIL 0.095 0 7.000 -6.980 2.664 0.136 3.544 38.104 0.009 19.327 0.000064 TSMC 0.061 0 6.989 -7.000 2.013 0.170 4.677 33.717 0.028 152.786 0 Synnex 0.115 0 6.999 -6.990 2.753 0.168 3.847 42.952 0.002 43.329 0 ACER 0.095 0 6.994 -6.984 2.419 0.037 3.935 32.384 0.039 45.889 0 FTC 0.130 0 7.000 -7.669 3.101 0.061 3.097 50.200 0 1.269 0.530191 ASUSTEK 0.025 0 6.988 -6.988 2.182 -0.015 4.511 23.865 0.248 119.191 0 QCI 0.059 0 6.985 -6.984 2.138 0.191 4.289 36.825 0.012 94.368 0 AUO 0.031 0 7.000 -7.000 2.501 0.017 3.729 22.031 0.339 27.845 0.000001 CHT 0.041 0 7.000 -6.687 1.251 0.564 8.826 71.481 0 1838.400 0 EPISTAR 0.133 0 6.998 -6.998 3.331 0.047 2.821 68.323 0 2.115 0.34728 MTK 0.135 0.172 6.995 -6.991 2.733 -0.010 3.361 42.840 0.002 6.810 0.033199 HTC 0.197 0.251 7.000 -6.992 3.117 -0.050 3.063 21.238 0.383 0.735 0.692331 CHANG HWA BANK 0.014 0 6.989 -6.977 2.154 0.124 4.614 15.452 0.75 139.140 0 HNFHC 0.024 0 6.995 -6.988 2.084 0.097 5.514 33.023 0.034 332.054 0 Fubon Financial 0.062 0 7.000 -6.988 2.315 0.114 4.590 41.995 0.003 134.732 0 CATHAY HOLDINGS 0.035 0 7.000 -6.995 2.364 0.083 4.609 56.459 0 136.677 0 CDIBH 0.007 0 6.982 -6.997 2.134 0.028 4.936 32.652 0.037 195.775 0 Yuanta Group 0.066 0 7.000 -6.997 2.887 0.112 3.337 40.492 0.004 8.515 0.01416 MEGA FHC 0.038 0 7.000 -6.997 2.146 0.135 5.124 26.837 0.14 239.262 0 SKFH -0.011 0 6.986 -6.977 2.754 0.114 3.676 43.693 0.002 26.569 0.000002 SINOPAC HOLDINGS 0.000 0 7.000 -6.994 2.432 0.108 4.305 41.962 0.003 91.405 0 CFHC 0.013 0 7.000 -6.998 2.555 0.081 4.232 45.514 0.001 80.631 0 FFHC 0.023 0 7.000 -6.983 2.182 0.181 5.243 35.269 0.019 269.558 0 PCSC 0.081 0 7.000 -6.988 2.020 0.531 5.441 38.837 0.007 370.189 0 TWM 0.076 0 6.852 -6.989 1.563 0.210 5.492 33.552 0.029 333.488 0 Wistron 0.161 0 7.000 -6.994 2.749 0.106 3.451 50.485 0 12.958 0.001535 Inotera 0.019 0 7.000 -12.500 3.150 0.106 3.466 36.925 0.012 11.273 0.003565 CMI 0.087 0 33.659 -7.000 3.727 0.831 9.648 29.187 0.084 1717.733 0 Far EasTone 0.022 0 6.960 -6.953 1.420 0.229 6.433 43.819 0.002 626.278 0 Pegatron NA NA NA NA NA NA NA NA NA NA NA TCB 0.040 0 6.964 -6.977 1.996 0.155 5.456 31.547 0.048 320.077 0 FPCC 0.064 0 6.954 -6.908 1.628 0.174 6.458 35.840 0.016 630.795 0 N.P.C -0.030 0 7.000 -7.000 2.672 0.135 3.598 28.212 0.104 18.212 0.000111 PCC 0.072 0 6.988 -6.998 2.200 0.269 4.408 29.899 0.072 118.648 0
Stock Mean Median Max. Min. Std. Dev. Skewness Kurtosis Q(20) p-Value Jarque-Bera p-Value CPF 0.113 0 11.531 -13.492 1.961 0.086 7.962 34.174 0.025 1265.374 0 KSL 0.077 0 16.012 -12.629 2.488 0.446 9.400 22.458 0.316 2143.256 0 MINT 7.650 0 1601.208 -1262.937 248.776 0.446 9.400 22.458 0.316 2143.256 0 TUF 0.029 0 12.222 -10.110 1.704 0.273 8.826 30.761 0.058 1757.879 0 BAY 0.042 0 15.541 -21.203 2.711 -0.391 13.507 94.804 0 5698.841 0 BBL 0.012 0 7.647 -17.746 2.182 -1.014 12.373 34.163 0.025 4720.897 0 KBANK 0.042 0 11.488 -20.383 2.289 -0.611 10.252 32.704 0.036 2776.034 0 KTB 0.028 0 14.493 -24.313 2.415 -0.749 14.668 38.23 0.008 7103.200 0 SCB 0.043 0 13.936 -23.245 2.466 -0.610 13.172 57.425 0 5387.445 0 SCIB 0.022 0 25.783 -21.452 2.700 0.598 21.470 38.102 0.009 17584.820 0 TCAP 0.036 0 24.177 -23.428 2.607 -0.078 18.823 43.625 0.002 12853.110 0 TMB -0.088 0 16.956 -19.464 2.862 -0.047 10.577 27.765 0.115 2947.912 0 PTTCH 0.021 0 16.202 -15.312 3.041 -0.085 6.817 39.388 0.006 652.646 0 TPC 0.002 0 9.467 -11.966 1.688 -0.289 12.249 55.345 0 4408.566 0 SCC 0.008 0 11.839 -13.353 1.918 0.074 8.840 53.589 0 1751.977 0 SCCC -0.022 0 10.863 -16.579 2.144 -0.581 9.457 16.111 0.71 2209.664 0 TSTH -0.001 0 20.479 -19.216 3.107 0.356 9.732 50.456 0 2352.265 0 CPN 0.080 0 22.012 -20.391 2.942 -0.044 11.135 37.981 0.009 3397.818 0 LH -0.031 0 13.353 -16.149 3.091 -0.054 5.693 27.323 0.126 372.797 0 PS 0.123 0 18.232 -23.111 3.290 -0.143 9.622 23.02 0.288 1971.352 0 QH 0.045 0 17.997 -23.419 3.194 -0.385 10.859 36.56 0.013 3200.744 0 BANPU 0.113 0 16.562 -18.610 2.731 -0.518 9.768 44.261 0.001 2406.195 0 BCP 0.008 0 10.841 -18.082 1.980 -0.274 12.520 22.686 0.304 4667.717 0 EGCO 0.004 0 9.953 -12.551 1.573 -0.074 9.803 36.509 0.013 2376.860 0 ESSO -0.094 0 15.104 -15.498 2.934 0.418 9.067 38.193 0.008 762.600 0 GLOW 0.039 0 13.249 -11.212 2.209 0.056 7.477 39.134 0.006 1029.343 0 IRPC -0.008 0 15.674 -30.187 2.868 -0.784 16.986 54.433 0 10159.790 0 PTT 0.024 0 14.953 -18.590 2.427 -0.284 9.388 35.785 0.016 2111.484 0 PTTAR -0.082 0 16.705 -17.520 3.619 -0.017 6.229 58.967 0 247.241 0 PTTEP 0.066 0 13.936 -18.786 2.626 -0.188 9.383 41.163 0.004 2097.019 0 RATCH -0.006 0 21.963 -14.364 1.869 0.825 27.209 80.488 0 30223.860 0 TOP -0.023 0 13.103 -18.058 2.652 -0.031 8.340 44.23 0.001 1464.165 0 TTW 0.000 0 7.930 -7.784 1.859 0.199 5.341 22.05 0.338 112.082 0 BIGC 0.069 0 9.309 -10.616 1.803 0.417 8.280 24.228 0.233 1466.842 0 CPALL 0.131 0 19.949 -16.068 2.439 0.679 12.452 41.825 0.003 4677.311 0 MAKRO 0.049 0 25.996 -20.671 2.301 0.758 24.402 44.585 0.001 23630.630 0 BEC 0.042 0 19.449 -19.913 2.439 -0.091 12.416 61.262 0 4553.403 0 MCOT 0.004 0 15.906 -19.213 2.515 -0.275 11.355 34.93 0.02 3599.277 0 BGH 0.035 0 8.701 -11.576 2.002 -0.268 7.141 36.434 0.014 895.154 0 BH 0.047 0 10.219 -9.421 2.012 0.016 6.280 26.704 0.144 552.268 0 AOT -0.014 0 14.970 -16.315 2.480 -0.295 11.396 76.44 0 3636.375 0 BECL -0.026 0 7.411 -10.646 1.486 -0.527 7.990 33.804 0.027 1335.239 0 PSL -0.029 0 18.340 -16.375 2.973 0.122 7.953 34.319 0.024 1261.130 0 THAI -0.042 0 16.407 -14.585 2.719 0.139 7.515 32.477 0.038 1050.234 0 TTA -0.037 0 15.841 -26.706 3.399 -0.605 9.439 33.08 0.033 2203.481 0 ADVANC -0.018 0 14.660 -23.361 2.307 -0.718 14.625 41.891 0.003 7043.456 0 DTAC -0.026 0 18.572 -16.228 2.827 0.493 11.033 57.017 0 1913.069 0 TRUE -0.093 0 16.846 -35.208 3.696 -0.762 13.314 46.453 0.001 5579.445 0 DELTA 0.004 0 10.368 -12.783 2.120 -0.431 7.567 42.172 0.003 1108.909 0 HANA 0.011 0 8.743 -13.482 2.136 -0.468 7.760 29.648 0.076 1208.030 0 Table 7: Summary statistics for SET 50 index stock returns.
Stock α β γ ν α+β +γ/2 ω Q(20) p-value Q2 (20) p-value TCC 0.092228* 0.892713* 0.015069 1.376651* 0.992476 0.079405** 30.68 0.06 25.085 0.198 ACC 0.052723* 0.929244* 0.0455 1.161178* 1.004717 0.022952 27.356 0.126 17.126 0.645 UNI-PRESIDENT 0.061272* 0.878752* 0.076678** 1.314094* 0.978363 0.159694* 21.053 0.394 15.761 0.731 FPC 0.049365* 0.932096* 0.036403 1.236616* 0.999663 0.014516 30.43 0.063 20.177 0.447 NPC 0.059422* 0.89992* 0.076736** 1.210723* 0.99771 0.03753** 43.901 0.002 23.303 0.274 FCFC 0.037842* 0.94218* 0.031101 1.094296* 0.995573 0.021292 44.743 0.001 23.369 0.271 FENC 0.095313* 0.865146* 0.017509 1.518463* 0.969214 0.266204** 24.128 0.237 32.644 0.037 TFC 0.065921* 0.922279* -0.003042 1.495178* 0.986679 0.11953 27.641 0.118 28.749 0.093 CSC 0.08382* 0.887778* 0.026432 1.535962* 0.984814 0.055496** 22.12 0.334 23.995 0.243 CST 0.083402* 0.878236* 0.070698 1.253409* 0.996987 0.118924** 25.248 0.192 19.233 0.507 LTC 0.05578** 0.907945* 0.043754 1.155651* 0.985602 0.107232** 14.354 0.812 20.749 0.412 UMC 0.041394** 0.930859* 0.045068 1.317127* 0.994787 0.049377 23.638 0.259 16.643 0.676 DELTA 0.051307* 0.886197* 0.066033 1.263541* 0.970521 0.185797** 16.798 0.666 23.328 0.273 ASE 0.025921** 0.947864* 0.048273** 1.583289* 0.997922 0.038834 28.135 0.106 18.345 0.565 HON HAI 0.034986* 0.929888* 0.041929 1.513712* 0.985839 0.088685* 32.893 0.035 10.118 0.966 Compal 0.079046* 0.922409* -0.014044 1.448765* 0.994433 0.040149** 17.216 0.639 21.291 0.38 SPIL 0.02394 0.901894* 0.087034* 1.58941* 0.969351 0.233119** 24.65 0.215 12.664 0.891 TSMC 0.026681 0.903844* 0.098248* 1.534816* 0.979649 0.090093** 26.678 0.145 21.389 0.375 Synnex 0.07374* 0.897073* 0.052679 1.252919* 0.997153 0.080003** 28.34 0.102 16.995 0.653 ACER 0.093092* 0.862486* -0.016094 1.306076* 0.947531 0.315267** 28.667 0.095 13.863 0.837 FTC 0.044564** 0.896159* 0.070684** 1.626* 0.976065 0.271514** 51.513 0 19.713 0.476 ASUSTEK 0.045624** 0.881442* 0.0798** 1.372852* 0.966966 0.172286* 18.335 0.565 8.5091 0.988 QCI 0.033597 0.905803* 0.040764 1.185899* 0.959782 0.197748 29.997 0.07 25.323 0.189 AUO 0.025379 0.937944* 0.055761* 1.70528* 0.991204 0.060396** 14.99 0.777 16.138 0.708 CHT 0.17375* 0.801902* 0.050813 0.953582* 1.001059 0.037748* 26.744 0.143 6.1579 0.999 EPISTAR 0.050364* 0.897413* 0.045803 1.865372* 0.970679 0.329614** 55.746 0 24.142 0.236 MTK 0.029368 0.924726* 0.04584 1.603299* 0.977014 0.170891** 29.381 0.081 13.505 0.855 HTC 0.054557* 0.907931* 0.027418 1.64174* 0.976197 0.238904** 18.137 0.578 10.249 0.963 CHANGHWABK 0.061878* 0.929122* 0.000246 1.327433* 0.991123 0.045222 10.335 0.962 13.202 0.869 HNFHC 0.053424* 0.936113* 0.013708 1.210646 0.996391 0.024847 22.711 0.303 19.853 0.467 Fubon Financial 0.064027* 0.922623* 0.007935 1.365018* 0.990618 0.05408 26.089 0.163 13.894 0.836 CATHAY 0.091207* 0.903502* 0.002581 1.454153* 0.996 0.038853 26.408 0.153 26.383 0.154 CDIBH 0.045538** 0.922162* 0.033716 1.231461* 0.984558 0.073363** 22.769 0.3 11.531 0.931 Yuanta Group 0.056413* 0.91968* 0.02957 1.495863* 0.990878 0.089379** 23.406 0.269 16.425 0.69 MEGA FHC 0.084542* 0.877589* 0.065024 1.295499* 0.994643 0.054965* 15.868 0.725 15.241 0.762 SKFH 0.074457* 0.907523* 0.014783 1.450759* 0.989372 0.094692** 22.129 0.334 16.013 0.716 SINOPAC 0.064463* 0.924106* 0.019671 1.485823* 0.998405 0.027376 25.733 0.175 12.356 0.903 CFHC 0.087267* 0.874578* 0.056629 1.374478* 0.99016 0.096109** 27.513 0.121 27.022 0.135 FFHC 0.06358* 0.935107* -0.000749 1.268253* 0.998313 0.016248 16.825 0.664 31.587 0.048 PCSC 0.196169* 0.703725* 0.19837 1.020045* 0.999079 0.225226* 25.105 0.197 15.622 0.74 TWM 0.040626** 0.910123* 0.071611 1.09738* 0.986555 0.052722** 19.715 0.476 15.065 0.773 Wistron 0.03642** 0.914126* 0.071917** 1.521886* 0.986505 0.127414** 33.451 0.03 15.734 0.733 Inotera 0.025608** 0.948303* 0.047854** 1.50634* 0.997838 0.033851** 25.995 0.166 40.917 0.004 CMI 0.037868 0.869361* 0.121849** 1.531148* 0.968154 0.502173** 25.922 0.168 1.2721 1 Far EasTone 0.458337* 0.36974* -0.299011 0.81816* 0.678572 0.81545* 35.902 0.016 32.954 0.034 Pegatron NA NA NA NA NA NA NA NA NA NA TCB 0.133376* 0.866899* -0.031962 1.187536* 0.984294 0.077287* 12.99 0.878 13.386 0.86 FPCC 0.065163* 0.932527* -0.004889 0.993098* 0.995246 0.01904 21.032 0.395 24.847 0.207 N.P.C 0.034891 0.912371* 0.057988 1.43208* 0.976256 0.195838 20.675 0.416 17.675 0.609 PCC 0.069376* 0.848414* 0.120637** 1.261822* 0.978109 0.174486* 26.196 0.159 19.413 0.495
* (**) Significant at the 1% (5%) level; Q(20) is the Ljung-Box statistic for serial correlation in the residuals up to order 20; Q2(20) is the Ljung-Box statistic for serial correlation in the squared residuals up to order 20.
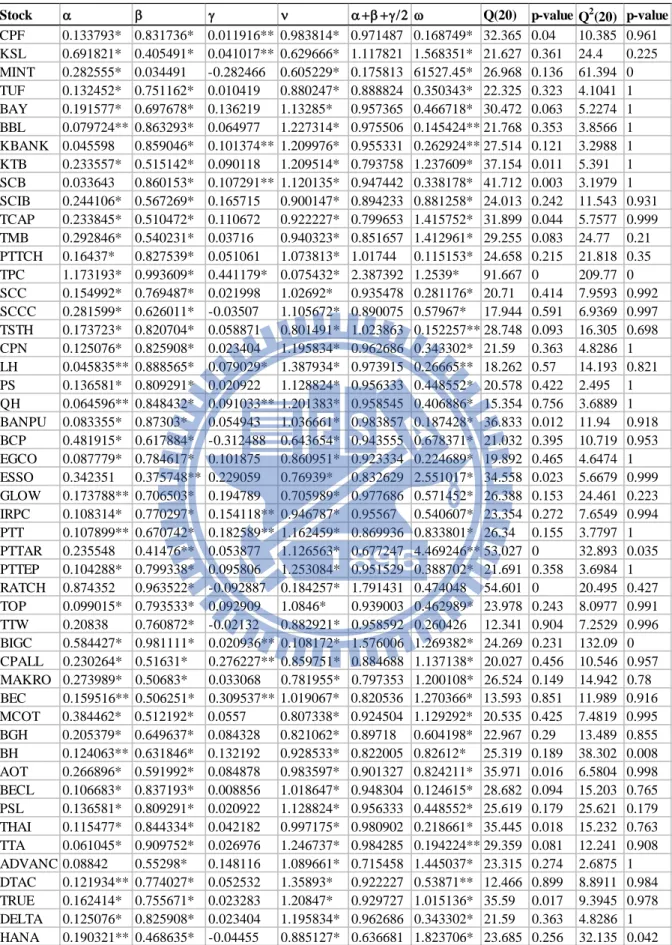
Stock α β γ ν α+β +γ/2 ω Q(20) p-value Q2 (20) p-value CPF 0.133793* 0.831736* 0.011916** 0.983814* 0.971487 0.168749* 32.365 0.04 10.385 0.961 KSL 0.691821* 0.405491* 0.041017** 0.629666* 1.117821 1.568351* 21.627 0.361 24.4 0.225 MINT 0.282555* 0.034491 -0.282466 0.605229* 0.175813 61527.45* 26.968 0.136 61.394 0 TUF 0.132452* 0.751162* 0.010419 0.880247* 0.888824 0.350343* 22.325 0.323 4.1041 1 BAY 0.191577* 0.697678* 0.136219 1.13285* 0.957365 0.466718* 30.472 0.063 5.2274 1 BBL 0.079724** 0.863293* 0.064977 1.227314* 0.975506 0.145424** 21.768 0.353 3.8566 1 KBANK 0.045598 0.859046* 0.101374** 1.209976* 0.955331 0.262924** 27.514 0.121 3.2988 1 KTB 0.233557* 0.515142* 0.090118 1.209514* 0.793758 1.237609* 37.154 0.011 5.391 1 SCB 0.033643 0.860153* 0.107291** 1.120135* 0.947442 0.338178* 41.712 0.003 3.1979 1 SCIB 0.244106* 0.567269* 0.165715 0.900147* 0.894233 0.881258* 24.013 0.242 11.543 0.931 TCAP 0.233845* 0.510472* 0.110672 0.922227* 0.799653 1.415752* 31.899 0.044 5.7577 0.999 TMB 0.292846* 0.540231* 0.03716 0.940323* 0.851657 1.412961* 29.255 0.083 24.77 0.21 PTTCH 0.16437* 0.827539* 0.051061 1.073813* 1.01744 0.115153* 24.658 0.215 21.818 0.35 TPC 1.173193* 0.993609* 0.441179* 0.075432* 2.387392 1.2539* 91.667 0 209.77 0 SCC 0.154992* 0.769487* 0.021998 1.02692* 0.935478 0.281176* 20.71 0.414 7.9593 0.992 SCCC 0.281599* 0.626011* -0.03507 1.105672* 0.890075 0.57967* 17.944 0.591 6.9369 0.997 TSTH 0.173723* 0.820704* 0.058871 0.801491* 1.023863 0.152257** 28.748 0.093 16.305 0.698 CPN 0.125076* 0.825908* 0.023404 1.195834* 0.962686 0.343302* 21.59 0.363 4.8286 1 LH 0.045835** 0.888565* 0.079029* 1.387934* 0.973915 0.26665** 18.262 0.57 14.193 0.821 PS 0.136581* 0.809291* 0.020922 1.128824* 0.956333 0.448552* 20.578 0.422 2.495 1 QH 0.064596** 0.848432* 0.091033** 1.201383* 0.958545 0.406886* 15.354 0.756 3.6889 1 BANPU 0.083355* 0.87303* 0.054943 1.036661* 0.983857 0.187428* 36.833 0.012 11.94 0.918 BCP 0.481915* 0.617884* -0.312488 0.643654* 0.943555 0.678371* 21.032 0.395 10.719 0.953 EGCO 0.087779* 0.784617* 0.101875 0.860951* 0.923334 0.224689* 19.892 0.465 4.6474 1 ESSO 0.342351 0.375748** 0.229059 0.76939* 0.832629 2.551017* 34.558 0.023 5.6679 0.999 GLOW 0.173788** 0.706503* 0.194789 0.705989* 0.977686 0.571452* 26.388 0.153 24.461 0.223 IRPC 0.108314* 0.770297* 0.154118** 0.946787* 0.95567 0.540607* 23.354 0.272 7.6549 0.994 PTT 0.107899** 0.670742* 0.182589** 1.162459* 0.869936 0.833801* 26.34 0.155 3.7797 1 PTTAR 0.235548 0.41476** 0.053877 1.126563* 0.677247 4.469246** 53.027 0 32.893 0.035 PTTEP 0.104288* 0.799338* 0.095806 1.253084* 0.951529 0.388702* 21.691 0.358 3.6984 1 RATCH 0.874352 0.963522* -0.092887 0.184257* 1.791431 0.474048 54.601 0 20.495 0.427 TOP 0.099015* 0.793533* 0.092909 1.0846* 0.939003 0.462989* 23.978 0.243 8.0977 0.991 TTW 0.20838 0.760872* -0.02132 0.882921* 0.958592 0.260426 12.341 0.904 7.2529 0.996 BIGC 0.584427* 0.981111* 0.020936** 0.108172* 1.576006 1.269382* 24.269 0.231 132.09 0 CPALL 0.230264* 0.51631* 0.276227** 0.859751* 0.884688 1.137138* 20.027 0.456 10.546 0.957 MAKRO 0.273989* 0.50683* 0.033068 0.781955* 0.797353 1.200108* 26.524 0.149 14.942 0.78 BEC 0.159516** 0.506251* 0.309537** 1.019067* 0.820536 1.270366* 13.593 0.851 11.989 0.916 MCOT 0.384462* 0.512192* 0.0557 0.807338* 0.924504 1.129292* 20.535 0.425 7.4819 0.995 BGH 0.205379* 0.649637* 0.084328 0.821062* 0.89718 0.604198* 22.967 0.29 13.489 0.855 BH 0.124063** 0.631846* 0.132192 0.928533* 0.822005 0.82612* 25.319 0.189 38.302 0.008 AOT 0.266896* 0.591992* 0.084878 0.983597* 0.901327 0.824211* 35.971 0.016 6.5804 0.998 BECL 0.106683* 0.837193* 0.008856 1.018647* 0.948304 0.124615* 28.682 0.094 15.203 0.765 PSL 0.136581* 0.809291* 0.020922 1.128824* 0.956333 0.448552* 25.619 0.179 25.621 0.179 THAI 0.115477* 0.844334* 0.042182 0.997175* 0.980902 0.218661* 35.445 0.018 15.232 0.763 TTA 0.061045* 0.909752* 0.026976 1.246737* 0.984285 0.194224** 29.359 0.081 12.241 0.908 ADVANC 0.08842 0.55298* 0.148116 1.089661* 0.715458 1.445037* 23.315 0.274 2.6875 1 DTAC 0.121934** 0.774027* 0.052532 1.35893* 0.922227 0.53871** 12.466 0.899 8.8911 0.984 TRUE 0.162414* 0.755671* 0.023283 1.20847* 0.929727 1.015136* 35.59 0.017 9.3945 0.978 DELTA 0.125076* 0.825908* 0.023404 1.195834* 0.962686 0.343302* 21.59 0.363 4.8286 1 HANA 0.190321** 0.468635* -0.04455 0.885127* 0.636681 1.823706* 23.685 0.256 32.135 0.042
* (**) Significant at the 1% (5%) level; Q(20) is the Ljung-Box statistic for serial correlation in the residuals up to order 20; Q2(20) is the Ljung-Box statistic for serial correlation in the squared residuals up to order 20.
Table 9 shows that the estimated coefficients are statistically significant for all stocks except the GARCH estimate for Minor International and the ARCH estimates for Kasikorn Bank , The Siam Commercial Bank, Esso, PTT Aromatics and Refining, Ratchaburi Electricity Generating Holding, Thai Tap Water Supply, and Advanced Info Service, which are not significant at 5% level; also there are 12 stocks that are statistically insignificant at the same level for the leverage effects. From the ν results of the table 9, it confirms us that the innovation distribution is fat-tailed for all stocks and most of the estimated persistence in the conditional variance (α+β+γ/2) is also very close to one similar to the Taiwan’s case.
The Ljung-Box test statistic or Q statistic developed by Box and Pierce can be used to verify the autocorrelation in our model whose null hypothesis is ‘there is no serial correlation in the model residuals (or squared residuals)’. Therefore, we use Q2(20) to check the validity of the volatility equation and Q(20) to check the adequacy of the mean equation. To be consistent, we check all the model or parameter validity at 5% significant level. Accordingly, from the table 8, we can see that there is no serial correlation in the squared residuals up to order 20 for all stocks except Far Eastern Textile, First Financial Holding, Inotera Memories, and Far EastTone Telecommunications; also, we cannot reject the null hypothesis of the mean equation for Nan Ya Plastics, Formosa Chemicals & Fibre, HonHai Precision Industry, Foxconn Technology, Epistar, Wistron, and Far EastTone Telecommunications. The same logic goes for the table 9, thus, there is no serial correlation in the squared residuals up to order 20 for all stocks except for Minor International, Thai Plastic and Chemicals, PTT Aromatics and Refining, Big C, Bumrungrad Hospital, and Hana Microelectronics; also, for the mean equation, the serial correlation exists for CPF, Krung Thai Bank, The Siam Commercial Bank, Thanachart Capital, Thai Plastic and Chemicals, Banpu, Esso, PTT Aromatics and Refining, Ratchaburi Electricity Generating Holding, Airports of Thailand, Thai Airways International, and True Corp.
4. Results
4.1 Cluster Analysis Results
We now translate the TGARCH parameters into the distance term by using the measure we proposed earlier in Section 2. We use the dendrogram to represent the distance matching for stock pairs. Any stock that has similar volatility characteristics (since we use TGARCH parameters as our input to the model) would be closely matched together in the dendrogram. In addition, the distance shown in certain type of dendrogram cannot use to compare to the distance from other measures because the
distance here has no unit and, as we mentioned earlier, different distance measure yield different distance value for the same pair of stock. Consequently, this tells us how the cluster looks like in term of certain distance measure. Determining the number of groups in a cluster analysis is often the primary goal. Although objective methods have been proposed, their application is somewhat arbitrary and debatable. The strength of clustering is indicated by the level of similarity at which elements (stocks) join a cluster.
In our analysis, we first used the TGARCH-based distance defined in equation (8). Figure 1 shows the Mahalnobis-like distance dendrogram for Taiwan 50 stock returns, obtained by the complete linkage method in the Matlab program. The dendrogram exhibits a few chaining characteristics; thus, we will separate it into two clusters, for example (one also can divide it into more clusters, but it might be difficult to find some distinct zone for smaller clusters). One is composed of all financial, most technology corporations (semiconductors: MediaTek, Advanced Semiconductor Engineering, United Microelectronics; computers: Wistron, Compal Electronics, Acer, Lite-On Technology; electronic-related: Foxconn Technology, AU Optronics, HonHai Precision Industry, and Synnex Technology International; and communication & internets: HTC), all industrials, and resources (Formosa Petrochemical). The second is mostly composed of technology corporations (communication & internets: Taiwan Mobile; semiconductors: TSMC, Siliconware Precision Industries; computers: Quanta Computer, Asustek Computer; electronic-related: Delta Electronics), one conglomerate (Pou Chen), and one food corporation (Uni-President). We do not include Epistar, Chunghwa Telecom, President Chain Store, and Far East Tone Telecommunications as a group.
Figure 2 shows the dendrogram for Taiwan 50 stock returns using the Euclidean distance metric. We can divide it into three groups. The first group is composed of some technology corporations (semiconductor; United Microelectronics; and computers: Taiwan Mobile, Acer, Asustek Computer, Quanta Computer, and Lite-On Technology; electronic-related: Delta Electronics, Synnex Technology International), most financial (First Financial Holding, China Development Financial Holding, Mega Financial Holding, Chinatrust Financial Holding, Chang Hwa Bank, Fubon Financial Holding, and Taiwan Cooperative Bank), most industrials (Formosa Chemicals & Fibre, Taiwan Cement, Cheng Shin Rubber Industry, Nan Ya Plastics, Asia Cement, and Formosa Plastics), and resources (Formosa Petrochemical). The second group is mostly composed of technology corporations and the rest of financial. The last group is composed of Chunghwa Telecom and President Chain Store. Please note that Far East Tone Telecommunications and Epistar are not grouped.
Next, we also examine the dendrogram from the combined distance model as shown in Figure 3. We can see the combined method have a lot of stock pairs that do not stay much far from each other. This looks like a single large cluster; it exhibits a large chaining and the distance between each 2 pairs is very short. Hence, we decide to include it as a single large group with one outlier that is Far East Tone Telecommunications.
Now we introduce the SET 50 stock returns dendrogram. We begin with the Mahalanobis-TGARCH model shown in Figure 4. We decide to make it into two clusters for explanation the cluster characteristics. The first cluster includes all financials, all technology corporations, all property and construction firms, some agro and food corporations (Thai Union Frozen Products, and Charoen Pokphand Foods), most resources (PTT, Glow Energy, IRPC, Electricity Generating, Thaioil, Banpu, and PTT Exploration and Production), and most industrial firms (Siam City Cement, Tata Steel, and The Siam Cement). The second cluster is composed of three companies, which are The Bangchak Petroleum, Ratchaburi Electricity Generating Holding, and Big C Supercenter. We do not classify Minor International as well as Thai Plastic and Chemicals as a cluster.
The Euclidean distance metric dendrogram was shown in Figure 5. From this result, we can divide it into three clusters. The first cluster is composed of all financials, all technology corporations, all property and construction firms, all most services (only except for Big C Supercenter), most resources (except for Ratchaburi Electricity Generating Holding and The Bangchak Petroleum), and most industrial firms (only except for Thai Plastic and Chemicals). The second cluster is composed of three firms, which are Khon Kaen Sugar Industry, Minor International (these two are in agro and food industry), and The Bangchak Petroleum (resources). Also, the third cluster is composed of three firms from different industry. These are Thai Plastic and Chemicals (industrials), Ratchaburi Electricity Generating Holding (resources), and Big C Supercenter (services)
From Figure 6, we can divide the results from the combined method into two clusters: one with a large cluster and another with a smaller cluster. The smaller one is composed of Big C Supercenter and Ratchaburi Electricity Generating Holding. The large one is mainly composed of the rests of the stocks except for Thai Plastic and Chemical.
From the results in Figure 1 to 6 and as mentioned above, we can notice that most stocks tend to form a few large clusters for both stock market proxies no matter which measure we use. However, the dispersions of some certain specific industry stocks have a bit different clustering patterns depending on the method one uses.
20 0 1 2 3 4 5 6 7 CST MEGA Synnex CFHC NPC ACC FPC HNFHC LTC CDIBH UMC CHANGHWA BK Fubon FFHC ACER FCFC FPCC TCC Compal CATHAY TFC SKFH SINOPAC Yuanta FENC CSC ASE HON HAI MTK AUO HTC FTC Wistron TCB UNI-P DELTA ASUSTEK PCC SPIL TSMC QCI TWM EPISTAR CHT PCSC FarEastTn
21 0 0.1 0.2 0.3 0.4 0.5 0.6 0.7 0.8 0.9 FPC CDIBH HNFHC FFHC ACC LTC QCI UNI-P MEGA NPC CST Synnex DELTA PCC TCC CFHC ASUSTEK UMC CHANGHWA BK Fubon ACER TCB FCFC TWM FPCC FENC CSC TFC Yuanta SINOPAC HON HAI Compal CATHAY SKFH ASE MTK SPIL FTC HTC TSMC Wistron AUO CHT PCSC EPISTAR FarEastTn uc dea sta ce
22 0 1 2 3 4 5 6 7 8 SKFH SINOPAC TFC Yuanta Compal CATHAY ASE HON HAI Wistron MTK TCC SPIL TSMC FTC FENC CSC ACC LTC FPC HNFHC CDIBH UMC CHANGHWA BK Fubon FFHC NPC CST MEGA Synnex CFHC AUO HTC FCFC TWM UNI-P DELTA ASUSTEK PCC ACER QCI FPCC TCB EPISTAR CHT PCSC FarEastTn
23 0 1 2 3 4 5 CPN DELTA PSL BBL TTA PTTEP TRUE LH CPF BECL BANPU THAI SCC KBANK QH SCB TOP TUF TSTH EGCO IRPC BGH BH GLOW BAY PTT SCIB TCAP ADVANC TMB AOT MCOT MAKRO HANA KTB SCCC CPALL BEC KSL BCP RATCH BIGC MINT TPC
24 0 0.2 0.4 0.6 0.8 1 1.2 CPN DELTA PSL TRUE BBL KBANK QH PTTEP TTA CPF THAI BECL BANPU SCC SCB TOP LH BAY PTT ADVANC KTB SCCC TUF TSTH EGCO IRPC GLOW SCIB TCAP TMB AOT BGH BH MAKRO MCOT HANA CPALL BEC KSL BCP MINT TPC RATCH BIGC
25 0 0.5 1 1.5 2 2.5 3 3.5 4 4.5 5 CPN DELTA PSL BBL KBANK QH TTA TRUE PTTEP CPF BECL THAI BANPU SCC SCB TOP TUF TSTH EGCO IRPC BGH BH LH SCIB TCAP TMB AOT MCOT MAKRO HANA BAY PTT ADVANC CPALL BEC SCCC GLOW KTB KSL BCP MINT RATCH BIGC TPC
-0.8 -0.6 -0.4 -0.2 0 0.2 0.4 0.6 -0.6 -0.5 -0.4 -0.3 -0.2 -0.1 0 0.1 0.2 TCC ACC UNI-P FPC NPC FCFC FENC TFC CSC CST LTC UMC DELTA ASE HON HAI Compal SPIL TSMC Synnex ACER FTC ASUSTEK QCI AUO CHT EPISTAR MTK HTC CHANGHWA BK HNFHC Fubon CATHAY CDIBH Yuanta MEGA SKFHSINOPAC CFHC FFHC PCSC TWM Wistron FarEastTn TCB FPCC PCC
4.2 Multidimensional Scaling Results
After using the principle component analysis (PCA), we have the necessary variables to be used as a major input in our multidimensional scaling model. We use Matlab function and codes to facilitate this step. The result shown in Figure 7 is the multidimensional scaling map for the Taiwan 50 stock returns and Figure 8 shows the result of the SET 50 stock returns. From the Figure 7, we can see that most Taiwan stocks from the index cluster together at north-east of the map. It is obvious that Far EastTone Telecommunications is the outlier of the data and Epistar has less tendency to form cluster with other stocks; this result is consistent with the previous 3 dendrograms in the Figure 1, 2 and 3. As we mentioned earlier, from the map, the cluster areas can be subjectively divided into any or many groups because the data do not have a clear zone of concentration. Then we zoom in on the particular area in Figure 7 to see how the clusters are; this is shown in Figure 8 and Figure 9. Now we can see that many semiconductor stocks tend to cluster together and many financial stocks also tend to do so.
-0.2 -0.15 -0.1 -0.05 0 0.05 0.1 0.15 0.2 0.25 0.3 -0.15 -0.1 -0.05 0 0.05 0.1 0.15 TCC ACC UNI-P FPC NPC FCFC FENC TFC CSC CST LTC UMC DELTA ASE HON HAI Compal SPIL TSMC Synnex ACER FTC ASUSTEK QCI MTK HTC CHANGHWA BK HNFHC Fubon CATHAY CDIBH Yuanta MEGA SKFH SINOPAC CFHC FFHC TWM Wistron TCB PCC -0.2 -0.15 -0.1 -0.05 0 0.05 0.1 0.15 0.2 0.25 0.3 -0.15 -0.1 -0.05 0 0.05 0.1 0.15 Cement Cement Food Plastics Plastics Plastics Textiles Chemical
Iron and Steel Rubber Computer &PE Semiconductor Electronic Parts Semiconductor Other Electronic Computer &PE Semiconductor Semiconductor Electro Products Computer &PE Other Electronic Computer &PE Computer &PE Semiconductor
Commun & Net Finan & Insur
Finan & Insur
Finan & Insur
Finan & Insur Finan & Insur
Finan & Insur Finan & Insur
Finan & Insur Finan & Insur Finan & Insur
Finan & Insur
Commun & Net
Computer &PE Finan & Insur
Other
Figure 8: Zoom in on 2-D MDS map of Taiwan 50 stock returns for the x range of -0.2 to 0.3.
-0.6 -0.4 -0.2 0 0.2 0.4 0.6 0.8 1 1.2 1.4 -0.6 -0.4 -0.2 0 0.2 0.4 0.6 0.8 CPF KSL MINT TUF BAY BBL KBANK KTB SCB SCIB TCAP TMB TPC SCC SCCC TSTH CPN LH QH BANPU BCP EGCO GLOW IRPC PTT PTTEP RATCH TOP BIGC CPALL MAKRO BEC MCOT BGH BH AOT BECL PSL THAI TTA ADVANC TRUE DELTA HANA
Figure 10 is the map for SET 50 stock returns; it is obvious that there are some stocks that do not cluster to other stocks. These stocks are Thai Plastic and Chemicals, Big C Supercenter, and Ratchaburi Electricity Generating Holding; thus, it is consistent to all previous three dendrograms of the SET 50 stock returns as well. As we can see, due to vague area existence, the cluster areas of the map can also be subjectively divisible like the results of the three dendrograms above. We further zoom in on the map to see more detailed cluster as shown in Figure 11 and Figure 12. We can see from the Figure 11 and Figure 12 that most financial and most service industry stocks tend to exhibit clustering; the same result also goes for most resource and most technology industry stocks
Thus, we find that financial stocks and technology stocks tends to exhibit clustering for both stock markets and the multidimensional scaling map supports the results from the dendrograms for both Taiwan 50 stocks and SET 50 stocks.
-0.4 -0.2 0 0.2 0.4 0.6 -0.2 0 0.2 0.4 0.6 0.8
Agro & Food
Agro & Food Agro & Food
Agro & Food Finance Finance Finance Finance Finance Finance Finance Finance Industrials Industrials Industrials Prop & Consturct
Prop & Consturct
Prop & Consturct
Resources Resources Resources Resources Resources Resources Resources Resources Services Services Services Services Services Services Services Services Services Services Services Technology Technology Technology Technology -0.4 -0.2 0 0.2 0.4 0.6 -0.2 0 0.2 0.4 0.6 0.8 CPF KSL MINT TUF BAY BBL KBANK KTB SCB SCIB TCAP TMB SCC SCCC TSTH CPN LH QH BANPU BCP EGCO GLOW IRPC PTT PTTEP TOP CPALL MAKRO BEC MCOT BGH BH AOT BECL PSL THAI TTA ADVANC TRUE DELTA HANA
Figure 11: Zoom in on 2-D MDS map of SET 50 stock returns.
5. Cluster Tree Verification
Due to the existence of many available distance measures, we apply the cophenetic correlation coefficient to check the robustness of the dendrograms. It measures the dissimilarity levels of the dendrogram. The closer the value of the cophenetic correlation coefficient is to 1, the more accurately the clustering solution reflects in the data. We use the cophenetic correlation coefficient to compare the results of clustering the same data set using different distance calculation methods and then evaluate the clusters created for the sample data set. The results are as follow:
Table 10: Cophenetic correlation coefficient.
Metric Taiwan 50 SET 50
Mahalanobis distance 0.912 0.9174
Euclidean distance 0.8815 0.9302
Combined distance 0.9015 0.9229
As we can see from table 10 above, the three methods give the cophenetic correlation coefficient in the vicinity of 0.9. As for SET 50 stock returns, the Euclidean distance provides the highest cophenetic correlation value that is close to 1. This means for SET 50 stocks, the Euclidean method give better picture of the cluster as a whole. In contrast, for Taiwan 50 stock returns, the Mahalanobis distance has the highest cophenetic correlation value; this implies that Mahalanobis distance is the best clustering method for Taiwan 50. However, it is worth to note that the combined metric has the value in between the two metric for both index stock returns.
6. Conclusion
This study apply the extended GARCH model or TGARCH (1,1) with the GED innovation assumption to estimate the parameters need to be used as input to the cluster analysis models. We select TGARCH model because it takes into consideration of volatility asymmetry, which is common in the stock market as evidence by several empirical researches, and some other stylized facts reflect in the model. For Taiwan 50 stocks and SET 50 stock returns, we have some points to note. First, the conditional volatility persistence exists for both markets. Second, most stocks in the SET 50 index are highly leptokurtic with a bit negative skewed in return distribution, which supports our use of TGARCH model, while this is not obvious for those of Taiwan. Third, all stocks in the SET 50 exhibit non-normal distribution as indicate by the Jarque-Bera test statistics and this is also true for most of stocks in the Taiwan 50. Fourth, the leverage effects (γ) are statistically significant for some of the stocks in the two indices (12 stocks of each index exhibit this).