Large aperture and polarizer-free liquid crystal lenses for ophthalmic
applications
Yi-Hsin Lin, Hung-Shan Chen, Chia-Ming Chang , and Yu-Jen Wang
Department of Photonics, National Chiao Tung University, 1001 Ta Hsueh Rd., Hsinchu 30010,
Taiwan
*
Corresponding author: [email protected]
ABSTRACT
Large aperture and polarizer-free liquid crystal lenses (LC lenses) based on a double-layered structure for ophthalmic applications are demonstrated. The polarizer-free LC lens functions as both of a positive lens and a negative lens with large aperture size of 10mm. The lens power is electrically and continuously tunable ranging from -1.32 Diopter to 1.83 Diopter. To demonstrate the polarization independency, the wavefronts of the LC lenses under different polarized light were measured and discussed. The detail operations of the applied voltage and frequency are also discussed. The imaging performance of the LC lens is also evaluated. This study provide a detail understanding of the polarizer-free LC lenses based on a double-layered structure.
Keywords: Liquid Crystal Lens, Ophthalmic lens, Polarizer-free, large aperture, phase modulation
1. INTRODUCTION
Liquid crystal(LC) lenses electrically modulate phases of the incident light and distort the incident wavefront. Many applications of LC lenses are developed, such as solar concentrators and optical trapping systems, pico projection, endoscopes, camera modules, and ophthalmic applications.[1-12] The main challenges of the LC lenses are: polarizer-free, large aperture size, large tunable lens power, and good imaging quality. In 2013, we demonstrated a polarizer-free LC lens based on double-layered structure to enlarge both of the phase and the aperture.[13] The proposed polarizer-free lens provides a continuously tunable lens power ranging from positive to negative lens powers.The optical mechanism to apply a LC lens to a human eye system for presbyopia and myopia is also introduced. However, the driving voltages are too high (up to 160Vrms) and the aperture size are still limit ~6mm. In addition, the phase distribution
of the double-layered type LC lens has not been reported yet. In this paper, we demonstrate the polarizer-free LC lens based on double-layered structure with an aperture size of 10mm and the operating voltage of 50Vrms. The wavefronts of
applied voltage and frequency are also discussed. The imaging performance is also evaluated. The polarizer-free LC lens can not only be applied to ophthalmic lenses but also imaging systems, projection systems, and endoscopes.
2. STRUCTURE AND OPERATING PRINCIPLES
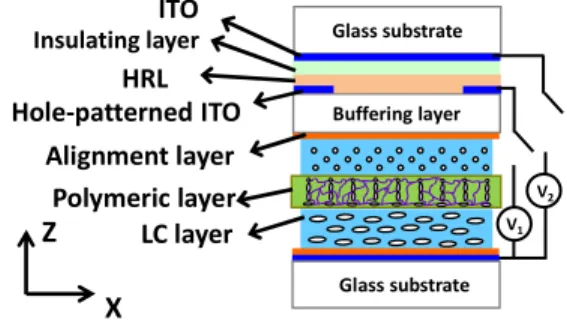
ITO Hole-patterned ITO LC layer Alignment layer HRL X Z Glass substrate Buffering layer Insulating layer Glass substrate V1 V2 Polymeric layer
Fig. 1 The structure of the polarizer-free double layered LC lens.
The structure of the polarizer-free double layered LC lens is depicted in Fig. 1. The structure of the LC lens consists of an insulating layer of polymer NOA81 (Norland), a high resistive layer (HRL), three glass substrates coated with Indium Tin Oxide (ITO) layers as electrodes,alignment layers of polyimide (PI), two LC layers and a polymeric layer as a separator to separate two LC layers.The thicknesses of the insulating layer, LC layers, and polymeric layers are 35 µm, 50 µm, and 50 µm, respectively.The material of the LC layer is LCM1790 (∆n=0.42 @ 589nm, from LC MATTER CORP.). The material of the HRL is Zinc Oxide (ZnO) with a sheet resistance larger than 10M/sq. The polymeric layer is also optically isotropic or polarization independent for the normally incident light. The transmittance of the polymeric layer is comparable to the transmittance of glass substrate (>97% for red light and neglecting the reflections). When the applied voltages V1=V2=0, the LC directors are all aligned parallel to the glass substrates, as
shown in Fig. 1. As a result, the spatial distributions of refractive indices of the LC layers are uniform and the LC lens has no lensing effect. When V2> V1,the LC directors around the rim of the aperture are more parallel to the glass
substrates and the LC directors in the center of the aperture are more perpendicular to the glass substrates.The LC lens is a negative lens because of the gradient refractive index distribution of the LC directors. Similarly, the LC lens is a positive lens when V2< V1. By changing the magnitude of the voltages of V1 and V2, the lens power of the LC lens is
electrically switchable.Besides, the function of HRL is to assist the electric fielddistributing all over the aperture and thus to lower the driving voltage.[14-15] The potential distribution (U)across the aperture of a simple hole-patterned structurecan be expressed as: 2 2 ( )
s LC LC
U R G i w C U
∇ = × × − × × × , where Rs is the sheet resistance of the resistive
layer, w is the angular frequency of the signal, CLC is the surface capacitance of the LC layer, GLC is the surface
conductance of the LC layer, and i is the imaginary unit. Considering the frequency dependent impedance of the LC layer ZLC (i.e.,ZLC =1 (GLC− × ×i w CLC)) and the capacitance of the LC, the potential distribution (U) changed at
different frequencies of the electric field.[4,16] As a result, the voltages V1, V2, and frequency affect the distribution of
the phase profile. Therefore, we are able to find the appropriate applied voltages and frequency to obtain maximum tunable lens power which is demonstrated and discussed more in next section.
3. EXPERIMENT AND RESULTS
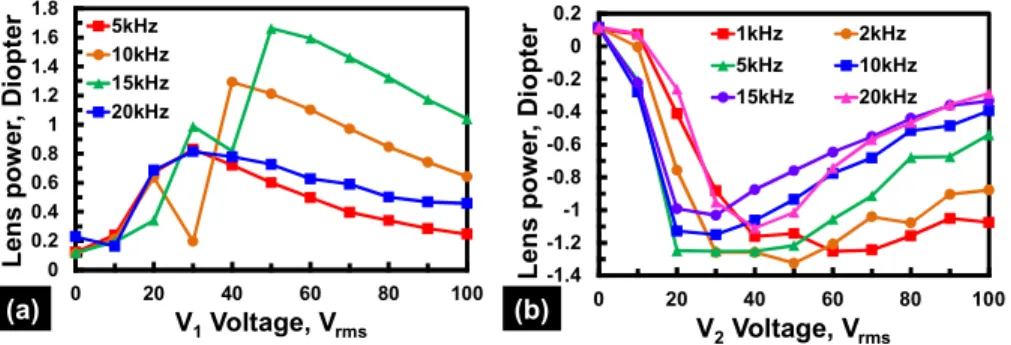
To measure the lens power, a Shack-Hartmann wavefront sensor (Thorlab, WFS-150-7AR) was used to measure the optical phase difference (OPD) of the wavefront after light passed through the LC lens. An unpolarized He-Ne laser (λ = 633 nm) was coupled into a fiber and then the light out of the fiber was incident to a lens to generate a collimated light. The collimated light was impinged on the LC lens, relay lenses for adjustment of the beam size, and the wavefront sensor, accordingly. The spatial OPDs were recorded by the wavefront sensor. The lens power of the LC lens was calculated by the standard software provided by Thorlab version 3.5. To measure the polarization dependency, the polarizer was placed near the LC lens and was rotated to change the polarization state of the incident light. To obtain the maximum positive lens power, the measured lens power as a function of V1 at different frequencies (f) at V2=0 was shown in Fig.
2(a). In Fig. 2(a) at f=15kHz, the lens power increases with V1 and then decreases after reaching the maximum lens
power. As we can see from Fig. 2(a), the maximum lens power is 1.66D at the applied voltage pair of (V1, V2)=(50Vrms,
0Vrms) at f=15kHz. Local minimums of the lens powers at the applied voltage pair of (V1, V2)=(40Vrms, 0Vrms) at
f=15kHz and (30Vrms, 0Vrms) at f=10kHz was also observed in Fig. 2(a) which is because of poor phase distribution
resulting the error of the wavefront measurement. Similarly, we can obtain the maximum negative lens power by measuring the lens power as a function of V2 at different frequencies (f) at V1=0, as shown in Fig. 2(b). In Fig. 2(b), the
optimal condition for minimum negative lens power of -1.32 D can be obtained at the applied voltage pair of (V1,
V2)=( 0Vrms, 50Vrms) at f= 2 kHz. From Figs. 2(a) and 2(b), maximum and minimum lens power of the LC lens (i.e.
1.66D and -1.32D) can be obtained by fine adjustment of the frequencies, V1, and V2.
0 0.2 0.4 0.6 0.8 1 1.2 1.4 1.6 1.8 0 20 40 60 80 100 Le ns po w er , Di opt er V1Voltage, Vrms 5kHz 10kHz 15kHz 20kHz (a) -1.4 -1.2 -1 -0.8 -0.6 -0.4 -0.2 0 0.2 0 20 40 60 80 100 Le ns p o w er , D iop te r V2Voltage, Vrms 1kHz 2kHz 5kHz 10kHz 15kHz 20kHz (b)
Fig. 2 (a)The lens power as a function of V1 at different frequencies. V2= 0 Vrms. (b) The lens power as a function of V2 at
different frequencies. V1= 0 Vrms.
positive lens power, and V2 (i.e., 50Vrms) at the corresponding frequency (i.e., 2 kHz) for minimum negative lens power.
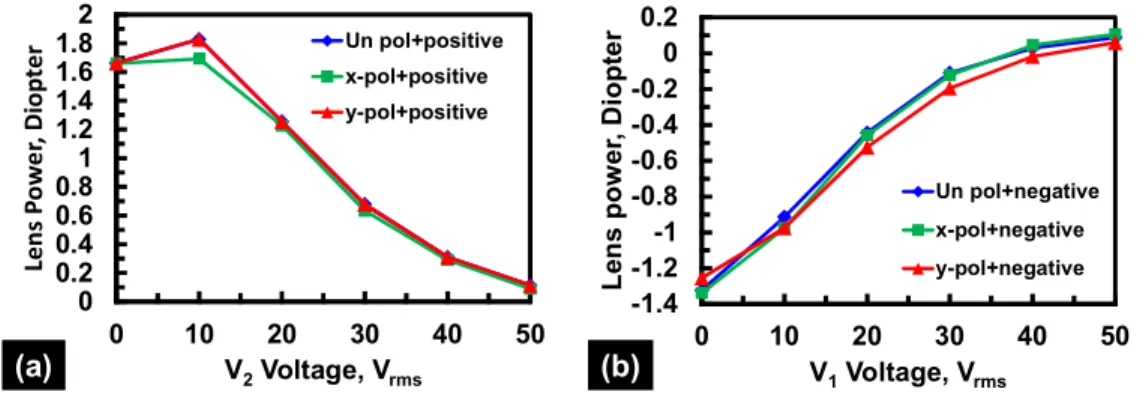
We further test the polarization dependency and continuously tunable lens power. The measured lens power as a function of V2 at V1=50Vrms at f= 15 kHz under different polarization states is shown in Fig. 3(a). The lens power under different
polarization conditions are matched quite well. This indicates the LC lens is polarization independent when the LC lens is operated as a positive lens at different V2 at V1=50 Vrms and at f= 15 kHz. As one can see, the maximum lens power in
Fig. 3(a) is 1.88D at (V1, V2)=( 50 Vrms, 10 Vrms) at f= 15 kHz. This is because proper V2 at fixed V1=50 Vrms helps to
obtain more parabolic phase profile and then improve the average lens power slightly.The lens power can be switched between 1.83D to 0.11D for unpolarized light in Fig. 3(a). Fig. 3(b) shows the lens power as a function of V1 at V2 =
50Vrms at f= 2 kHz under different polarization states of incident light. The negative lens power in Fig. 3(b) is also
polarization independent and continuously tunable from 0.09D to -1.32D. Therefore, the double-layered LC lens which can be operated as a positive lens and a negative lens is not only electrically tunable, but also polarization independent.
0 0.2 0.4 0.6 0.81 1.2 1.4 1.6 1.82 0 10 20 30 40 50 Len s P o w e r, Di op ter V2Voltage, Vrms Un pol+positive x-pol+positive y-pol+positive (a) -1.4 -1.2 -1 -0.8 -0.6 -0.4 -0.2 0 0.2 0 10 20 30 40 50 L en s pow er , D iopter V1Voltage, Vrms Un pol+negative x-pol+negative y-pol+negative (b)
Fig. 3 The lens power of the LC lens as a function of an applied voltage under an unpolarized light (diamonds), x-linearly polarized light (triangles), and y-linearly polarized light (rectangles) under (a) positive lens operation and (b) negative lens operation.
“Positive” represents the positive lens power by changing V2 at V1= 50 Vrms at frequency =15 kHz. “Negative” represents the negative
lens power by changing V1 at V2= 50 Vrms at frequency =2 kHz.
The lens power is also related to the frequency because of the frequency-dependent impedance of the LC layer and the HRL which affect the effective voltage applied to the LC layer.To demonstrate the frequency-dependent impedance of the LC layer, an LCR meter (Agilent 4284A, Hewlett Packard) was used to measure the impedance of the LC material (LCM-1790). We adopted a standard test cell with cell gap of 15µm. The measured frequency-dependent impedance of the test cell under different applied voltage is shown in Fig. 4. In Fig. 4, the impedance of the test cell decreases with an increase of frequency and also with an increase of applied voltage. As a result, the spatial voltage distribution of the LC layer resulting in spatial phase distribution is able to be manipulated by adjustment of frequency and voltage.
0 0.1 0.2 0.3 0.4 0.5 0.6 0.7 0.8 0.9 1 0 2 4 6 8 10 12 14 16 18 20 Im ped ance o f LC l ayer , MOhm Frequency, kHz 0.5V 1V 1.5V 2V 5V 8V
Fig. 4 The impedance |Z| of LC materials (LCM1790) as a function of frequency under different applied voltages. The cell gap of the test cell is 15 µm.
From Fig, 4, the spatial phase distribution of the proposed LC lens should depend on the frequency. We then measured the positive lens power and negative lens power as a function of frequency of the proposed LC lens, as shown in Figs. 5(a) and 5(b). From the maximal and minimal lens powers (i.e., 1.83D and -1.32D) we obtained in 3(a), and 3(b), (V1, V2) of the positive LC lens is chosen as (50Vrms, 10Vrms) and (V1, V2) of the negative lens is chosen as (V1,
V2)=(0Vrms, 50Vrms). In Fig. 5(a), the positive lens power basically increases with frequency, but with a local minimum at
f=12 kHz. This is because the impedance of the LC layers is higher at lower frequency and then the effective voltage at
the LC layer is higher. Higher effective voltage of LC layers, larger reorientations of the LC directors. As a result, higher frequency, larger spatial phase distribution and then bigger LC lens power. As to the local minimum of the lens power at
f=12 kHz,we observed that the LC directors in the center of the LC lens started to reorient as f>12 kHz at a fixed voltage of (V1, V2) =(50Vrms, 10Vrms) and did not reorient as f<12 kHz. Thus, we observed local minimum of the lens power at
f>12 kHz. Similarly, we also measured the negative lens power at (V1, V2) of (0Vrms, 50Vrms) as a function of frequency,
as shown in Fig. 5(b). For the unpolarized light, the lens power first decreases with frequency, reaches local minimum at frequency of 2 kHz, and then the lens power increases with frequency again. We also test the frequency response at different polarization states. In Figs. 5(a) and 5(b), the tunable lens power at different frequency is nearly polarization independent.
0 0.2 0.4 0.6 0.81 1.2 1.4 1.6 1.82 2.2 2.4 0 5 10 15 20 L ens Pow er , Di op te r Frequency, kHz Un pol+positive x-pol+positive y-pol+positive (a) -1.4 -1.2 -1 -0.8 -0.6 -0.4 -0.2 0 0 4 8 12 16 20 L e ns po w e r, D iop te r Frequency, kHz Un pol+negative x-pol+negative y-pol+negative (b)
Fig. 5 The lens power of the LC lens as a function of frequency under an unpolarized light (diamonds), x-linearly polarized light (rectangles), and y-linearly polarized light (triangles). (a) is the positive lens and (b) is the negative lens. “Positive” represents the
positive lens power by changing frequencies with voltages (V1, V2) of (50Vrms, 10Vrms). “Negative” represents the positive lens power
by changing frequencies with voltages (V1, V2) of (0Vrms, 50Vrms).
To investigate the phase distribution of the LC lens under different polarization states, OPDs of reconstructed wavefronts of the LC lens are analyzed on a basis of the Zernike coefficients.[4,17] The spatially distributed OPDs of reconstructed wavefronts under different polarization states are shown in Figs. 6(a)-6(i) as the LC lens is at voltage-off state, a positive lens, and a negative lens. Figures 6(a), 6(b), and 6(c) indicate that the LC lens under an unpolarized light at (V1, V2)=(0Vrms, 0 Vrms), (0 Vrms, 50 Vrms), and
(0 Vrms, 50 Vrms), respectively. The operating frequency for the positive lens is 15 kHz, while for the negative lens is 2 kHz. Figure
6(a) shows slightly non-uniform phase difference across the aperture with a low spatial variation (<5 µm). Figure 6(b) shows a negative OPD with total phase difference of ~ 20µm and Fig. 6(c) shows a positive OPD with total phase difference of ~ 20µm. Figures 6(a), 6(b), and 6(c) also indicate that the LC lens shows no lensing effect, a negative lens, and a positive lens, respectively. To compare the polarization dependence of the wavefront, Figs. 6(d)-6(f) show the wavefronts under x-linearly polarized light and Figs. 6(g)-6(i) show the wavefronts under y-linearly polarized light. Similar to the cases under unpolarized light, OPD in Fig. 6(d) has low OPD variation. Figures 5(e) and 5(h) show wavefronts of negative lenses, and Figs. 6(f) and 6(i) show wavefronts of positive lenses. From Fig. 6(c), Fig. 6(f) and Fig. 6(i), the wavefronts are similar, which means the OPD of the positive lens is polarization independent as a viewpoint of spatial OPD. On the contrary, the discrepancy of the negative lens in Figs. 6(b), 6(e), and 6(h) means anisotropic focusing properties of the LC lens at different polarization states, which could affect image quality. In addition, the OPDs of the LC lens in Fig. 5 are asymmetric because of three main reasons: the thickness variations of the LC layers, the thickness variations of polymeric layers, and non-uniform resistivity of high resistive layer.
pupil coordinate, mm Á Ñ O N A O) , o 01 0
pupil coordinate, mm Á Ñ o N A o
ili=1
N N 0 N 0 pupil coordinate, mm Á Ñ O N A O
==!=
, (T N 0 N 0 pupil coordinate, mm Á Ñ o N A a,==iM
N 0 N Ó pupil coordinate, mm Á Ñ o N A G1 O N O pupil coordinate, mm Ñ O N A W==l
N N O N O pupil coordinate, mm Á Ñ O N A N0
O 01 0NCTU
(a) (b) (c) (d) (e) (f) (g) (h) (i)Fig. 6 (a), (b), (c) are the reconstructed wavefronts of the LC lens under an unpolarized light at (V1, V2)=(0, 0), (0, 50), and (50, 10),
respectively. (b) is a negative lens and (c) is a positive lens. (d), (e), (f) are the corresponding wavefronts in (a), (b), (c) under x-linearly polarized light. (g), (h),(i) are the corresponding wavefronts in (a), (b), (c) under y-linearly polarized light. The frequency was 15 kHz for the
positive lens and 2 kHz for the negative lens. Color bar indicates the OPD in a unit of micron.
To test the imaging performance of the polarizer-free LC lens, the image performance was shown in Fig. 7. The image performance was taken by a camera (Canon 500D) with a attached LC lens attached. Figures 7(a) and 7(b) are the experiment results at voltage off and voltage on states, respectively. The image quality is clear as (V1, V2, f) = (50Vrms, 40Vrms, 5 kHz). The image is blurred without the applied voltage.
(a)
(b)
4. CONCLUSION
We demonstrated a large aperture and polarizer-free LC lens for ophthalmic applications. The tunable lens power can be electrically controlled from -1.32D to 1.83D with the operating voltage of 50Vrms. The operation mechanism and
the simple driving methods of the polarizer-free lens are introduced. To demonstrate the polarization independency, the phase distribution and OPDs of the LC lenses under different incident polarized light were analyzed. The detail discussion on the operation of the voltage and frequency driving method are demonstrated. We believe the polarizer free LC lens paves a broad way for ophthalmic lens and other adaptive optics applications.
This research was supported partially by Department of Natural Sciences and Sustainable Development in Ministry of Science and Technology (MOST) in Taiwan under the contract no. NSC 101-2112-M-009-011-MY3 and partially by Liqxtal Technology Inc.
REFERENCE
[1] Y. S. Tsou, Y. H. Lin, and A. C. Wei, “Concentrating Photovoltaic System Using a Liquid Crystal Lens,” IEEE Photonics Technol. Lett. 24, 2239-2242 (2012).
[2] M. Kawamura, M. Ye, and S. Sato, “Optical Trapping and Manipulation System Using Liquid-Crystal Lens with Focusing and Deflection Properties,” Jpn. J. Appl. Phys. 44, 6098 (2005).
[3] H. S. Chen, and Y. H. Lin, “An endoscopic system adopting a liquid crystal lens with an electrically tunable depth-of-field,” Opt. Express 21, 18079 (2013).
[4] H. S. Chen, Y. J. Wang, , C. M. Chang, and Y. H. Lin “A polarizer-free liquid crystal lens with a large aperture size exploiting an embedded-multilayered structure,” Opt. Express (2014, accepted).
[5] H. C. Lin, and Y. H. Lin, “A fast response and large electrically tunable-focusing imaging system based on switching of two modes of a liquid crystal lens,” Appl. Phys. Lett. 97, 063505 (2010).
[6] H. C. Lin and Y. H. Lin, “An electrically tunable focusing pico-projector adopting a liquid crystal lens,” Jpn. J. Appl. Phys. 49, 102502 (2010).
[7] Y. H. Lin, M. S. Chen, and C. H. Lin, “An electrically tunable optical zoom system using two composite liquid crystal lenses with a large zoom ratio,” Opt. Express 19, 4717-4721 (2011).
[8] H. C. Lin, N. Collings, M. S. Chen, and Y. H. Lin, “A holographic projection system with an electrically tuning and continuously adjustable optical zoom,” Opt. Express 20, 27222-27229 (2013).
[9] B. Wang, M. Ye, and S. Sato, “Liquid crystal lens with focal length variable from negative to positive values,” IEEE Photonics Technol. Lett. 18, 79-81 (2006).
[10] H. C. Lin, M. S. Chen, and Y. H. Lin, “A review of electrically tunable focusing liquid crystal lenses,” Trans. Electr. Electron Mater. 12, 234-240 (2011).
[11] Y. H. Lin, H. S. Chen, H. C. Lin, Y. S. Tsou, H. K. Hsu, and W. Y. Li, “ Polarizer-free and fast response microlens arrays using polymer-stabilized blue phase liquid crystals,” Appl. Phys. Lett. 96, 113505 (2010).
[12] H. C. Lin, and Y. H. Lin “An electrically tunable focusing liquid crystal lens with built-in planar polymeric lens,” Appl. Phys. Lett. 98, 083503 (2011).
[13] Y. H. Lin, and H. S. Chen, “Electrically tunable-focusing and polarizer-free liquid crystal lenses for ophthalmic applications,” Opt. Express 21, 9428-9436 (2013).
[14] A. F. Naumov, G. D. Love, M. Y. Loktev, and F. L. Vladimirov, “Control optimization of spherical modal liquid crystal lenses,” Opt Express 4, 344-352 (1999 ).
[15] N. Fraval, F. Berier, and O. Castany, “Novel resistive electrode structure for liquid crystal modal lens shifting,” Proc. SPIE 8252, 82520Q (2012).
[16] M. Ye, B. Wang, M. Uchida, S. Yanase, S. Takahashi, M. Yamaguchi, and S. Sato, “Low-voltage-driving liquid crystal lens,” Jpn. J. Appl. Phys. 49, 100204 (2010).
[17] H. Gross, H. Zugge, M. Peschka, and F. Blechinger, Handbook of Optical Systems: Aberration Theory and