Biodegradable Poly(
-caprolactone)/Poly(
L
-lactide) Blends
Shiao-Wei Kuo, Chih-Feng Huang, Yi-Chih Tung, Feng-Chih ChangInstitute of Applied Chemistry, National Chiao Tung University, Hsin Chu, Taiwan, Republic of China
Received 14 August 2004; accepted 3 August 2005 DOI 10.1002/app.23227
Published online in Wiley InterScience (www.interscience.wiley.com).
ABSTRACT: We have investigated the enhancement in miscibility, upon addition of bisphenol A (BPA) of immisci-ble binary biodegradaimmisci-ble immisci-blends of poly(-caprolactone) (PCL) and poly(l-lactide) (PLLA). That BPA is miscible with both PCL and PLLA was proven by the single value of Tg
observed by differential scanning calorimetry (DSC) analy-ses over the entire range of compositions. At various com-positions and temperatures, Fourier transform infrared spectroscopy confirmed that intermolecular hydrogen bond-ing existed between the hydroxyl group of BPA and the carbonyl groups of PCL and PLLA. The addition of BPA enhances the miscibility of the immiscible PCL/PLLA bi-nary blend and transforms it into a miscible blend at room
temperature when a sufficient quantity of the BPA is present. In addition, optical microscopy (OM) measure-ments of the phase morphologies of ternary BPA/PCL/ PLLA blends at different temperatures indicated an upper critical solution temperature (UCST) phase diagram, since the⌬K effect became smaller at higher temperature (200°C) than at room temperature. An analysis of infrared spectra recorded at different temperatures correlated well with the OM analyses.© 2006 Wiley Periodicals, Inc. J Appl Polym Sci 100: 1146 –1161, 2006
Key words:ternary polymer blend; hydrogen bonding; mis-cibility
INTRODUCTION
During last few years, blends of biocompatible and biodegradable polymers have become attractive in polymer science because of strong economic rewards resulting from their biomedical applications.1 Poly(l-lactide) (PLLA) has been studied intensively and used widely in these applications because of its high bio-compatibility and good biodegradability.2,3 Nonethe-less, one major disadvantage of PLLA is the transition from ductile to brittle failure under tension as a result of its high melting temperature. In contrast, poly(-caprolactone) (PCL) possesses low glass transition and melting temperatures and has been added to PLLA in the role of a plasticizer to render it more flexible and to reduce its brittleness.4,5 Therefore, it is reasonable to expect that blending PLLA with PCL may bring about either improved flexibility or increased strength, in comparison with the properties of each individual component. However, the phase separation in the amorphous phase has been widely observed in PLLA/
PCL blend system.6 –9To enhance the compatibility of this immiscible binary PLLA/PCL blend, the mostly widely adopted strategy has been through the addi-tion of a block copolymer, such as PLLA-b-PCL-b-PLLA,10,11 PLLA-b-PCL,12,13 or poly(
-caprolactone)-b-poly(ethylene glycol) (PCL-b-PEG).14 This concept arose from the early findings of Scott15and Tompa16
that, if polymer B is miscible with both polymers A and C, then, it can compatibilize the immiscible binary pair of A and C. In addition to the block copolymer approach, another example of compatibilization of im-miscible binary blends is through specific interactions, such as those exhibited in ternary polymer blends of poly(vinylphenol) (PVPh)/poly(methyl methacrylate) (PMMA)/poly(ethyl methacrylate) (PEMA),17 and
poly(vinylidene fluoride) (PVDF)/PMMA/PEMA.18
Taking into account the chemical structures of PCL and PLLA, the carbonyl groups of both PCL and PLLA are able to form intermolecular hydrogen bonds with several amorphous hydrogen-bonded donor polymers such as PVPh, phenolic, and phenoxy res-ins.19 –23 However, only partial miscibility has been observed in the PVPh/PLLA binary blend because the strength of interassociation hydrogen bonding is rela-tively weaker than that of the self-association hydro-gen bonding of PVPh.23 In addition to the use of a high-molecular-weight polymer, compatibilization of an immiscible binary polymer blend also can be achieved by blending a suitable low-molecular-weight Correspondence to: F.-C. Chang ([email protected].
edu.tw).
Contract grant sponsor: National Science Council, Taiwan, Republic of China; contract grant numbers: NSC-92–2216-E-009 – 018, NSC-92–2811-E-NSC-92–2216-E-009 – 011.
Journal of Applied Polymer Science, Vol. 100, 1146–1161 (2006) © 2006 Wiley Periodicals, Inc.
(LMW) compound because of their significantly greater entropy changes relative to high-molecular-weight polymer.24 Recently, He et al. reported that
several bifunctional LMW compounds are miscible with PCL because of the existence of hydrogen bonds between the hydroxyl groups of dihydric phenols and the carbonyl groups of PCL. In their studies,25–31 the
authors also proposed that these dihydric phenols can act as compatibilizers to improve the miscibility be-tween two hydrogen-bonding accepting polymers. As a result, LMW compound/polymer/polymer ternary blends have received considerable attention re-cently.32–38
In this study, we report that bisphenol A, a bifunc-tional, hydrogen-bond donor compound, interacts with both PCL and PLLA, which are both hydrogen-bond accepting polymers, and acts as a compatibilizer to improve their miscibility. The purpose of this work was to study the miscibility, phase morphology, and hydrogen bonding behaviors of this BPA/PCL/PLLA ternary blend system. The effect that hydrogen bond-ing has on the miscibility and morphology of the system was investigated using DSC, FTIR, and optical microscopy (OM).
EXPERIMENTAL Materials and blend preparation
Bisphenol A, which has a molecular weight of 228 g/mol, was supplied by the Showa Chemical Com-pany, Japan. Poly(caprolactone) (PCL) having Mw
⫽ 80,000 g/mol and poly(l-lactide) (PLLA) having Mw
⫽ 85,000–150,000 g/mol were purchased from Al-drich Chemical Company, USA. These polymers were
used as received without further purification. The ter-nary blends of BPA/PCL/PLLA having various com-positions were prepared by solution blending. A tet-rahydrofuran (THF) solution containing 5 wt % of these three components was stirred for 6 – 8 h before the solution was evaporated slowly at 50°C over 1 day. The film of the blend was then dried at 100°C for 2 days to ensure total elimination of the solvent. Characterizations
The thermal properties of the blends were character-ized using a TA Instruments 2920 differential scanning
TABLE I
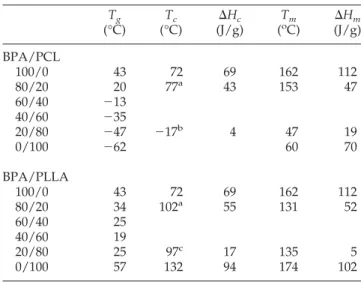
Thermal Properties of BPA/PCL and BPA/PLLA Binary Polymer Blends Tg (°C) Tc (°C) (J/g)⌬Hc Tm (oC) (J/g)⌬Hm BPA/PCL 100/0 43 72 69 162 112 80/20 20 77a 43 153 47 60/40 ⫺13 40/60 ⫺35 20/80 ⫺47 ⫺17b 4 47 19 0/100 ⫺62 60 70 BPA/PLLA 100/0 43 72 69 162 112 80/20 34 102a 55 131 52 60/40 25 40/60 19 20/80 25 97c 17 135 5 0/100 57 132 94 174 102 a
From the BPA phase.
b
From the PCL phase.
c
From the PLLA phase.
calorimeter equipped with a mechanical cooling ac-cessory. Each sample was heated to 200°C, maintained at that temperature for 5 min, and then quickly quenched to –100°C. The glass transition and melting temperatures were obtained using a scan rate of 20°C/ min within a temperature range from⫺100 to 200°C. Infrared spectra of polymer blend films were deter-mined by using the conventional KBr disk method. A THF solution containing the blend was cast onto a KBr disk and then dried under conditions similar to those used for the preparation of the bulk material. The
films used in this study were sufficiently thin to obey the Beer–Lambert law. FTIR spectra were recorded on a Nicolet Avatar 320 FTIR spectrophotometer from 32 scans collected at a spectral resolution of 1 cm⫺1. Because the samples containing hydroxyl groups are water-sensitive, pure nitrogen gas was used to purge the IR optical box to maintain the dryness of the sample films. IR spectra recorded at elevated temper-atures were obtained by using a cell mounted inside the temperature-controlled compartment of the spec-trometer. The morphologies of various blend
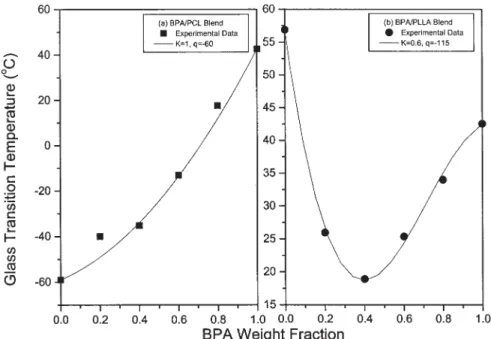
compo-Figure 2 Plots of Tgversus composition based on the Kwei equation for the (a) BPA/PCL and (b) BPA/PLLA blends.
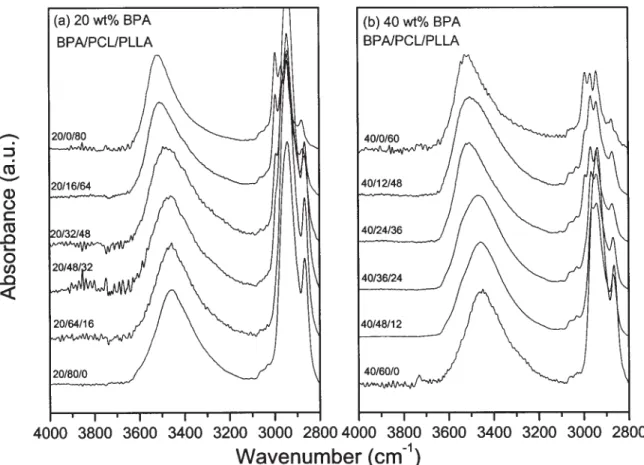
Figure 3 The hydroxyl group stretching region of infrared spectra recorded at 180°C of the (a) BPA/PCL and (b) BPA/PLLA blends having varying compositions.
sitions were observed using an Olympus BX50 micro-scope. A small amount of sample was sandwiched between two microscope cover slides and then heated from room temperature to 280°C at a heating rate of 10°C/min, using a Mettler Toledo FP 90 hot stage having a temperature accuracy of⫾0.1°C.
RESULTS AND DISCUSSION Analyses of binary blends of BPA/polymer Thermal behavior
DSC analysis is used extensively to investigate the miscibility behavior in polymer blends. At first glance, this BPA/PCL/PLLA ternary blend seems to be a
complicated one for analysis by DSC because its three components are all crystalline. For a multifunctional polymer blend system, however, the interassociation equilibrium constants of individual binary miscible pairs are expected to be different. Using the concept of competing equilibrium constants, we are able to iden-tify the phase transitions caused by interassociation of hydroxyl– carbonyl groups or self-association of hy-droxyl– hydroxyl groups. For convenience, we focus first on the thermal properties of the binary blends BPA/PCL and BPA/PLLA. Figure 1 presents the DSC curves of various compositions of BPA/PCL and BPA/PLLA blends recorded during the second heat-ing scan. The glass transition and meltheat-ing tempera-tures of the pure PCL are⫺60 and 60°C, respectively;
TABLE II
Results of Curve Fitting the FTIR Data, Recorded at 180°C, of the BPA/PCL and BPA/PLLA Binary Blends
Free CAO Bonded CAO
fb(%) (cm⫺1) W 1/2(cm⫺1) Af(%) (cm⫺1) W1/2(cm⫺1) Af(%) BPA/PCL 0/100 1735 27 100 – – – 0 20/80 1735 26 66 1709 28 34 26.4 40/60 1736 23 65 1709 28 35 26.6 60/40 1737 20 34 1710 29 66 57.0 80/20 1737 19 32 1711 30 68 58.7 BPA/PLLA 0/100 1757 32 100 – – – – 20/80 1756 33 100 – – – – 40/60 1755 33 100 - – – – 60/40 1754 34 100 – – – – 80/20 1751 36 100 – – – –
Figure 4 The carbonyl group stretching region of infrared spectra recorded at 180°C of the (a) BPA/PCL and (b) BPA/PLLA blends having varying compositions.
the corresponding temperatures for pure PLLA are 57 and 174°C, respectively. Interestingly, even though the molar mass of bisphenol A is only 228 g/mol, it also shows a single Tg behavior at 43°C during the
second heating scan. BPA contains a high density of hydroxyl groups, which probably results in the forma-tion of a weakly noncovalently crosslinked supramo-lecular network. In addition, pure BPA has a melting temperature of 162°C, which we have discussed in a previous study.32 Both binary blends, BPA/PCL and BPA/PLLA, are totally miscible in the amorphous phase based on single values of Tg detected by DSC
analyses, as displayed in Figure 1; their related ther-mal properties are summarized in Table I. Meanwhile, the melting temperatures of PCL and PLLA also shift gradually to lower temperatures upon increasing the content of BPA. A depression in the melting temper-ature is characteristic of a miscible polymer blend in melting state. In the BPA/PCL blend system, the value of Tgof the blend increases upon increasing the BPA
content, but it decreases in the BPA/PLLA blend.
Furthermore, the value of Tgin the BPA/PLLA blend
is lower than that of both the individual components, since intermolecular hydrogen bonding is expected to destroy the crystalline phases of both BPA and PLLA, as is indicated in Figure 1(b). Thus, the small molecule can act as a plasticizer and reduce the value of Tgof
these components. Generally, the Kwei eq. (1)39 has been used widely to predict the variation of the glass transition temperature as a function of the composi-tion of a miscible blend that exhibits hydrogen bond-ing.
Tg⫽
W1Tg1⫹ kW2Tg2
W1⫹ kW2 ⫹ qW1
W2 (1)
where W1 and W2 are the weight fractions of the
compositions, and Tg1 and Tg2 represent the
corre-sponding glass transition temperatures. The fitting constants k and q are parameters corresponding to the strength of hydrogen bonding in the blend. Figure 2
TABLE III
Summary of the Self-Association and Interassociation Equilibrium Constants and Thermodynamic Parameters for the BPA/PCL/PLLA Ternary Blends at Room Temperature
Polymer Molar volume (mL/mol) Molecular weight (g/mol) Solubility parameter (cal/mL)0.5 Self-association equilibrium constant and enthalpy
Interassociation equilibrium constant and enthalpy
KB hB KA hA
BPAa 176.6 228.3 10.38 66.8b ⫺5.2b
PCLa 107 114 9.21 90.1c ⫺4.2c
PLLAa 69.8 86.1 9.61 10.0d ⫺3.0e
a
The molar volume, molecular weight, and solubility parameter are estimated by using a group contribution method proposed by Kwei et al.18
;b18
;c12;d12
; ande
estimated by using the⌬.18
shows the dependence of the value of Tgon the
com-position of the miscible BPA/PCL and BPA/PLLA blends, where k⫽ 1 and q ⫽ ⫺85 for the former blend and k ⫽ 0.6 and q ⫽ ⫺100 for the latter. Negative deviations were also observed in many previous stud-ies.40 – 42 The fact that both of the values of q are
negative indicates that the self-associated hydrogen-bonded structure of BPA is broken to form weaker interassociated hydrogen bonds. According to the val-ues of k and q obtained experimentally in this study, the interassociation hydrogen bonding in the BPA/ PCL blend is greater than that in the BPA/PLLA blend. To support this claim, we turned our attention next to FTIR analyses.
FTIR analyses
FTIR spectroscopy is a useful technique for investigat-ing the strength of hydrogen bondinvestigat-ing between differ-ent molecules. Figure 3 shows the FTIR spectra of the BPA/PCL and BPA/PLLA blends in the regions of the hydroxyl group vibrations; the spectra were obtained using blends having varying BPA fractions and were recorded at 180°C (i.e., above the melting tempera-tures of these three components). Pure BPA exhibits a broad band centered at 3383 cm⫺1, which we attribute to the wide distribution of hydrogen-bonded hydroxyl groups. A small and narrow band at 3525 cm⫺1results from free hydroxyl groups. The broad hydrogen-bonded hydroxyl band shifts to higher wave numbers
upon increasing both the PCL and PLLA contents, with the wave numbers for samples having 20 wt % BPA at 3450 and 3520 cm⫺1 for PCL and PLLA, re-spectively. This shift reflects a new distribution of hydrogen bonds, i.e., specific hydroxyl– hydroxyl and hydroxyl– carbonyl interactions. In general, the fre-quency difference between a hydrogen-bonded hy-droxyl absorption and the free hyhy-droxyl absorption (⌬) allows a rough estimate to be made of the average hydrogen bonding strength and its enthalpy in hydro-gen-bonded blend systems.43Thus, all these observed
changes arise from switching the strong self-associa-tion mediated by hydroxyl– hydroxyl bonds into the relatively weaker intermolecular hydroxyl– carbonyl bonds of the BPA/PCL and BPA/PLLA blends. From analysis of these spectra, the average strengths of the hydrogen bonds for either the self-association of the hydroxyl groups of BPA or its interassociation with the carbonyl groups of PCL and PLLA increases in the order BPA/BPA (⌬ ⫽ 142 cm⫺1) ⬎ BPA/PCL (⌬ ⫽ 75 cm⫺1) ⬎ BPA/PLLA (⌬ ⫽ 5 cm⫺1). All these
results are consistent with the negative values of q obtained using the Kwei equation. Figure 4 shows the corresponding region of the carbonyl group vibration in the FTIR spectra recorded at 180°C of the BPA/PCL and BPA/PLLA blends in which the BPA fractions were varied. Both pure PCL and PLLA exhibit a car-bonyl vibration band centered at 1734 and 1756 cm⫺1, respectively, that corresponds to the free carbonyl group. On increasing the BPA content of the BPA/
TABLE IV
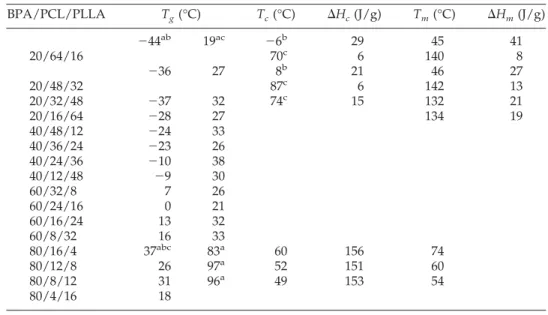
Thermal Properties of BPA/PCL/PLLA Ternary Polymer Blends BPA/PCL/PLLA Tg(°C) Tc(°C) ⌬Hc(J/g) Tm(°C) ⌬Hm(J/g) 20/64/16 ⫺44ab 19ac ⫺6b 29 45 41 70c 6 140 8 20/48/32 ⫺36 27 8b 21 46 27 87c 6 142 13 20/32/48 ⫺37 32 74c 15 132 21 20/16/64 ⫺28 27 134 19 40/48/12 ⫺24 33 40/36/24 ⫺23 26 40/24/36 ⫺10 38 40/12/48 ⫺9 30 60/32/8 7 26 60/24/16 0 21 60/16/24 13 32 60/8/32 16 33 80/16/4 37abc 83a 60 156 74 80/12/8 26 97a 52 151 60 80/8/12 31 96a 49 153 54 80/4/16 18 a
From the BPA phase.
b
From the PCL phase.
c
From the PLLA.
ab
From the BPA-PCL phases.
ac
From the BPA-PLLA phases.
abc
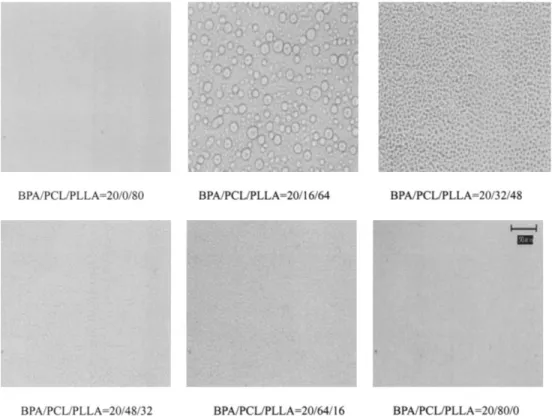
Figure 6 Optical micrographs recorded at 40°C of BPA/PCL/PLLA ternary blends having varying compositions. BPA content: (a) 20 wt % and (b) 40 wt %.
PCL blend system, a second band appears at a lower wave number (1710 cm⫺1), which we attribute to vi-bration of the hydrogen-bonded carbonyl groups.
These two bands representing the groups can be fitted well to the Gaussian function. The fraction of the hydrogen-bonded carbonyl group can be calculated
Figure 7 The hydroxyl group stretching region of infrared spectra recorded at 180°C of BPA/PCL/PLLA ternary blends containing a constant composition of BPA: (a) 20 wt % and (b) 40 wt %.
Figure 8 The carbonyl group region of infrared spectra recorded at 180°C of ternary blend of BPA/PCL/PLLA containing constant composition of BPA: (a) 20 wt % and (b) 40 wt %.
using the absorptivities ratio (a ⫽ aHB/aF ⫽ 1.5) in
accord with previous studies of infrared spectra of systems undergoing hydroxyl– carbonyl interassocia-tion.44 Table II summarizes the results from curve
fitting and indicates that the fraction of hydrogen-bonded carbonyl groups increases upon increasing the BPA content. In contrast, the hydrogen-bonding inter-action between BPA and PLLA is not strong, since we observed no significant shift in the wave number of the carbonyl group for the BPA/PLLA blends that was also observed in PVPh/PLLA blend.22 Only the
half-width of the signal of the free PLLA carbonyl
groups is increased and its wave number shifts by 5 cm⫺1when blended with BPA at 80 wt %. Table II also summarizes the results of curve fitting these shifts to the Gaussian function. Our results appear to be con-sistent with the inter- and self-association equilibrium constants obtained for the PVPh/PCL and PVPh/ PLLA blend systems based on the Painter–Coleman association model (Table III). The value of the self-association equilibrium constant (KB) for PVPh is 66.8
at 25°C, and the values of the interassociation equilib-rium constants (KA) for the PVPh/PCL and PVPh/
PLLA blend systems are 90.1 and 10.0, previously.19,21
TABLE V
Results of Curve Fitting the FTIR Data Recorded at 180°C Results for the BPA/PCL/PLLA Ternary Blends
BPA/PCL/PLLA
PCL PLLA
fb(%)
Free CAO Bonded CAO Free CAO
(cm-1) W 1/2cm-1 Af(%) (cm-1) W1/2(cm-1) Af(%) (cm-1) W1/2(cm-1) Af(%) 20/64/16 1736 16 32 1722 30 45 1756 30 23 48.7 20/48/32 1735 13 19 1722 32 35 1755 31 46 54.8 20/32/48 1734 12 5 1723 35 31 1756 31 64 80.9 20/16/64 1733 10 1 1720 31 12 1756 32 87 86.0 40/48/12 1736 14 15 1713 30 50 1754 32 35 69.3 40/36/24 1736 13 11 1714 30 40 1756 31 49 71.4 40/24/36 1738 15 18 1709 30 22 1758 30 60 63.4 40/12/48 1738 15 7 1719 37 18 1758 30 75 44.8 60/32/8 1736 15 11 1711 34 58 1757 30 31 77.5 60/24/16 1736 14 11 1713 30 39 1756 31 48 67.0 60/16/24 1737 16 13 1712 30 36 1757 29 51 65.0 60/8/32 1737 17 15 1714 29 23 1758 29 62 51.0 80/16/4 1736 15 10 1710 25 49 1754 29 41 75.7 80/12/8 1736 14 10 1710 28 46 1755 29 44 71.1 80/8/12 1737 15 11 1710 27 39 1755 29 50 68.5 80/4/16 1736 14 12 1710 27 38 1754 29 50 67.5
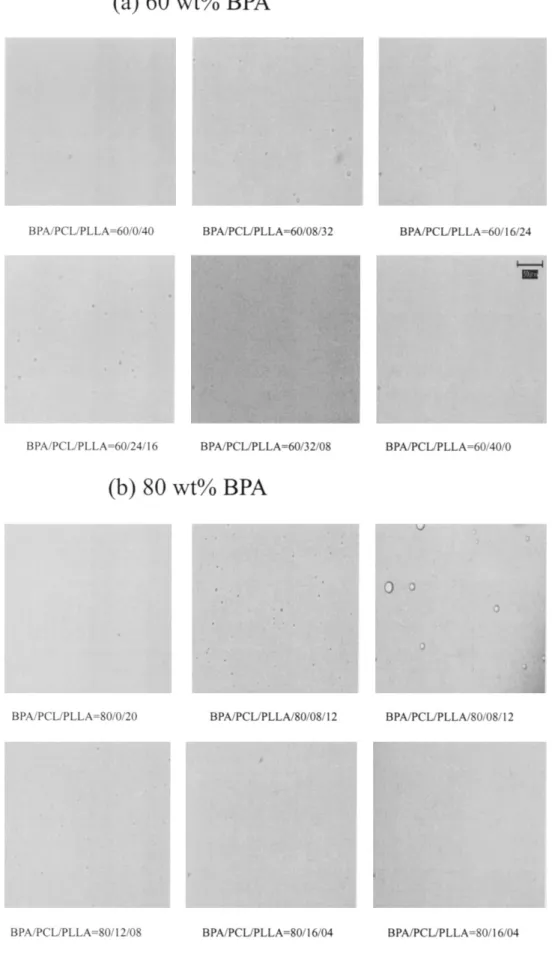
Figure 10 Optical micrographs recorded at 40°C of BPA/PCL/PLLA ternary blends having varying BPA content: (a) 60 wt % and (b) 80 wt %.
It is apparent that these results, from both theoretical predictions and experimental observations, indicate that the interassociation hydrogen bonding between phenolic-hydroxyl groups and PCL’s carbonyl is in-deed stronger than that between phenolic-hydroxyl groups and PLLA’s carbonyl from. In addition, the ratio KA/KBfor the PLLA/BPA system is quite small,
indicating that the hydroxyl– carbonyl hydrogen-bonding of PLLA is insignificant.
Bisphenol A/PCL/PLLA ternary blends
Figure 5 shows second-run DSC curves of BPA/PCL/ PLLA ternary blends containing a constant BPA con-tent [(a) 20 wt %; (b) 40 wt %] and various PCL/PLLA ratios (80:20, 60:40, 40:60, and 20:80). Table IV summa-rizes the thermal properties of these systems. Al-though both the BPA/PCL and BPA/PLLA binary blends exhibit a single value of Tg, all the BPA/PCL/
PLLA ternary blends containing 20 and 40 wt % of BPA have two values of Tg, which implies that their
components are immiscible in the amorphous phase. In general, the phase separation in a ternary blend is caused by the difference in the physical interactions between BPA/PCL and BPA/PLLA. In addition, the difference in interassociation equilibrium constant be-tween BPA/PCL and BPA/PLLA blend systems also tends to induce phase separation.45– 47 Although the
physical interaction (⌬ effect) is favored in the BPA/ PLLA blend (smaller solubility parameter difference), BPA interacts more favorably with PCL than it does with PLLA, which is defined as a⌬K effect (chemical interaction). In general, the ⌬K effect is more
domi-nant than the effect in a ternary blend system. Clearly, the melting temperature and enthalpy of the PLLA phase increase upon the addition of PCL into the BPA/PLLA binary blend, such as we observe in Fig-ures 5(a) and 5(b) for the blends having BPA/PCL/ PLLA ⫽ 20/16/64 and 40/48/12. This phenomenon arises from the weaker hydroxyl– carbonyl interasso-ciation of BPA/PLLA gradually breaking down upon increasing the PCL content in these ternary blends. As a result, the PLLA become excluded from the miscible system to form its own domain and crystallization occurs. Therefore, these BPA/PCL/PLLA ternary blends containing relatively low BPA content (20 or 40 wt %) have two values of Tg. The higher and lower
glass transitions temperatures represent the BPA-PLLA and BPA-PCL phases, respectively. We empha-size that the value of Tg of the BPA-PLLA phase in
Figure 5(a) at higher PCL content overlaps slightly with the melting temperature of the PCL phase. To further confirm that phase separation indeed occurs in this ternary blend, we turned our attention next to analyses by OM.
Figure 6 shows optical micrographs of BPA/PCL/ PLLA blends at constant BPA content (20 and 40 wt %). As we see in these photographs, all of these ter-nary blends are heterogeneous, while all of the biter-nary blends are homogeneous. Clearly, the phase separa-tion domain size decreases with increasing of the PCL content as a result of the average hydrogen bonding strength increasing accordingly, which is confirmed by FTIR spectra. Figure 7 shows the regions of the hydroxyl group vibrations in the FTIR spectra ob-tained at 180°C for BPA/PCL/PLLA blends having
Figure 11 The carbonyl group region of infrared spectra recorded at 180°C of ternary blend of BPA/PCL/PLLA containing constant composition of BPA: (a) 60 wt % and (b) 80 wt %.
Figure 12 Optical micrographs recorded at various temperatures of BPA/PCL/PLLA ternary blends having selected compositions.
constant BPA (20 or 40 wt %) and varying PCL con-tent. Clearly, the signal of the hydrogen-bonded hy-droxyl group of the BPA/PLLA system shifts to lower wave number with increasing PCL content, indicating that the average strength of hydrogen bonding in-creases during this process. Figure 8 presents the car-bonyl stretching region (1660 –1800 cm⫺1) of the infra-red spectra of these ternary blends measuinfra-red at 180°C. Three major absorptions are observed for stretching of the carbonyl groups. As mentioned earlier, we at-tribute the vibration bands centered at 1734 and 1756
cm⫺1 to the free carbonyl groups of PCL and PLLA, respectively. We attribute the third band at 1710 cm⫺1 to the vibration of the hydrogen-bonded carbonyl groups of PCL. These three bands also can be fitted well to a Gaussian function, as presented in Figure 8(b), and Table V summarizes the results of this curve fitting. At lower BPA content (20 wt %), the fraction of PCL’s hydrogen-bonded carbonyl group increases by increasing the PLLA content, which indicates that the hydroxyl groups of BPA prefer interacting with the carbonyl groups of PCL and, thus, the PLLA phase separates from the miscible BPA/PCL phase. How-ever, at higher BPA content (40 wt %), the fraction of hydrogen-bonded carbonyl group of PCL increases initially and then decreases with further increase of the PLLA content, because a portion of the hydroxyl groups of BPA begins to interact with the carbonyl group of the PLLA. As a result, the fraction of hydro-gen-bonded carbonyl groups of PCL decreases at higher PLLA content.
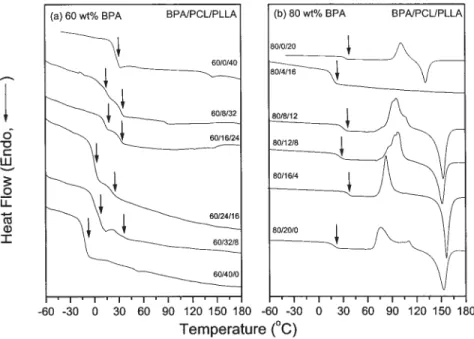
Figure 9 shows the conventional second-run DSC curves of BPA/PCL/PLLA ternary blends containing a higher constant composition of BPA [(a) 60 wt %; (b) 80 wt %]; Table IV also summarizes their related thermal properties. Clearly, single values of Tgare observed for
the ternary blend having a BPA content of 80 wt %, which strongly suggests that these blends are fully mis-cible and have a homogeneous amorphous phase. Fur-thermore, the recrystallization and melting temperatures
Figure 13 Ternary phase diagram of the BPA/PCL/PLLA system at (a) 40, (b) 140, and (c) 200°C. The open circles represent miscible ternary blends and the full circles represent immiscible ternary blends.
Figure 14 Values of equilibrium constants as a function of temperature between 25 and 200°C.
should arise from the BPA phase. In contrast, two values of Tgare also observed at 60 wt % BPA. These two Tg’s
are close to one another, however, and become indistin-guishable in comparison with that observed at lower BPA content (as shown in Fig. 5). Figure 10 shows cor-responding optical micrographs of the BPA/PCL/PLLA system at constant BPA contents (60 and 80 wt %): it appears that both the binary and ternary blends are homogeneous, which indicates that these blends are to-tally miscible. The different results obtained from the DSC and OM analyses at a BPA content of 60 wt % content arise because of the different resolutions ex-pected from each measurement.
In general, DSC discriminates between situations in which there are either one or two values of Tg’: a single
value of Tgis the most convenient criterion for
determin-ing the miscibility of a polymer blend. In contrast, an immiscible polymer blend exhibits more than one value of Tg. A single compositionally dependent glass
transi-tion indicates full miscibility at dimensions on the order of 20–40 nm, whereas optical transparency in an OM analysis indicates miscibility dimensions on the order of
only ca.1 m. As a result, in some cases, a film that appears homogeneous by OM analysis may have two values of Tgwhen analyzed by DSC. The carbonyl group
stretching region (1660–1800 cm⫺1) of the infrared spec-tra of these ternary blends measured at 180°C are pre-sented in Figure 11. The three major absorptions for carbonyl group stretching are similar to those displayed in Figure 8 and the results of curve fitting from Gaussian functions are also summarized in Table V. The fraction of hydrogen-bonded carbonyl group of PCL is decreased with increasing the PLLA content, which indicates that the hydrogen bonding interaction exists between the hydroxyl groups of BPA and the carbonyl groups of both PCL and PLLA. As a result, the immiscible BPA/PCL/ PLLA blend tends to become a miscible ternary blend at relatively higher BPA content.
Using OM to observe phase morphologies of BPA/ PCL/PLLA ternary blends with respect to
temperatures
We examined the effect that temperature has on the phase transition (from phase separation to miscibility
Figure 15 FTIR spectra recorded at various temperatures displaying the (a) hydroxyl and (b) carbonyl group stretching regions for the blend BPA/PCL/PLLA⫽ 40/24/36.
upon heating) in the immiscible ternary blends, using OM with a heating stage. Figure 12 shows optical micrographs recorded at various temperatures of sev-eral selected ternary blend compositions having rela-tively low BPA content (20 and 40 wt %). The phase separation domain of these ternary blend composi-tions disappeared with the increasing the tempera-ture, which indicates that an upper critical solution temperatures (UCST) phase diagram exists at lower BPA content. However, at higher BPA content, a ho-mogeneous single phase was observed at all measured temperatures (for brevity, the images are not shown here). In addition, the binary PCL/PLLA blend also exhibits UCST phase diagram. Figure 13 summarizes the phase diagrams of the ternary blends at different temperatures based on the OM analyses. At 40°C, the addition of a large BPA content (⬎60 wt %) cause the binary PCL/PLLA blend to become miscible. At 140°C, the miscibility window become a closed-loop phase diagram, which is similar to the situations ob-served for phenolic/PEO/PCL, phenoxy/PMMA/ PEO, and SAA/PMMA/PEO ternary blends.48 –50 In addition, the phase diagram becomes totally miscible at 200°C, which has also been observed in previous studies.51–54 The enhancement of the miscibility ob-served in this ternary BPA/PCL/PLLA system at lower BPA content is caused by the rapid decrease of the interassociation equilibrium constant of the BPA/ PCL blend (higher interassociation enthalpy)55 upon the increasing the temperature; the⌬K and effects are balanced at higher temperature as presented in Figure 14. Therefore, the⌬K effect becomes smaller at higher temperature. A large entropy change dominates at higher temperature, and thus, miscibility is enhanced. Figure 15 provides evidence that the fraction of hy-drogen-bonded carbonyl group of PCL (b) and the average strength of hydrogen bonding (a) decreases upon increase in temperature.
CONCLUSIONS
The addition of BPA enhances the miscibility of the immiscible binary PCL/PLLA blend and eventually transforms it into a completely miscible blend having a single value of Tgwhen a sufficiently large amount
of BPA is present. The interassociation equilibrium constant between the hydroxyl group of BPA and the carbonyl groups of PCL is higher than that for the corresponding interaction with the carbonyl groups of PLLA. This result implies that the tendency to forming hydrogen bonds between BPA and PCL is more favor-able than the interassociation of BPA with PLLA. OM measurements indicate an UCST phase diagram, since the ⌬K effect becomes smaller as temperatures in-crease above room temperature.
References
1. Ha, C. K.; Cho, W. J Prog Polym Sci 2002, 27, 759.
2. Reeve, M. S.; McCathy, S. P.; Downey, M. J.; Gross, R. A. Macromolecules 1994, 27, 825.
3. Kikkawa, Y.; Abe, H.; Iwata, T.; Doi, Y. Biomacromolecules 2001, 2, 940.
4. Eastmond, G. C. Adv Polym Sci 1999, 149, 223.
5. Li, S.; Liu, L.; Garreau, H.; Vert, M. Biomacromolecules 2003, 4, 372.
6. Hiljanen-Vainio, M.; Varpomaa, P.; Seppala, J.; Tormala, P. Mac-romol Chem Phys 1996, 197, 1503.
7. Yang, J. M.; Chen, H. L.; You, J. W.; Hwang, J. C. Polym J 1997, 29, 657.
8. Wang, L.; Ma, W.; Gross, R. A.; McCathy, S. P. Polym Degrad Stab 1998, 59, 161.
9. Dell’Erba, T.; Groeninckx, G.; Maglio, G.; Malinconico, M.; Migliozzi, A. Polymer 2001, 42, 7831.
10. Tsuji, H.; Yamada, T.; Suzuki, M.; Itsuno, S. Polym Int 2003, 52, 269.
11. Maglio, G.; Migliozzi, A.; Palumbo, R.; Immirzi, B.; Volpe, M. G. Macromol Rapid Commun 1999, 20, 236.
12. Choi, N. S.; Kim, C. H.; Cho, K. Y.; Park, J. K. J Appl Polym Sci 2002, 86, 1892.
13. Kim, C. H.; Cho, K. Y.; Choi, E. J.; Park, J. K. J. Appl Polym Sci 2000, 77, 226.
14. Na, Y. H.; He, Y.; Shuai, X.; Kikkawa, Y.; Doi, Y.; Inoue, Y. Biomacromolecules 2002, 3, 1179.
15. Scott, R. L. J Chem Phys 1949, 17, 279. 16. Tompa, H. Trans Faraday Soc 1949, 45, 1142.
17. Pomposo, J. A.; Calahorra, E.; Eguiazabal, I.; Cortazar, M. Mac-romolecules 1993, 26, 2104.
18. Kwei, T. K.; Frisch, H. L.; Radigan, W.; Vogel, S. Macromole-cules 1977, 10, 157.
19. Kuo, S. W.; Huang, C. F.; Chang, F. C. J Polym Sci Part B: Polym Phys 2001, 39, 1389.
20. Kuo, S. W.; Chan, S. C.; Chang, F. C. Macromolecules 2003, 36, 6653.
21. Chen, H. L.; Liu, H. H.; Lin, J. S. Macromolecules 2000, 33, 4856. 22. Zhang, L. L.; Goh, S. H.; Lee, S. Y. J Appl Polym Sci 1998, 70,
1811.
23. Zhang, L. L.; Goh, S. H.; Lee, S. Y. Polymer 1998, 39, 4841. 24. Koning, C.; Van-Duin, M.; Pagnoulle, C.; Jerome, R. Prog Polym
Sci 1998, 23, 707.
25. He, Y.; Asakawa, N.; Inoue, Y. Macromol Chem Phys 2001, 202, 1035.
26. He, Y.; Asakawa, N.; Inoue, Y. J Polym Sci Part B: Polym Phys 2000, 38, 1848.
27. He, Y.; Asakawa, N.; Inoue, Y. J Polym Sci Part B: Polym Phys 2000, 38, 2891.
28. Li, J.; He, Y.; Inoue, Y. J Polym Sci Part B: Polym Phys 2001, 39, 2108.
29. Li, J.; He, Y.; Ishida, K.; Yamane, T.; Inoue, Y. Polym J 2001, 33, 773.
30. He, Y.; Asakawa, N.; Li, J.; Inoue, Y. J Appl Polym Sci 2001, 82, 640.
31. Watanabe, T.; He, Y.; Asakawa, N.; Yoshie, N.; Inoue, Y. Polym Int 2001, 50, 463.
32. Kuo, S. W.; Chan, S. C.; Chang, F. C. Polymer 2002, 43, 3653. 33. Li, D. X.; Goh, S. H. J Polym Sci Part B: Polym Phys 2001, 39,
1815.
34. Li, D. X.; Goh, S. H. J Appl Polym Sci 2001, 81, 901.
35. Li, D. X.; Goh, S. H. J Polym Sci Part B: Polym Phys 2002, 40, 1125.
36. Li, D. X.; Goh, S. H. Polymer 2002, 43, 6853.
38. Li, D. X.; Goh, S. H. Macromol Chem Phys 2002, 203, 2334. 39. Kwei, T. K. J Polym Sci Polym Lett Ed 1984, 22, 307.
40. Li, X. D.; Goh, S. H. J Polym Sci Polym Phys Ed 2003, 41, 789. 41. Kuo, S. W.; Chang, F. C. Macromol Chem Phys 2002, 202, 868. 42. Wu, H. D.; Chu, P. P.; Ma, C. C. M.; Chang, F. C.
Macromole-cules 1999, 32, 3097.
43. Moskala, E. J.; Varnell, D. F.; Coleman, M. M. Polymer 1985, 26, 228.
44. Coleman, M. M.; Graf, J. F.; Painter, P. C. Specific Interactions and the Miscibility of Polymer Blends; Technomic Publishing: Lancaster, PA, 1991.
45. Coleman, M. M.; Painter, P. C. Prog Polym Sci 1995, 20, 1. 46. Zhang, H.; Bhagwagar, D. E.; Graf, J. F.; Painter, P. C.; Coleman,
M. M. Polymer 1994, 35, 5379.
47. Coleman, M. M.; Yang, X.; Painter, P. C.; Graf, J. F. Macromol-ecules 1992, 25, 4414.
48. Kuo, S. W.; Lin, C. L.; Chang, F. C. Macromolecules 2002, 35, 278.
49. Hong, B. K.; Kim, J. K.; Jo, W. H.; Lee, S. C. Polymer 1997, 38, 4373.
50. Jo, W. H.; Kwon, Y. K.; Kwon, I. H. Macromolecules 1991, 24, 4708.
51. Min, K. E.; Chiou, J. S.; Barlow, J. W.; Paul, D. R. Polymer 1987, 28, 172.
52. Guo, Q. P. Eur Polym J 1996, 32, 1409. 53. Guo, Q. P. Eur Polym J 1990, 26, 1329. 54. Goh, S. H.; Ni, X. Polymer 1999, 40, 5733.


![Figure 5 shows second-run DSC curves of BPA/PCL/ PLLA ternary blends containing a constant BPA con-tent [(a) 20 wt %; (b) 40 wt %] and various PCL/PLLA ratios (80:20, 60:40, 40:60, and 20:80)](https://thumb-ap.123doks.com/thumbv2/9libinfo/7592864.127789/11.918.233.695.116.452/figure-second-curves-ternary-containing-constant-various-ratios.webp)
