義 守 大 學
電 子 工 程 學 系
博士論文
基於人類視覺生理特徵的LED照明控制研究
The study of LED lighting control based on
physiological characteristic of human vision
研 究 生: 王秉杰
指導教授: 汪啟茂
ACKNOELEDGMENTS
首先要感謝的是我的指導教授汪啟茂教授,不但提供了學術與產業的雙方面 的學習環境,並且讓我擁有能夠生活無虞的工作,進而能夠專注於能力的提升。 更要感謝的是對我在參與研討會的指導,各種論文不厭其煩的修改與審視使其更 完整呈現。 感謝諸位口試委員:張國明教授、陳立祥教授,許渭州教授和王周珍教授在 口試時給予的指導和建議,令我的論文更為順暢,使我獲益良多。 在此感謝義守大學電子工程學系主任、系上各領域教授的指導及系助的幫忙。 感謝李革緯學長、陳裕仁對於實作上的幫助。感謝博士班在校期間學弟何祖盛的 幫助與鼓勵。感謝學弟洪以堅、張年傑、鄭任皓、李偉綸、吳柏穎、柳旺祺在實 驗工作上的幫助。感謝在同間實驗室的學弟妹:林駿翔、柯嘉倫、郭怜妤、黃馨 荭和王渝睿,你們提供的料理在枯燥困苦的研究生活中,帶給我許多樂趣和士氣 提振。 感謝台灣矽微電子公司的董事長張益敏博士、總經理蔡靖層博士、研發部經 理劉漢平博士以及 Flo Technologies, Inc. 的 Henry Halimi ,帶給我許多實作面的 技術觀點與實作機會。最後要感謝的是我的父母,由於你們的體諒與包容,使我能夠完成學位。感 謝在此段時間內所有關心及幫助過我的人,在此獻上我的感謝。
基於人類視覺生理特徵的 LED 照明控制研究
研究生:王秉杰 指導教授:汪啟茂
義守大學電子工程研究所
中文摘要
照明研究在節省能源上是一個重要課題。目前固態照明已經成為引導照明系 統的顯學。自白光 LED 發明以來,已經成為一種對節能有重大影響的研究。白 光 LED 的驅動方法有許多種,本論文專注於 pulse-width modulation (PWM)操作 LED 的設計當作主題,針對給視覺使用的照明做研究。本論文所探討的視覺, 除了人類視覺之外還探討模仿人類設計而來的機器視覺。 人類的視覺很難度量。本論文整理了過去百年來眼科與視覺醫學方面進行過 的研究,挑選適合給照明設計利用的理論。根據視覺生理學理論,可以整理成三 態即閃爍、閃爍融合、穩態。同樣的,機器視覺也有類似的三態構造,但機器視 覺直接受到應用要求的不同而有所不同,較容易理解。根據整理完成的相關理論, 供給之後的實驗做應用。 為了能夠尋找適用於普遍照明系統的設計,不採用醫學級精密測試實驗,而 使用可控的 PWM 產生器與 LED lamp,安裝於半封閉燈箱以人眼觀察進行實驗。 實驗環境加入兩種環境光源進行,目的是模擬室內照明。進行三種實驗:閃爍實驗尋找最高刺激度的參數、閃爍融合實驗尋找使閃爍感消失的區域、穩態照明實 驗測試人眼不能分辨的最小 duty 差。本實驗可得一個總結,製作警告燈時最佳 頻率範圍在 7Hz 至 15Hz 間;照明燈為 200Hz 以上,duty 調整間隔為 10%為最 佳。 在早期的實驗發現,LED 在 PWM 驅動下呈現的亮度並非完全線性,而一些 論文從電流對亮度的反應一樣能夠支持這樣的論點。非線性亮度的問題,在機械 視覺,如自動化生產線檢查就造成困難。因此,設計一個自動化 data logger 來進 行線性度驗證。採用最簡單的 LED 驅動電路避免任何可能的影響,將 LED lamp 與照度計封進一個暗箱,用 PC 下指令操作 PWM 的頻率與 duty 後等待穩定,讀 取照度並留下紀錄。依此流程完成 50 KHz 到 1 KHz,duty 間隔為 10%的實驗。 實驗完成後發現最線性的區域落在 4KHz 到 3KHz 之間。由於照明設備與選用 的 LED 不會一樣,但可以利用此方法進行線性度校正。 最後,本論文完成了對於人類視覺的最佳照明驅動,以及對機器視覺的最佳 照明驅動方法。在未來如果能將兩者合一探討,將會是另一個有趣的議題。
The study of LED lighting control based on
physiological characteristic of human vision
Student: Ping-Chieh Wang Advisor: Chii-Maw Uang
Department of Electronic Engineering
I-Shou University
ABSTRACT
Lighting research on saving energy is an important subject. The solid-state lighting has become a famous doctrine to guide the lighting system. The White-light LED has a significant effect on energy saving, since the invention has become an important research. There are many kinds of White-light LED driver method, this dissertation focus on Pulse-Width Modulation (PWM) operation LED lighting, based on human vision characteristics. In this dissertation, not only discuss human vision, also discuss machine vision that mimics human vision.
Human vision is very difficult to measure. In this dissertation, we analyzed researches conducted over the past hundred years the medical aspects of ophthalmology and visual, selected the suitable theory for lighting system design. According to the theory of visual physiology, it may be organized into three architectures which are flashing, flicker fusion, and the steady state lit. Similarly, machine vision has a similar structure and three architectures. Machine vision and human vision have some differences. The machine vision character is directly by requirements of the application. According to the related consolidation theory, could supply the experiment and application. And design PC software to expand the data logger function.
In order to find suitable for general lighting system design, we do not use the medical level precision test experiment. We use a controllable PWM generator with LED lamp, mounted into semi-enclosed box, with the human eye to observe the phenomenon and then finish the experiments. Experiment environment use two light sources, the purpose is to simulate the indoor lighting. Three experiments: flashing experiment find stimulating the highest degree of parameters; flicker fusion experiments for flashing feeling disappear area; and steady state lighting test to the human eye can't distinguish the minimum differential duty of the PWM. The summary of experiment: the best warning light frequency located between 7 Hz to 15 Hz; lights for more than 200 Hz, duty adjustment between 10% are the best.
Found in early experiment, the relation of LED brightness to PWM driven is not completely linear, and some papers propose the driven current response to brightness can support this argument. Nonlinear brightness in machine vision, such as automatic product checking, will be a hard problem. Therefore, we use the data logger and PC software control, verifies the LED linearity. In order to avoid any circuit effect, we use the simplest driver circuit. LED lamp and brightness meter closed in a small dark
room, use PC command PWM generator to set frequency and duty, after waiting for stability, read the intensity of illumination and record. In this experiment process, automatic adjust frequency from 50 KHz to 1 KHz, duty form 90% to 10%. The experiment results showed, the linear area is between 4 KHz to 3 KHz. Due to the lighting equipment and LED are different with our experiment, but can use the method of linearity correction.
Finally, this dissertation completed the best lighting for human vision drive, and the best lighting for machine vision driven approach. In the future, if one can explore both, it will be another interesting topic.
L
IST OFC
ONTENTSACKNOELEDGMENTS ... I 中文摘要 ... II ABSTRACT ... IV LIST OF CONTENTS ... VII
LIST OF FIGURES ... IX
LIST OF TABLES ... XI
Chapter 1 Introduction ... 1
1.1 Motivation ... 1
1.2 Contributions of dissertation ... 2
1.3 An overview of the dissertation ... 2
Chapter 2 The Pulse-width modulation LED dimming ... 4
2.1 PWM generator based on the 555 timer ... 5
2.2 PWM generator based on micro controller ... 6
2.3 Summary ... 7
Chapter 3 The characteristic of vision ... 8
3.1 The characteristic of human vision ... 8
3.2 The characteristic of machine vision ... 13
3.3 Summary ... 14
Chapter 4 The optimized PWM driving for the lighting system based on human vision ... 15
4.1 Introduction ... 15
4.2 Experimental methods ... 16
4.2.1. Experimental equipment ... 16
4.2.2. Flicker experiments methods ... 20
4.2.4. Stable lighting experiments methods ... 21
4.3 Results and discussion ... 21
4.3.1. Flash experiments result... 22
4.3.2. CFF experiments result ... 26
4.3.3. Stable lighting experiments result ... 30
4.3.4. Compare experimental results ... 33
4.4 Summary ... 33
Chapter 5 The optimized PWM driving for the lighting system based on machine vision ... 35
5.1 Data logger with control ... 36
5.1.1. Hardware ... 37
5.1.2. Software ... 39
5.1.3. PC side software architecture ... 47
5.1.4. Summary of data logger ... 51
5.2 Experiment methods ... 51
5.3 Results and discuss ... 52
5.4 Summary ... 55
Chapter 6 Conclusion and future work ... 57
6.1 Conclusion of lighting of human vision ... 57
6.2 Conclusion of data logger ... 57
6.3 Conclusion of lighting of machine vision... 58
6.4 Future works ... 58
L
IST OFF
IGURESFig. 2.1 PWM signal ... 4
Fig. 2.2 The 555 timer PWM circuit ... 5
Fig. 3.1 The relationship between light intensity and duration ... 10
Fig. 3.2 Brightness and stimulus time ... 11
Fig. 3.3 CFF scatter diagram... 12
Fig. 4.1 Experiment equipment ... 17
Fig. 4.2 Front view ... 17
Fig. 4.3 Experiment side view ... 18
Fig. 4.4 Experiment top view ... 18
Fig. 4.5 Test method, equipment and observer ... 19
Fig. 4.6 High sensitivity frequency in lighting ON ... 24
Fig. 4.7 High sensitivity frequency in lighting OFF ... 24
Fig. 4.8 CFF in lighting on... 28
Fig. 4.9 CFF in lighting off ... 28
Fig. 4.10 Duty difference ... 31
Fig. 5.1 Hardware aschitecture ... 38
Fig. 5.2 USB application hierarchy... 40
Fig. 5.3 Dual USB disk program map... 40
Fig. 5.4 Time trigger flow diagram ... 44
Fig. 5.5 Menu system ... 44
Fig. 5.6 A long time temperature recoder example ... 46
Fig. 5.7 Sample recoder flow diagram ... 46
Fig. 5.8 Statistical results ... 47
Fig. 5.10 High frequency nonlinearly curve ... 53 Fig. 5.11 Low frequency linearly curve ... 54 Fig. 5.12 Signal on collector ... 55
L
IST OFT
ABLESTable 4.1 Environment (Lux) ... 19
Table 4.2 Fluorescent ON, Observer at point A ... 22
Table 4.3 Fluorescent ON, Observer at point B ... 23
Table 4.4 Fluorescent OFF, Observer at point A ... 23
Table 4.5 Fluorescent OFF, Observer at point B ... 23
Table 4.6 The highset sensitivity duty cycle ... 25
Table 4.7 Fluorescent ON, Observer at point A ... 26
Table 4.8 Fluorescent ON, Observer at point B ... 27
Table 4.9 Fluorescent OFF, Observer at point A ... 27
Table 4.10 Fluorescent OFF, Observer at point B ... 27
Table 4.11 Duty different in Fluorescent ON ... 30
Table 4.12 Duty different in Fluorescent OFF ... 31
Chapter 1 Introduction
This dissertation mainly focuses on the optimization of driving Light-Emitting Diode (LED) lighting. The short introduction on research motivation which the major contributions: best driving Pulse-Width Modulation (PWM) parameter for LED lighting. Finally the detailed dissertation organization and structure will be described.
1.1 Motivation
General lighting accounts for approximately 18% of global energy usage. Improving lighting system efficiency will save energy and reduce carbon emissions. Energy efficiency has become one of the most widely researched topics. The LED lighting has gradually replaced many of the traditional lighting devices.
White-light LED (WLED) is generally driven by using DC power. However, PWM) is another potential technique for increasing energy efficiency. PWM is a period square wave voltage with two parameters—namely frequency and duty. Frequency is the number of period waves per second whereas duty is the high voltage part in a square wave in proportion. High voltage duty is also sometimes referred to as duty ON while the low voltage in square wave is referred to as duty OFF. At the duty ON period, the LED lamp is lit. During the duty OFF period, the LED lamp has no power. This dissertation discussed optimized PWM driving for the lighting system based on some characteristic, work for human vision and machine vision.
The design of machine vision system imitates the human visual, but there are still quite different. We started in human vision and introduce machine vision.
1.2 Contributions of dissertation
This dissertation studies the optimization of the PWM LED lighting. The major contributions to this technology are as flow:
a. PWM LED driving for human vision
Traditionally, LED lighting design use 1 kHz frequency to driving, most LED driving research was not discussed human vision factor. This dissertation conducted a literature review of the psychological of human eyes; the theory could be use in lighting design had been collated. Based on human eyes psychological, could design the most suitable lighting for human use.
b. PWM LED driving for machine vision
Machine vision is similar human vision but characteristic is determined by the designers. In the past research, also rarely mention the brightness under different frequency response. This dissertation proposes experiments to inspect different frequency response, and a method of correction.
1.3 An overview of the dissertation
This dissertation is mainly concerned with the program of how to design a suitable PWM driven parameter to fit a lighting system for human vision and machine vision. In chapter 1, introduce motivation and contributions.
In chapter 2, discussed LED dimming method, and several simple PWM generator.
Chapter 3 discussed the characteristics of human vison and machine vision based on LED lighting system. This characteristic could help design experiment, to optimize the parameter for lighting system.
Use a PWM generator and lighting box to simulates an indoor lighting, experiment result shows the observer feeling in different driven parameter, flicker lighting sense, what frequency flicker sense disappear, stable lighting sense in different duty. Experiment result could design the optimized flicker lighting and stable lighting. To coincide with experiment design of data logger has been designed, in addition to the PC software has been designed.
Chapter 5 describes the LED lighting linearity experiment. Because in some of the early experiments have shown that LED lighting under different frequencies can be not equal intensity of brightness. Via the data logger operation experiment device control experiment operation, we can get a set of parameters, and find the most conforms to duty and intensity of brightness of a linear relationship between the driving frequencies. Finally, a brief conclusion and discussion about future study in chapter 6 ends this dissertation.
Chapter 2 The Pulse-width modulation LED dimming
A lot of circuits and methods have been designed for LED dimming, such as control voltage or control current. The brightness of LED be affected by current through, but the ration of voltage and current is a very high slop line in LED. If we want to control brightness of LED by voltage, the range of voltage regulation will be very small. For example, normal White-light LED working voltage is between 3.0 volt and 3.5 volt, voltage adjust brightness range only 0.5 volt. This voltage range circuit is not easy been design. In addition, some mistake happened or voltage wave over the range, maybe the LED has burn. So, mostly brightness adjust design is use current control, the pulse-width modulation is one of the excellent current control methods now.
The pulse-width modulation is referred to as PWM, it different with analog adjust, use a continuous signal to switch turn on or off, can control the ratio of energy output. The PWM method has been use in many devices, including the incandescent light bulb dimming. Part of the motor speed regulation is accomplished by PWM.
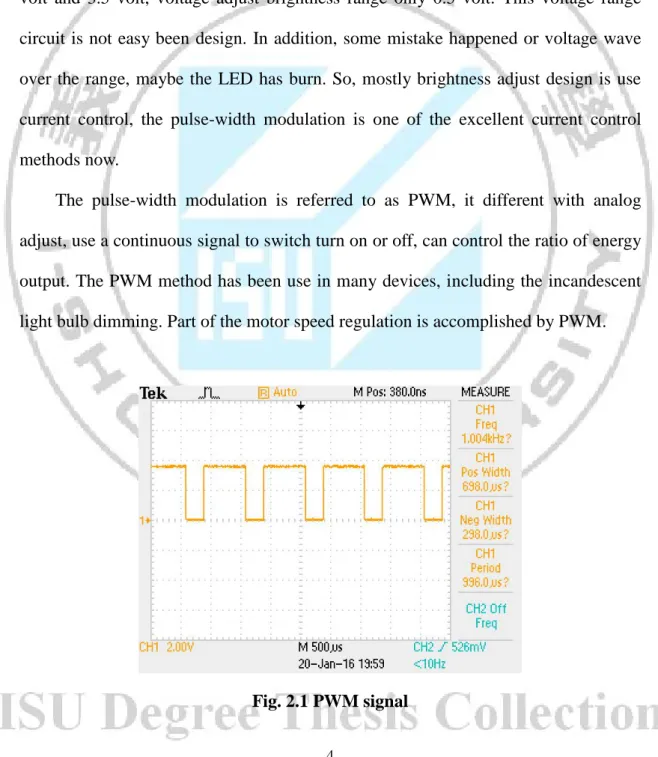
As Fig. 2.1, the PWM is a periodic square wave. In the figure, duty on time is 698 micro second and duty off time is 298 micro second, period is 996 micro second and frequency is 1 KHz. In this PWM signal, frequency is 1 KHz, duty cycle is 70%.
The duty on time means energy has been sent, duty off time means no energy. PWM generator always connected to a switch circuits, mostly is transistor. The duty on time and off time determines the driver object operation situation, must be designed based on the characteristics of the device. In past, PWM has been use in fluorescent lamps dimming and metal halide lamp dimming, in recent years has also been a lot of use in LED dimming.
The following describes the generation of PWM method.
2.1 PWM generator based on the 555 timer
PWM generation, it is necessary to use a base frequency as a duty cycle minimum units, usually with the duty cycle of 1% as a minimum. The 555 timer IC has been use in mostly design of PWM generator; it as long as through the appropriate frequency clock input, circuit can generate the appropriate PWM signal.
Fig. 2.2 The 555 timer PWM circuit [1]
“BD139” is output driver to switch the “LOAD” turn on and off. In our experiment, the “LOAD” is LED lamp. This circuit could generate a signal, frequency is 144 Hz and duty cycle from 95% to 5%, duty cycle could be adjusted by the resistor “100K”. But this kind of circuit design, the signal frequency is fixed, and duty cycle, and duty cycle adjustment cannot be 100%. So, this design could be used in fixed frequency object. We can't use it to do experiments of different frequency.
2.2 PWM generator based on micro controller
In order to design PWM generator that frequency and duty cycle could be adjust, we use a programmable micro controller (MCU) to make it. Using MCU to produce PWM generator, there are usually two ways, one is a software to simulate the other is direct use of hardware. The software methods describes briefly as follow.
Software method
When the MCU hardware resource not enough, we use a timer and some program to generate signal. The program as follow:
As the program shows, put a counter program in timer interrupt function. The “pwm_cont1” and “pwm_cont2” indicates the PWM channel 1 and channel 2 minimum duty cycle, the “dutys[1]” and “dutys[2]” indicates the PWM duty cycle turn on time, the “dutyf[1]” and “dutyf[2]” indicates the PWM period. When time interrupt happened, the “pwm_cont1” and
Void Timer_Interrupt(void) { pwm_cont1++; if(pwm_cont1<=dutys[1]){PWM1=1;}else{PWM1=0;} if(pwm_cont1>dutyf[1]){pwm_cont1=0;} pwm_cont2++; if(pwm_cont2<=dutys[2]){PWM2=1;}else{PWM2=0;} if(pwm_cont2>dutyf[2]){pwm_cont2=0;} }
“pwm_cont1” will add one, then, check whether the count is greater than duty cycle time, MCU output pin based on the duty cycle time to do the actions.
In this example, if the interrupt time is 10-4 second than the 1% duty cycle time will be 10-4 second, 100% duty cycle the period will be 10-2 second. PWM frequency will be 100 Hz.
Software simulation method is seriously limited by the speed of the MCU, because program execution need some times, this execution times usually make the time error. So, this method cannot use in high-speed PWM. In our experiment, software methods could generate signal that the highest frequency is 2 KHz. If the MCU built-in PWM hardware or the timer can operate in the PWM mode, the problem will not happened as above.
2.3 Summary
This chapter describes the concept of PWM and the producing method, producing method will be used in the LED lighting experiments. Normal, we will use frequency controlled PWM generator to complete the necessary after the experiment, using 555 IC to make fixed frequency PWM to use.
The PWM parameter, frequency and duty cycle driving in LED lighting, is our research target. What kind of frequency and duty cycle is most suitable for human vision, will be discussed in the next chapter
Chapter 3 The characteristic of vision
The psychophysics of vision provided a lot of information that had valuable medical clinical applications—primarily in providing methods and theory used for pathological examination. This chapter will break down the theory behind the psychophysics of vision with a focus on those theories which focus on normal visual phenomena.
3.1 The characteristic of human vision
The theory will then be applied to lighting system optimization. A human observer watching a periodic light source will have three different sensations depending on the frequency of the light: flicker, stable lighting, and flicker fusion—which is a frequency between flicker and stable lighting. These three frequency responses are the most important elements influencing lighting design. Each of the three will be discussed in greater detail below.
In time domain, based on Persistence of vision, Bloch’s Law describes the vision experience stimulated by a periodically glitter, while the Broca-Sulzer Law describes the vision experience stimulated by a non-periodically glitter. Ferry-Porter Law describes what frequency will not feeling flicker. Talbot-Plateau Law describes after the disappearance of perception of light flashes response. The Contrast Sensitivity deals with spatial and temporal domain vision experience.
Persistence of vision
Image or light appears and disappears repeatedly, if repeatedly frequency greater than the threshold will not feel flicker, feel image or light are continuous. This effect is widely used in movie, TV and lighting system. The experimental results of Arthur C. Hardy; red light presence of fovea is 0.0209 second; yellow-green light presence of
fovea is 0.0179 second; blue-violt light presence of fovea is 0.0349 second. Conclusion is light stay time between 0.04 second to 0.028 second [2]. So set the frequency between 25 hertz to 35 hertz or more, human eye will not feel flicker, this is also the film, television, etc. The origin of the frame rate set. But, driving frequency 35 Hz, in brighter light background will feel the flicker, and therefore the lighting system in order to apply to the extent possible, to really increase the frequency to twice the power frequency.
The Persistence of vision is only a crude simple experimental result, indicate more than threshold frequency will not feel flicker. With the subsequent development of ophthalmic medical research, the Persistence of vision phenomenon has been insufficient, research methods on the update, and only by Persistence of vision phenomenon to study parameters of PWM technique is no longer used.
Bloch’s Law
To discuss flicker behavior, first is what vision response, when flicker from appeared to disappear. It was found that in the past, used a enough light stimulation, observer will feel a certain degree of brightness; if used half stimulation, then observer will feel a half degree of brightness. If want to feel the same brightness, then the lighting duration time need used double times. Such as photographic film as the process, if the external light intensity is not enough, then you need increase the exposure time. This process is called temporal summation. Bloch’s Law [3] proposed a simple formula:
Bt = k (3.1) In Eq (3.1), flash light strength is B, duration time is t, and the product k keeps in constant. In other words, the flash time with energy is a constant relationship. In addition, Bloch’s Law describes the shorter the stimulus duration time, the stronger
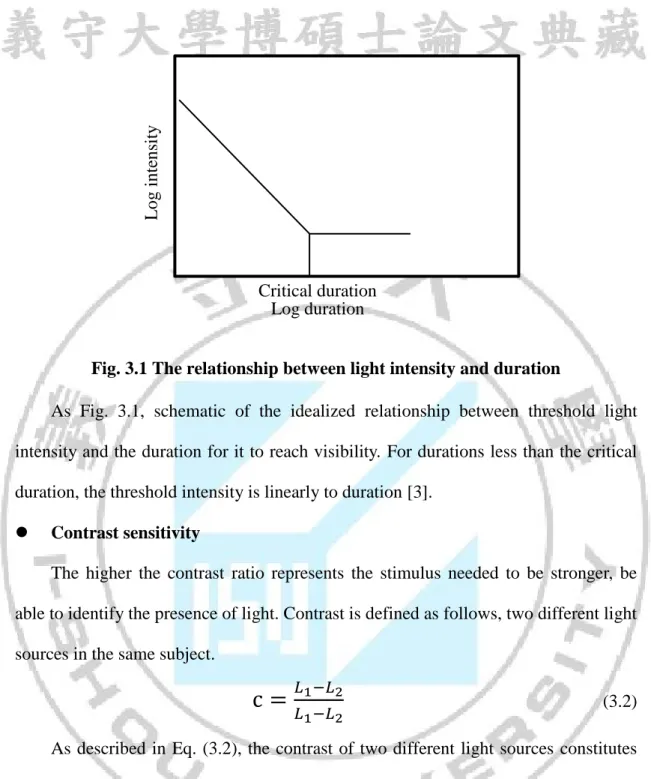
Fig. 3.1 The relationship between light intensity and duration
As Fig. 3.1, schematic of the idealized relationship between threshold light intensity and the duration for it to reach visibility. For durations less than the critical duration, the threshold intensity is linearly to duration [3].
Contrast sensitivity
The higher the contrast ratio represents the stimulus needed to be stronger, be able to identify the presence of light. Contrast is defined as follows, two different light sources in the same subject.
c =
𝐿1−𝐿2𝐿1−𝐿2 (3.2)
As described in Eq. (3.2), the contrast of two different light sources constitutes the average luminance [4], the test area in the flash brightness is (𝐿1 ), the background brightness is (𝐿2 ). The range of C is between 0.0 and 1.0, representing different size ratio between two light sources, if the brightness difference between the background and the light be greater, then the C value will be greater.
Experiments are done by Andrei Gorea, and the results said that when the duration time in 10ms or less, the required contrast of 0.5, while the duration time more than 50ms, the required contrast will be reduced to 0.1 [5]. The duration time of
L
og inte
nsity
Critical duration Log duration
PWM operation is often less than 50ms, so the light source must be designed to select the contrast of 0.5 or more.
Broca-Sulzer Law
This theorem is also under study in the vision response to flash phenomenon. Different points are when light indubitable, what response of vision will be. This experiment is to find the vision response using difference duration time, taken between 50 milli-second to 200 milli-second. When flash appeared, vision will reaction quickly, but this time there will be a perception of stimuli beyond the actual weighting, drop to reflect the actual brightness.
Fig. 3.2 Brightness and stimulus time [6]
As Broca and Sulzer experimental results show in Fig. 3.2, on dark background, the highest response in 0.046 second if the stimulus brightness used 170 lux, if the stimulus brightness is 126 lux then the highest response in 0.062 second. It should be noted that when the flash duration time when more than 0.125 second effect will be
substantially weakened. If more than 0.5 second, Broca-Suzler effect will not exist. Ferry-Porter Law
When the flicker frequency keeps increasing, flashes phenomenon will gradually disappear. Such as persistence of vision happened in 35 hertz, when flashes of feeling disappeared, at this time enter the flicker fusion. This frequency point called flicker fusion frequency. Also called critical flicker fusion (CFF) frequency, because the sense is feeling flicker or not flicker. Ferry-Porter [7] [8] found that high stimulus intensity will increases CFF. Experiment done by Tyler and Hamer, the difference between stimulus intensity and background intensity increase, will enhance the relative CFF [9]. A formula has been proposed:
CFF = A log L + B (3.3) As Eq. 3.3, A and B is environment brightness, L is lighting flicker stimulus intensity.
Fig. 3.3 CFF scatter diagram [10]
CFF. So when the needs of different lighting design, has different CFF. Usually when the lighting environment, the greater the contrast with the background, the higher is required to CFF, which explains why people read high-frequency lamps will be comfortable.
Talbot-Plateau Law
When the driven frequency increases above the CFF frequency—the time when flicker fusion occurs—the Talbot-Plateau Law begins to be seen. As vision continued to be stimulated by flashing light, increasing frequencies caused the flicker sense to gradually disappear. As a result, the sense of brightness will fall into an average state. This phenomenon is also a temporal summation. For example, in a PWM lighting system with the driver duty set at 50%, the sense of brightness will be equivalent to 50% of a DC driven system. It is noteworthy that when the gap between two different duty values is small, the human observer could not distinguish the differences in brightness. In their research, Hsien-Liang Liu and J-J Junz Wang, at 1KHz driven, duty difference of 20% cannot be distinguished [11]. Experiment by Masafumi JINNO, duty difference of 5% cannot be distinguished [12].
In previous research on stable lighting, the exact frequencies at which the sense of brightness will fall into a stable state were not identified. Our early experiments indicate that stable state vision is also affected by environmental brightness.
3.2 The characteristic of machine vision
Machine vision is basically to mimic human vision, with a similar structure. Machine vision and human vision have same lens, imaging system, and the imaging system passing information to the signal processing system. Same as the human visual, for lighting also have three state, flicker - flicker fusion – stable. But, this characteristic
For example, the web cam frame rate is 27 fps (frames per second), namely take 27 images per second for processing system. If the lighting PWM frequency over 54 Hz, image won't appear flicker. But the actual intensity of illumination, enters the lens is affected by various such as environment, Angle and so on, this characteristic also similar to human vision. In order to avoid the flicker, and therefore most of the machine vision with light source PWM are set in more than 1 KHz.
In low light, restricted to the cost of a lens, human vision resolution always better than machine vision, so for machine vision light source is usually stronger, will be greater than the human visual range.
Based on these features to design lighting experiment for machine vision, the first must eliminate flicker, then make stable and reliable. Finally control with linear degree of the light source.
3.3 Summary
As mentioned in the literature above, we can get some ideas to illumination experiment design:
Flicker experiments
Find the highest sensitivity frequency and duty, maybe appear in 5 Hz to 20Hz. What frequency no flicker-CFF experiment.
How brightness different could not be distinguish.
Check the LED brightness linearity under different frequencies. We will explain the experiments at below chapter.
Chapter 4 The optimized PWM driving for the lighting
system based on human vision
This chapter describes lighting design based on human vision. In early literature review, we found that the visual reaction strongly affected by environment brightness change, so we simulate stable indoor environment, avoid too much change impact study.
4.1 Introduction
To find the best driving frequency, we need to connect the phenomenon of Psychophysics of vision and PWM control technique. Many researchers keep on working in this topic. In [13], the result shows that set frequency to 1000 hertz and duty equals to 60%, then the best luminescence efficiency of white LED will be obtained. In [11], they got the same effect as DC driving by setting frequency of PWM to 1K hertz, and the duty cycle equal to 80%.
These are important results. However, many physiological characteristics of human vision and environmental factor are been ignored. Besides, there is no exact theoretical basis to support the experimental result. After all, the lighting is for human vision. These parameters (frequency and duty) must be carefully studied based on human vision.
Based on the Psychophysics of vision and Broca-Sulzer effect, a WLED experiment was conduct by Masafumi JINNO. He concluded that the brightness can be doubled than that of DC driven when the WLED is driven by PWM pulse with frequency equal to 60 hertz and duty is 95%. A more detailed inspection was carried out and concluded that the use of blue LED brightness can be felt at 1.5 ~ 1.9 times, the
green LED is 2.0 ~ 2.2 times, the red LED is 1.0 ~ 1.3 times. Using this concluding remark, we can use a 50lm/W WLED to replace a 100lm/W WLED [12]. However, this method use a frequency near the flicker fusion frequency to driver LED, make the wrong impression to feeling a strong light sense, but still don’t know applicability in normal lighting system.
4.2 Experimental methods
In this section, we want to find the best drive methods in white-light LED PWM operation and verify the theory described in Section 3.1 for the suitability of white-light LED lighting.
The experiment we report does not work in a dark environment. The environment is not a completely dark room. The room often had a lot of external ambient light. For the above reasons, we design a realistic lighting environment and we aimed to find the operation range that works.
There are three main experiments that will be conducted. They are flicker, CFF and stable lighting experiments. Each will aim to find the greatest sensitivity, the flicker fusion frequency, and the best stable lighting operation.
Before discussing the three experiments methods, the experimental equipment will be briefly described.
4.2.1. Experimental equipment
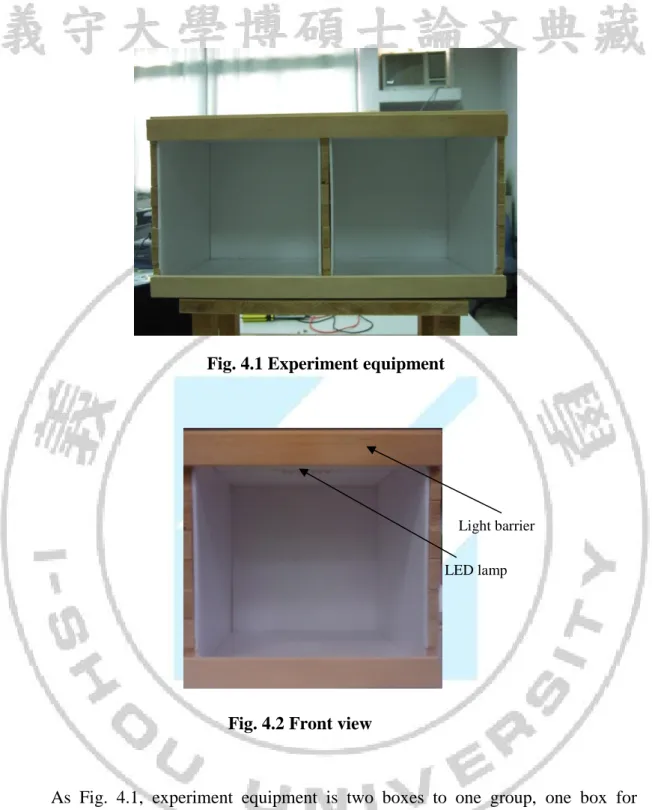
For the purposes of our experiments, we designed simple equipment which will allow us to observe the different drive methods in equipment and record the human vision senses. This equipment includes a box with one side opened and an LED light attached to the inner top side. The length and width of the box are equal. We pasted white paper inside the box to produce indirect lighting. This equipment is shown in Fig. 4.1, Fig. 4.2, Fig. 4.3 and Fig. 4.4.
Fig. 4.1 Experiment equipment
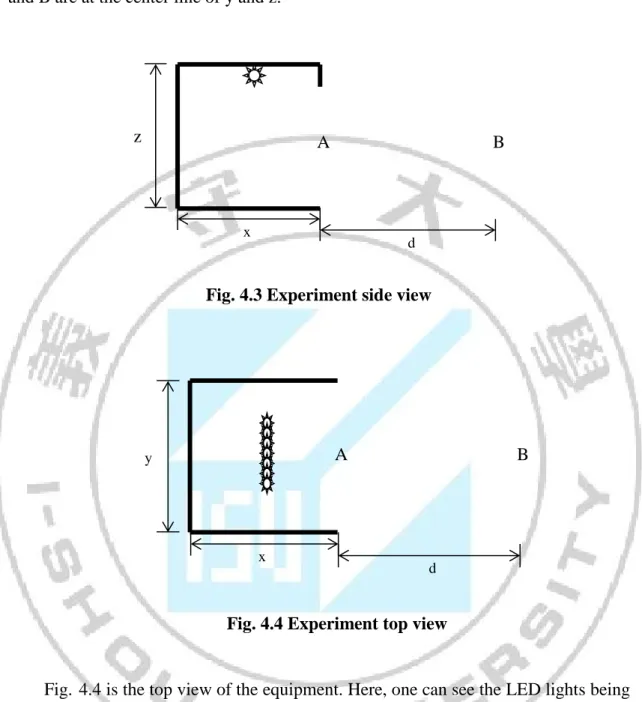
As Fig. 4.1, experiment equipment is two boxes to one group, one box for control group, other box for comparison group. Fig. 4.2 shows the one of box front view. Fig. 4.3 shows side view of the equipment. There is a light barrier attached to the light box so that observers do not look directly at the light source. The x, y and z variables indicate the length, width and height of the light box. Each of them is a length of 20cm. The A and B points indicate two observation points. Point A is at the edge of
LED lamp Light barrier
the light box and point B is at a 50cm distance (d) from the edge of light box. Both A and B are at the center line of y and z.
Fig. 4.4 is the top view of the equipment. Here, one can see the LED lights being used as the experiment light source. The LED lights are installed on the top center of the light box. The experiment light source is a row of seven white-light LED with a total length of 6.5cm and a width of 0.5cm. As Fig. 4.2, the low-angle shot was deliberately used in order to show the location of LED lamp. However, during the experiment, observers will look from a level angle so that the light barrier will prevent them from looking directly at the LED lamps.
A B
x
z
d
Fig. 4.3 Experiment side view
A B
x y
d
Fig. 4.5 Test method, equipment and observer
Most lighting systems operate indoors in a low light or no light environments. In order to consider the degree of impact of the light environment, the two observations points (A and B) will be used for comparison. As Fig.4.5, Z and X are 20 cm, d is 50 cm, observation point A represents low environmental impact and observation point B represents high environmental impact.
Prior to the experiment, measurements of the illumination (in lux meter) were taken at point A and point B. These measurements provide the basic data for the light environment and the no light environment.
Table 4.1 Environment (Lux)
The measurements can be found in Table 4.1 above. The eyes of the observer will detect the light phenomena at observation points A and B. Spatial frequency effects will
A B Lamp OFF LED OFF 0 3 Lamp ON LED OFF 100 142 Lamp OFF LED DC ON 780 20 Lamp ON LED DC ON 780 172 A B d X Z
In the test environment, the first environment (with interior lights) had a luminance of 142 lux. The second environment (without interior lights) had a luminance of 3 lux.
When the light is driven using a DC-source, the environment luminance is 780 Lux at point A. At point B, 50cm away from the light box, the measured luminance is 172 Lux as listed in Table 4.1.
4.2.2. Flicker experiments methods
In this experiment, we want to find the highest sensitivity for human vision in order to design optimal warning lighting systems. The purpose of flicker light is for warning rather than general purpose lighting. The experiments aim to find the best PWM parameters of frequency value and duty value which attract the attention of the human observer. The experiment methods are as follows:
a. Fixed duty, varied frequency to find the highest sensitivity frequency in different duty.
b. Based on highest sensitivity frequency, adjust duty to find the different intensities.
Because Broca-Sulzer Law and Bloch’s Law only discuss how lighting duty ON time affects sensitivity, never periodic lighting; the driven duty in the first experiment is set at 50% square-wave in order to find the highest sensitivity frequency. This frequency was then used to adjust duty and detect sensitivity. Based on how brightness affects sensitivity, we chose a fixed duty between 10% and 90%, and adjusted frequency while recording the visual senses of the observer. By doing this, we are able to find the highest sensitivity duty and corresponding frequency range.
4.2.3. CFF experiments methods
Before the stable lighting experiments, we must find the frequency at which the human eye no longer senses flicker. This experiment works for general lighting systems.
General lighting systems must provide stable light so that human vision is comfortable. The aim of this experiment is to find the highest CFF frequency.
First, a fixed duty between 10% and 90% was established; the frequency was adjusted, and the adjusted frequency at which the observer no longer sensed flicker was recorded. Because the brightness of the light environment also affected the CFF frequency, experiments had to be done in different light environments as shown in Table 1 above. The experiments only used one light box.
By using the highest CFF, we are able to make sure that the observer never senses flicker in stable lighting experiments.
4.2.4. Stable lighting experiments methods
In the stable lighting experiments, we want to find a method which could reduce the drive current without reducing light sense. Based on the results of the CFF frequency experiments, this can be achieved by using two times CFF value as the drive frequency in the light box and eliminating brightness effect. Under these circumstances, the observer will not detect any flicker. Once the flicker sense is eliminated, we used two sets of the same light box which were independently operated. The LED lamps in each box used different PWM operations. The duty value was adjusted slowly in order to compare the different results of two test boxes. The observer’s interactive responses were recorded and compared. The experiments show that the varying duty values could not be detected.
4.3 Results and discussion
The observers completed visual experiments and described their optical sensations. However, descriptions of sensations can be vague and difficult to quantify. Furthermore, different people reported different sensations. Of all the participants in our experiments,
gathering together all records of the observer’s reactions, it was found that variations in the responses were similar. To illustrate the results of our research, the responses of one observer will be given below as an example.
4.3.1. Flash experiments result
For the first experiment, the drive duty was fixed at 50% square-wave. The results showed that 17 Hz was the frequency of maximum sensitivity at observation point B. When the frequency was then fixed at 17 Hz, we found that the sensitivity will vary with duty change. When the duty varied between 10% and 90% while the frequency remained constant, we recorded the highest sensitivity. Based on the different frequencies that have the highest sensitivity in different duty ratios, we then combined the frequency of maximum sensitivity with other drive duties in order to find the best matching parameters.
Table 4.2, Table 4.3, Table 4.4 and Table 4.5 are experiments results. In the table, “Fluorescent ON” means indoor lighting turn on, representative with ambient light interference. Final column is results average value.
Table 4.2 Fluorescent ON, Observer at point A
01 02 03 04 05 06 07 08 09 10 11 12 Avg 10% 11 18 8 12 10 21 13 9 18 23 8 23 14.5 20% 13 22 9 12 9 19 9 4 15 11 5 23 12.5 30% 18 21 8 12 10 24 8 7 12 20 6 21 13.9 40% 18 21 8 11 9 18 7 9 9 19 7 16 12.6 50% 18 21 9 9 10 20 9 8 12 13 8 21 13.1 60% 18 18 11 13 10 20 6 13 13 13 7 20 13.5 70% 17 19 12 14 13 16 27 8 7 19 8 23 15.2 80% 14 15 10 14 12 25 24 8 11 25 8 20 15.5 90% 9 28 12 22 23 19 10 21 10 25 8 21 17.3
Table 4.3 Fluorescent ON, Observer at point B 01 02 03 04 05 06 07 08 09 10 11 12 Avg 10% 13 18 14 19 12 15 16 6 11 25 10 15 14.5 20% 18 14 10 14 11 12 8 9 13 23 10 15 13.0 30% 18 14 12 14 12 16 9 12 24 16 13 18 14.8 40% 18 12 12 16 12 12 10 14 8 23 10 14 13.4 50% 18 12 10 13 12 12 6 14 8 9 15 15 12.0 60% 17 22 8 16 13 22 9 12 18 20 18 18 16.0 70% 17 15 10 12 17 22 31 15 9 14 23 15 16.6 80% 17 10 11 7 13 14 26 12 9 12 18 18 13.9 90% 8 29 20 7 24 13 22 15 9 15 19 19 16.6
Table 4.4 Fluorescent OFF, Observer at point A
01 02 03 04 05 06 07 08 09 10 11 Avg 10% 7 8 10 12 21 13 4 9 6 4 12 9.6 20% 9 12 10 12 15 8 4 5 5 4 10 8.5 30% 11 16 12 12 16 8 7 9 5 5 9 10.0 40% 14 19 26 12 8 7 6 10 5 6 9 11.1 50% 12 15 16 11 10 11 8 16 4 5 11 10.8 60% 8 18 21 16 14 8 6 11 4 6 13 11.4 70% 15 21 30 15 16 10 6 9 5 6 17 13.6 80% 12 25 26 13 24 7 4 23 5 7 18 14.9 90% 22 23 26 25 24 6 4 8 8 10 19 15.9
Table 4.5 Fluorescent OFF, Observer at point B
01 02 03 04 05 06 07 08 09 10 11 Avg 10% 7 9 12 13 15 5 5 7 9 4 8 8.5 20% 8 7 7 13 15 7 7 7 6 7 7 8.2 30% 11 8 17 10 18 5 9 8 6 7 10 9.9 40% 10 19 29 9 8 11 7 7 5 8 8 11.0 50% 11 17 20 11 10 10 6 19 6 7 9 11.4 60% 7 21 25 15 15 8 7 11 5 12 12 12.5 70% 9 22 30 12 21 6 5 13 7 17 13 14.0 80% 12 12 26 19 18 7 6 11 5 6 14 12.3 90% 10 8 26 24 21 6 4 8 6 7 18 12.5
In Table 4.2 and Table 4.3, twelve observers have been done the flicker experiment in lighting ambient. In Table 4.4 and Table 4.5, eleven observers have been done the flicker experiment in no lighting ambient. Below is figure of results average based on the total number.
Fig. 4.6 High sensitivity frequency in lighting ON
Fig. 4.7 High sensitivity frequency in lighting OFF
0 2 4 6 8 10 12 14 16 18 20 10% 20% 30% 40% 50% 60% 70% 80% 90% Fr e q u e n cy (H z) Duty cycle Lightting A Lighting B 0.0 2.0 4.0 6.0 8.0 10.0 12.0 14.0 16.0 18.0 10% 20% 30% 40% 50% 60% 70% 80% 90% Fr e q u e n cy (H z) Duty cycle Dark-A Dark-B
Fig. 4.6 and Fig. 4.7 show the frequency of maximum sensitivity at different duties according to the results of our experiment. In Fig. 4.6, Lighting-A and Lighting-B refer to fluorescent light ON environments of observation points A and B. In Fig. 4.7, Dark-A and Dark-B refers to fluorescent light OFF environments for observation points A and B.
From the figure we can find that the highest sensitivity range is between 7Hz to 18Hz. However, under different duty values we can find that when comparing any two different sets of high sensitivity frequencies, the intensity will differ. In order to find the highest sensitivity duty cycle, use the observer’s highest frequency. These experiments only use one light box at observation point B. The term Lighting refers to the fluorescent lights turned ON while the term Dark refers to the fluorescent lights turned OFF. Observers adjust duty cycle themselves to find highest sensitivity. The results are shown in Table 4.6.
Table 4.6 The highset sensitivity duty cycle
01 02 03 04 05 06 07 08 09 10 11 12 Avg Lighting 49% 43% 50% 45% 51% 55% 50% 47% 40% 45% 50% 40% 47% Dark 48% 45% 43% 48% 53% 57% 45% 45% 43% 48% 43% 47%
In Table 4.6, the observer 07 cannot afford fluorescent light turned off experiments, so the record is blank. Observer is the consensus of reaction, duty cycle after a 60% stimulus has fallen sharply. And turn off the light condition of stimulating degree is higher. After the experiment, we could find that the highest duty cycle located at between 40% and 50%.
The brightness increases as the duty increases, making it difficult to precisely identify the frequency of maximum sensitivity. In the second environment with the
fluorescent lights turned OFF, we found that duty values above 60% revealed the possible reasons for the nonlinear changes seen for Dark-A and Dark-B in Fig. 4.7 and Table 4.4 and Table 4.5 above. The results of our experiment showed that durations needed to be longer in the light OFF environment (0.022 seconds to 0.035 seconds) than they were in the light ON environment in order to produce maximum sensitivity.
Taking all the findings of our experiments together, we have concluded that the ideal parameters for a lighting system in an environment with no extra light are 7Hz to 18Hz frequency with 40% to 50% duty. These parameters will produce the strongest sensitivity. The sensitivity at observation point A was higher than that at observation point B. This held true even in a bright light environment, however, the overall sensation decreased. This shows that ambient light reduces the contrast ratio and, thereby, the overall sensitivity. Under these conditions, increasing the duty will not enhance sensitivity.
4.3.2. CFF experiments result
In the CFF experiments, we use a similar approach as we used in the flicker experiments. Because of the ways brightness impacted the CFF frequency, duty must be different and frequency points must be adjusted.
Table 4.7 Fluorescent ON, Observer at point A
01 02 03 04 05 06 07 08 09 10 11 12 Avg 10% 67 62 61 48 47 68 51 56 52 59 61 72 58.7 20% 60 70 67 52 49 70 54 60 51 63 64 78 61.5 30% 66 67 70 53 54 72 54 66 50 62 63 79 63.0 40% 67 63 68 54 57 76 51 68 50 61 64 75 62.8 50% 67 75 68 55 57 73 56 67 49 63 65 78 64.4 60% 65 54 65 57 57 72 55 70 52 62 62 78 62.4 70% 63 75 65 55 54 67 51 68 51 61 58 75 61.9 80% 55 58 60 54 53 66 49 63 50 60 55 75 58.2 90% 47 55 58 51 51 58 48 59 45 54 52 69 53.9
Table 4.8 Fluorescent ON, Observer at point B 01 02 03 04 05 06 07 08 09 10 11 12 Avg 10% 61 64 61 49 48 63 45 55 56 58 53 70 56.9 20% 57 62 67 51 51 70 52 56 52 61 58 73 59.2 30% 60 62 74 54 54 75 49 60 53 60 59 70 60.8 40% 60 70 70 55 57 74 51 70 53 61 55 73 62.4 50% 58 65 68 54 57 74 50 57 55 59 54 75 60.5 60% 55 59 65 57 57 75 47 60 55 60 50 76 59.7 70% 57 63 68 56 54 63 49 68 50 58 45 68 58.3 80% 53 57 61 52 53 60 48 59 51 54 41 68 54.8 90% 48 57 58 48 51 59 44 52 48 50 45 62 51.8
Table 4.9 Fluorescent OFF, Observer at point A
01 02 03 04 05 06 07 08 09 10 11 12 Avg 10% 61 67 55 51 51 67 43 62 52 58 62 75 58.7 20% 68 72 58 54 55 69 51 70 49 65 68 76 62.9 30% 66 73 66 54 55 72 61 76 50 64 65 75 64.8 40% 67 72 64 56 57 72 59 75 51 65 64 78 65.0 50% 66 75 62 55 57 70 57 69 53 65 63 79 64.3 60% 65 67 62 54 54 70 55 70 55 63 62 82 63.3 70% 65 70 62 54 47 65 52 72 52 61 61 75 61.3 80% 61 65 61 54 54 63 51 67 50 60 58 75 59.9 90% 50 55 57 51 48 60 48 61 47 51 50 67 53.8
Table 4.10 Fluorescent OFF, Observer at point B
01 02 03 04 05 06 07 08 09 10 11 12 Avg 10% 57 61 56 51 51 68 41 58 53 61 56 67 56.7 20% 65 65 60 54 55 70 44 60 54 68 60 72 60.6 30% 59 67 66 55 55 69 51 66 52 67 61 72 61.7 40% 63 67 64 55 57 67 56 68 53 66 60 69 62.1 50% 58 67 65 53 57 67 54 68 54 67 57 69 61.3 60% 60 61 62 51 54 67 47 66 57 67 56 72 60.0 70% 59 67 64 53 48 65 51 65 54 62 55 68 59.3 80% 58 63 61 52 54 60 49 63 52 57 51 67 57.3 90% 55 54 57 47 48 55 46 53 52 55 40 67 52.4
Points A and B indicate different observation positions. The frequency value at which the observer no longer sensed the flicker was recorded. The same procedures were done in ON and OFF light environment.
Fig. 4.8 CFF in lighting on
Fig. 4.9 CFF in lighting off
The results are shown in Table 4.7, Table 4.8, Table 4.9 and Table 4.10. Twelve observers have been done the CFF experiment. The average of results has drawn in Fig. 4.8 and Fig. 4.9. In Fig. 4.8, the Lighting-A and Lighting-B indicate observation
0 10 20 30 40 50 60 70 10% 20% 30% 40% 50% 60% 70% 80% 90% Fr e q u e n cy (H z) Duty cycle Lighting-A Lighting-B 0 10 20 30 40 50 60 70 10% 20% 30% 40% 50% 60% 70% 80% 90% Fr e q u e n cy (H z) Duty cycle Dark-A Dark-B
points A and B in the ON light environment. In Fig. 4.9, the Dark-A and Dark-B indicate observation points A and B in the OFF light environment.
From these results, we found that when the duty value is at 50%, the CFF frequency in the ON light environment was 58Hz to 67Hz. However, in the OFF light environment, the CFF value increased to between 65 Hz and 72 Hz. When the luminance difference between the light environment and LED lamps was increased, the CFF value increased as well. When the duty value was increased, the CFF value decreased.
Our findings also showed that when observers were at observation point A, the inner edge of the area flickered slightly when the flicker frequency increased. This flickering effect was still observed even when the frequency was increased to no flicker. In Fig. 4.8 and Fig. 4.9, could see how the brightness of the environment affects the CFF value. In a real environment, the human eye senses stronger brightness when it is closer to the light source. When the eye is further from the light source, the sense of brightness is weaker. Thus, the CFF value recorded at short distances will not hold true for longer distances.
The results indicate that the highest CFF value is 75Hz. In some cases where the frequency was close to the CFF value, the observer still reported seeing some flicker in the corners of the light box. This may be due to the fact that the corners are furthest away from the light source so that the decreased brightness allowed for the eye to sense the flicker. This condition replicates the standard lighting found in most rooms where the intensity of illumination distribution is not uniform. In such conditions, the frequency would need to be 150Hz or at least double the CFF value (75Hz) in order to guarantee that no flicker is sensed anywhere in the room.
4.3.3. Stable lighting experiments result
Based on the Talbot-Plateau Law and Bloch's Law, the energy intensity will determine light sensation. That is, the different duty values correspond to the differential senses of brightness. Preliminary experiments have found that slight differences are not accurately sensed by the human eye and this inaccuracy may be used to develop more energy efficient lighting designs. In this subsection, we will discuss just how much the duty value can differ without any effect on human vision.
First, the driving frequency was increased to 150Hz for the operation. This is double the maximum value of CFF. Then, one light box was used for a control group while the second light box was used for the comparison group. The duty was adjusted to find the perceived brightness of the control group which was positioned in observation point B (50cm from the box).
Table 4.11 Duty different in Fluorescent ON
01 02 03 04 05 06 07 08 09 10 11 12 13 14 Avg 10% 2 1 1 3 1 0 1 0 0 0 0 0 0 1 1 20% 2 3 1 5 1 1 1 0 1 1 1 3 3 1 0 30% 4 2 4 9 0 0 2 1 4 4 5 0 0 4 0 40% 2 2 6 9 0 0 4 6 2 2 6 2 4 5 1 50% 4 2 3 8 2 5 3 1 5 4 5 9 4 4 1 60% 2 2 5 9 1 1 8 5 3 17 15 9 2 7 3 70% 2 1 5 4 0 3 16 2 10 1 9 3 5 17 5 80% 1 6 2 1 2 0 16 2 17 9 18 12 2 4 6 90% 5 4 8 6 5 8 21 1 6 15 20 23 7 4 9 100% 5 6 6 7 1 16 13 8 7 11 13 21 12 3 9
Table 4.12 Duty different in Fluorescent OFF 01 02 03 04 05 06 07 08 09 10 11 12 13 14 Avg 10% 2 0 2 3 1 0 0 0 1 1 1 0 1 1 1 20% 2 3 8 5 0 2 2 1 1 0 0 2 1 2 1 30% 1 3 1 1 3 2 3 5 1 1 0 4 4 6 2 40% 5 1 6 4 3 3 3 2 2 4 7 7 1 1 2 50% 4 1 7 2 0 2 1 6 3 5 6 3 1 9 2 60% 2 6 1 1 2 0 7 2 18 6 5 7 3 7 5 70% 12 3 12 9 5 0 15 2 17 8 9 9 0 14 7 80% 13 4 10 2 2 1 16 1 9 19 7 17 10 19 9 90% 10 8 8 5 6 10 6 4 10 3 16 15 4 8 8 100% 19 0 5 2 5 6 15 11 7 23 6 11 5 14 10
The duty difference refers to the absolute value of the duty for the control group minus the absolute value of the duty for the control group. Thus, if the duty value for the control group was 40% and the duty for the comparison group was 37%, then the duty difference would be 3%. Table 4.11 and Table 4.12 are experiments results.
Fig. 4.10 Duty difference
The results are shown in Fig. 4.10. From Fig. 4.10, we can see that when the duty
0 1 2 3 4 5 6 7 8 9 10 10% 20% 30% 40% 50% 60% 70% 80% 90% 100% D u ty d iff e re n ce ( % ) Duty cycle Lighting Dark
when the duty value is larger, our eyes have more difficulty detecting the change in duty value. In the light ON environment (Lighting), the brightness was 142 Lux. When the duty value for the control group was 70% or higher, it became more difficult to identify the comparison group. In the light OFF environment (Dark), the curve becomes nonlinear when the duty value goes above 70%. This shows that when lighting becomes too bright, the senses will be saturated.
In the light ON environment, increasing the duty value within a 5% range could not be detected. Thus, when the greater the difference between the light environment and the lighting system, the more difficult it is for the human eye to detect slight changes in duty value.
In observation point A, the impact of the external light environment is reduced. When observers were positioned in this point, we increased the duty value slowly until the observer reported a change in brightness. We then recorded the duty value at which the change in brightness was noticed. When the duty value was between 10% and 30%, changes of up to 2% could occur undetected. When the duty value was between 40% and 60%, changes of up to 5% could occur undetected. When the duty value was between 70% and 100%, changes of up to 10% could occur undetected. The results were the same in both the light ON environment and the light OFF environment.
In order to study frequency, we fixed the duty value to be the same value for both the control group and the comparison group. We then adjusted the frequency for the comparison group. When we studied duty, we fixed the frequency to be the same frequency for both the control group and the compassion group. We then adjusted the duty value for the comparison group. When the frequency was set above the maximum CFF (75Hz) so that flicker fusion can occur, the sense of brightness is related only to the duty value and not to the frequency.
LED lighting system differ greatly, it becomes easier for the human eye to detect slight changes in duty value. When the duty is fixed and the frequency varies, there is no change in the sense of brightness. Thus the lux meter value shows that when duty is increased, brightness is increased as well.
4.3.4. Compare experimental results
Prior experiments were conducted with no background light. However, with actual lighting systems, the impact of background light plays a key role. Our research found that when the difference in brightness between the lighting system and background light is very small, many effects will be reduced. Thus, in order to really take advantage of these effects and create more efficient lighting systems, the lighting system brightness must differ greatly from the background light brightness. Our results confirm this point.
The ability of the human eye to identify different brightness levels grows weaker as the brightness grows stronger. For example, if the difference in brightness between the lighting systems and the background light is 80Lux, then a change in brightness from 400Lux to 500Lux would be difficult to identify while a change in brightness from 120Lux to 200Lux is easy to identify.
4.4 Summary
To design effective warning lights, we use the Broca-Sulzer law in order to achieve the effect of the perceived brightness increasing and to increase the sensitivity to the light via continuous flickering. These two factors will improve the effectiveness of warning lights. Thus, we propose that the frequency be set between 7Hz and 18Hz because maximum sensitivity can vary greatly among individuals. We also propose that the brightness of the warning light should be much brighter than the light environment
40% and 50% or higher if the light environment is brighter.
In general lighting systems, the frequency should be set at a higher frequency than the maximum CFF value in order to reach flicker fusion. The flicker fusion frequency is different for each person so increasing the frequency above 150 Hz will ensure that all sense of flicker is gone. Setting the frequency this high will help to increase the brightness because the brightness of the light environment affects the ability of the eye to detect changes in duty value. When the environment is very bright, it is difficult for the eye to detect changes in duty value.
In order to maximize the efficiency of warning lights and general lighting systems, we must consider the effects of background brightness or light environments because this affects the ability of the eye to detect changes in duty value. Our research found that when the luminance was above 500 Lux, the senses became saturated and the light became ineffective. When the luminance was within the range of 300 to 500 Lux, changes in duty up to 5% could not be detected. When the luminance was below 250 Lux, changes in duty up to 2% could not be detected.
Chapter 5 The optimized PWM driving for the lighting
system based on machine vision
In early experiments, LED lighting driven in PWM, we found brightness is not linearly. This chapter discussed the LED brightness linearity.
Lighting is a very important part in automated optical inspection (AOI) system or automated visual inspection (AVI) system. Developing an AVI system using multiple light sources, such as point light sources with various angles, intensities, color temperatures, and even circular illumination, may facilitate solving this critical problem [14]. In the past, the mostly lighting is fluorescent light [15], and used some optical element to change spectrum or color temperature. With the development of LED lighting technology, monochrome LED also gradually into the AOI has been applied [16].
For AOI lighting needs, to be able to control the brightness, even multi-color combined to control the color temperature. LED lighting control methods, such as DC voltage control, current control and PWM operation. To control LED brightness, the most direct rule is to control the current. We had use strobe lighting element to fixed LED current, and micro controller (MCU) components to control brightness in AOI system [17]. Now, PWM operation is the most easy to control the stability of the current method [18] [19].
LED PWM lighting has been use in AOI system, driven method different with human lighting, for human used the PWM frequency is between 100Hz and 1 KHz [20], as long as frequency doesn't make the human feel flicker. The lighting frequency of AOI system must be able to fit camera design, sometimes the lighting frequency is not between 100Hz and 1 KHz. The AOI system camera always operation in high
frequency, to avoid image fetch error the lighting frequency at least two times camera fetch frequency. Experiment shows, more than 100 Hz eye brightness sense are no difference for the change of frequency [21]. The driven frequency affect real brightness of LED was unknown. LED current affect optical intensity, current and optical intensity relation is not linearly [22]. In this paper, we discuss LED brightness reflected when driven frequency greater than 1 KHz.
5.1 Data logger with control
Due to the LED linearity test, must be multiple frequency multiple duty to experiment, there is a very repetitive and waste time. So we need a data logger to assist in the experiment. Much research has provided some good concepts and design. A. Belardineli and G. Palagi provided a concept; it is recorder transfer data to remote PC [23]. Rajesh Luharuka, Robert X. Gao used small volume but high storage space SPI-Flash chip complete a portable data logger [24]. Shlomo Engelberg and Tzvi Kaminsky provided a USB based and SD-card-disk data logger [25]. This section integrated the advantages of the above research to design a data logger machine. Earlier we have according to this framework for tried, using in low storage control system [26].
Cost/performance ratio is always a major market competitiveness consideration. For engineering, 8-bit MCU is generally a better choice for designing a data logger, although, speed and function are not well enough. Design a data logger for industry applications, three factors must keep in consideration, namely, function, size and cost. The function and performance of a PC-based data logger is well enough, but the size will kill its portability.
With the semiconductor technology progress and the development of free software, low cost high capacity data logger machine is coming true. In this paper we
present a portable data logger machine for use to any data need to record the occasion. Its advantages are high performance, small size, high storage capacity and easy use for any research or applications.
The MCU based data logger is small, portability and easy used, but it has some problem, such as record capacity space not enough and monitor too small, and the function can’t connect too much device. In order to solve these problems, we write program in PC, and use the RS-232 communication devices for data input and output. Because the mostly PC operation system is Microsoft Windows, so we used C program design Windows program for normal user.
5.1.1. Hardware
The hardware architecture of the proposed data logger machine is shown in Fig. 5.1. A STM32F103VET6 MCU functions as the main controller, the others are its peripheries, includes: USB, RS232, LCD, Keyboard, Flash, SD card, ADC,..etc.
As shown in Fig. 5.1 the hardware architecture is very simple. An embedded MCU, STM32F103VET6, which is a 32-bit ARM cortex-M3 core chip. This MCU provided by STMicroelectronics. To lower down the cost, the mostly used peripheries hardware such as: USB port, SPI interface, SD card interface, and RS232 interface all are integrated and built-in the MCU.
The USB is an interface for communication with PC, at PC side user will see a USB disk, didn’t need install any software could read any recorded data. The SPI Flash is a small storage media, size less than 32 mega bit which equal to 4 mega byte. SST25VF016B is chosen as a 16Mbits serial Flash memory chip. In some applications, recorded data is small, it will enough to use. If data huge, or record time is very long, then use SD card to prevent data lose. The RS232 is a classic serial interface, at MCU side also called UART, speed is lower than USB. But this interface is easy used to communicate with any low speed device. STM32 include three UART interface. We used UART1 to which communicates with PC will be a debug port from PC’s terminal software. Another two UART ports be the future development use.
As described above, this system only use standard socket to corresponding it. In addition, we use a low power LCD and three keys for human interface. This LCD is a graph LCM, which can either show texts or graphs. The three keys keyboard, two keys for select up or down, one key for enter. Finally, the “ADC or etc..” block means
STM32F103VET6 USB Socket RS232 Socket SPI Flash SD Card COG LCD 128*64 3-keys keyboard ADC or etc.. USB port UART TX&RX FSMC port
SPI SDIO Analog
port
Digital port
a outside analog information interface, maybe ECG circuit or some other sensors. Others outside digital information can be receiving from SPI, UART or other interface.
5.1.2. Software
Most functions of this machine completed by software. The functions have dual USB disk, file system, RS232 terminal function and a simple time-trigger system, will be explained in this section. In order to reduce cost, we didn’t use commerce compiler software, and follow CMSIS standards let the firmware and kernel are easily ported to another Cortex-M3 MCU.
Compiler. The free software is developed over 20 years, and the GNU C compiler
support embedded system software design is near 10 years, the mostly bugs are removed. Using GNU C to do embedded software design can be trusted. For embedded develop based on GNU tool chain, had many different version. Such as WinARM, CodeSourcery, Coocox. We choose CodeSourcery, because it still upgrade and include some library required by most engineers. CodeSourcery includes program and library as below:
Gnu C compiler for ARM Cortex-M3. cs-make for operation makefile.
Newlib 1.18, provided by RedHat, a C stand library for embedded system.
CodeSourcery has no editor, it is different from commerce software, must write makefile and loader script. The editor we choose Programmer's Notepad, it has simple project management function and multi-file edit function.
Dual USB Disk. This is the most difficult part of the whole system. USB
includes a lot complex communication behaviors, it is use software to complete all the
Fig. 5.2 USB application hierarchy [27]
memory.c memory.h (USB API) usb_scsi.h usb_scsi.c usb_bot.h usb_bot.c mass_mal.h mass_mal.c
memory chip API platform_config.h
hw_config.c hw_config.h
main.c

![Fig. 2.2 The 555 timer PWM circuit [1]](https://thumb-ap.123doks.com/thumbv2/9libinfo/8955912.276388/19.892.123.768.303.1048/fig-timer-pwm-circuit.webp)
![Fig. 3.2 Brightness and stimulus time [6]](https://thumb-ap.123doks.com/thumbv2/9libinfo/8955912.276388/25.892.129.768.302.964/fig-brightness-and-stimulus-time.webp)
![Fig. 3.3 CFF scatter diagram [10]](https://thumb-ap.123doks.com/thumbv2/9libinfo/8955912.276388/26.892.121.773.320.1037/fig-cff-scatter-diagram.webp)