488
Ann. N.Y. Acad. Sci. 1042: 488–496 (2005). © 2005 New York Academy of Sciences. doi: 10.1196/annals.1338.042
Human Lung Cells Using
1
H NMR
Spectroscopy
CHWEN-MING SHIH,a WUN-CHANG KO,b LIANG-YO YANG,c CHIEN-JU LIN,a,d JUI-SHENG WU,a,d TSUI-YUN LO,a
SHWU-HUEY WANG,a AND CHIEN-TSU CHENa
aDepartment of Biochemistry, Taipei Medical University, Taipei 110, Taiwan bGraduate Institute of Pharmacology, Taipei Medical University, Taipei 110, Taiwan cDepartment of Physiology, Taipei Medical University, Taipei 110, Taiwan
dGraduate Institute of Medical Science, Taipei Medical University, Taipei 110, Taiwan
ABSTRACT: This study aimed to detect apoptosis and necrosis in MRC-5, a nor-mal human lung cell line, by using noninvasive proton nuclear magnetic reso-nance (1H NMR). Live MRC-5 cells were processed first for 1H NMR spectroscopy; subsequently their types and the percentage of cell death were assessed on a flow cytometer. Cadmium (Cd) and mercury (Hg) induced apop-tosis and necrosis in MRC-5 cells, respectively, as revealed by phosphati-dylserine externalization on a flow cytometer. The spectral intensity ratio of methylene (CH2) resonance (at 1.3 ppm) to methyl (CH3) resonance (at 0.9
ppm) was directly proportional to the percentage of apoptosis and strongly and positively correlated with PI staining after Cd treatment (r2 = 0.9868, P < 0.01).
In contrast, this ratio only increased slightly within 2-h Hg treatment, and longer Hg exposure failed to produce further increase. Following 2-h Hg expo-sure, the spectral intensity of choline resonance (at 3.2 ppm) was abolished, but this phenomenon was absent in Cd-induced apoptosis. These findings together demonstrate that 1H NMR is a novel tool with a quantitative potential to dis-tinguish apoptosis from necrosis as early as the onset of cell death in normal human lung cells.
KEYWORDS: cadmium; mercury; apoptosis; necrosis; NMR
INTRODUCTION
When cells are exposed to cytotoxic agents, there are two major types of cell death: apoptosis and necrosis. Cell shrinkage, DNA damage, chromatin condensa-tion and blebbing of the plasma, and alteracondensa-tion of plasma membrane phospholipids organization with phosphatidylserine externalization are major characteristics of
Address for correspondence: Dr. Chien-Tsu Chen, Department of Biochemistry, School of Medicine, Taipei Medical University, 250 Wu-Hsing Street, Taipei, Taiwan 110, ROC.
Voice: +886-2-27361661 ext. 2400; fax: +886-2-27387348. [email protected]
apoptosis,1 whereas necrosis is generally characterized by swelling of cells and mi-tochondria, scattered chromatin condensation, and loss of plasma membrane integ-rity due to an overwhelmingly physical cell injury.2 Proton nuclear magnetic resonance spectroscopy (1H NMR) has been applied to study apoptotic cell death in vitro,3–10 and the onset of apoptosis revealed by 1H NMR is accompanied by an in-crease in the signal intensity of the membrane lipid methylene (CH2) resonance (at 1.3 ppm). In this study, we investigated whether 1H NMR can distinguish apoptosis from necrosis in normal human lung fibroblasts, MRC-5, triggered by cadmium (Cd) or mercury (Hg). Our results showed that 1H NMR could detect and quantify differ-ent degrees of apoptosis. These findings strongly suggest that 1H NMR has a great potential to become a noninvasive tool for detection of cell death in humans.
MATERIALS AND METHODS Cell Culture
MRC-5 cells, normal human fetal lung fibroblasts, were obtained from American Tissue Culture Collection (ATCC CCL-171) and grown at 37°C in Dulbecco’s Modified Eagle’s Medium (DMEM) supplemented with 10% heat-inactivated fetal bovine serum (FBS), 100 U/mL penicillin, and 100 mg/mL streptomycin (pH 7.4) in a humidified atmosphere containing 5% CO2. Because MRC-5 cells are normal human cells, all of the experiments were performed at 25–35 passages.
1H NMR Spectral Analysis
1H NMR spectroscopy was performed using methods published by Francis et al.4,5 In brief, 5 × 10⁷ MRC-5 cells were harvested and washed twice with D2
O-made PBS, suspended in a final volume of 500 µL, and placed immediately on ice until data acquisition. Samples were analyzed on a 500-MHz high-resolution Bruk-er spectrometBruk-er (BrukBruk-er; Karlsruhe, GBruk-ermany) with the following settings: pulse-acquire, 90° flip angle, repetition time 10 s, 64 or 128 excitations (depending on de-sired signal to noise), 8 k points, and 5-kHz bandwidth. A coaxial tube filled with trimethysialoproponic acid (TSP), 0.1% solution in D2O was used as reference
(0.0 ppm) for each experiment. The relative areas underneath the CH2 and methyl (CH3) resonances (at 1.3 and 0.9 ppm, respectively) were calculated by integration
of the proton spectrum using the trough between the CH2 and CH3 resonances as a baseline reference.
Measurement of Phosphatidylserine Externalization
Phosphatidylserine (PS) externalization was examined with a two-color analysis of FITC-labeled Annexin V binding and propidium iodine (PI) uptake using flow cy-tometry.11 For this analysis, 1 × 10⁶ MRC-5 cells were stained according to the man-ufacturer’s protocol (Annexin-VFLUOS staining kit, Roche, Mannheim, Germany) and analyzed on a Becton Dickinson (San Jose, CA) FACSCalibur flow cytometer. Cell debris, characterized by a low FSC/SSC, was excluded from analysis. Cells la-beled with FITC-Annexin V or PI were used to adjust the compensation. Data acqui-sition and analysis were performed using the CellQuest program (Becton
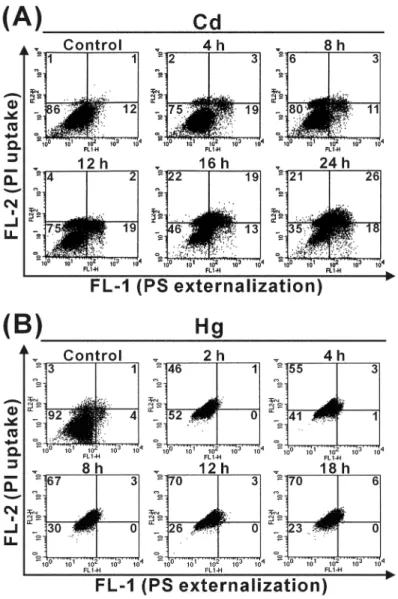
FIGURE 1. Time-course experiments of Cd-induced apoptosis and Hg-induced necro-sis in MRC-5 cells. MRC-5 cells were treated with 100 µM CdCl2 (panel A) or 100 µM HgCl2 (panel B) for the indicated time periods, collected, and stained with Annexin-V-FLUOS staining kit (Roche), and then immediately subjected to analysis of phosphati-dylserine externalization (FL-1 level of FITC-Annexin V fluorescence, X-axis) and PI up-take (FL-2 level of PI fluorescence, Y-axis) using flow cytometry. The Arabic number in each corner indicates the proportion of each quadrant. The cytogram of four quadrants was used to distinguish the normal, primary apoptotic, late apoptotic, and necrotic cells by the criteria of Annexin V−/PI−, Annexin V+/PI−, Annexin V+/PI+, and Annexin V−/PI+, respec-tively (see MATERIALS AND METHODS for details). The proportion of total apoptosis was
Dickinson). Positioning of quadrants on Annexin V/PI dot plots was performed as reported,12 and this method can be used to distinguish between living cells (Annexin V−/PI−), early apoptotic/primary apoptotic cells (Annexin V+/PI−), late apoptotic/ secondary necrotic cells (Annexin V+/PI+), and necrotic cells (Annexin V−/PI+).
FIGURE 2. 1H NMR spectra of Cd-treated MRC-5 cells. (A) MRC-5 cells were treated with 100 µM CdCl2 for the indicated time periods and resuspended in 90% D2O/PBS before measurement of 1H NMR spectra obtained at 500 MHz. The spectral resonances of choline pro-tons (-N(CH3)) at 3.2 ppm, methylene protons (-CH2-) at 1.3 ppm, and methyl protons (-CH3) at 0.9 ppm are indicated. The CH2/CH3 signal intensity ratios were 0.96, 1.21, 1.40, 1.70, and 2.02 at 0, 4, 12, 16, and 24 h after Cd exposure, respectively (B).
Determination of Hypodiploid DNA Content
To measure the loss of DNA, MRC-5 cells were harvested at 1 × 10⁶ cells/mL,
washed with PBS, and fixed in ice-cold 70% ethanol for 30 min at 4°C. After cen-trifugation, cells were resuspended, incubated in PBS containing 0.5 mg/mL RNase A and 40 µg/mL PI at room temperature for 30 min, and analyzed using a Becton Dickinson FACSCalibur flow cytometer as described by Ormerod et al.13 Cells with sub-G1 (hypodiploid DNA) PI incorporation were considered apoptotic. 13
RESULT AND DISCUSSION
Time Course of Cd- or Hg-Induced Cell Death in MRC-5 Cells
MRC-5 cells were incubated with 100 µM CdCl2 for 0, 2, 4, 8, 12, 16, and 24 h
or cultured with 100 µM HgCl2 for 0, 2, 4, 8, 12, and 18 h. To investigate the types of cell death induced by Cd or Hg, PS externalization and PI uptake in intact MRC-5 cells following Cd or Hg treatment were analyzed with a flow cytometer. FIGURE
1 is a dot plot of four quadrants scaled with logarithm as fluorescence level of FITC-labeled Annexin V (FL-1) and PI (FL-2), respectively. Cd-treated cells showed in-creased PS externalization with time elapsed (FIG. 1A), indicating that apoptosis was induced by Cd. In contrast, Hg-treated cells showed loss of plasma membrane integ-rity without PS externalization (FIG. 1B) which is a typical characteristic of necrosis.
1H NMR Spectral Analysis of Cd- and Hg-Treated MRC-5 Cells
MRC-5 cells were incubated with 100 µM CdCl2 and were harvested at 0, 4, 12, 16, and 24 h later. After resuspension in 90% D2O-made 1 × PBS, cells were
imme-diately processed for acquisition of the 1H NMR spectra that is shown in FIG. 2A. It
is worth noting that there was a progressive decrease in the choline signal (3.2 ppm) after Cd treatment. Most importantly, the CH2/CH3 signal intensity ratio increased from 0.96 (control) to 2.02 (at 24 h) (FIG. 2B).
Following incubation with 100 µM HgCl2 for 0, 2, 4, 12, 16, or 24 h, MRC-5 cells were processed for acquisition of the 1H NMR spectra. The CH2/CH3 signal
inten-sity ratio rose from 0.92 (control) to 1.31 within 2 h after Hg exposure and reached a plateau (FIG. 3B), which was different from the pattern induced by Cd. Crucially, unlike Cd treatment, Hg was unable to evoke the choline signal in MRC-5 cells mea-sured by 1H NMR (FIG. 3A). These data demonstrate that the 1H NMR can differen-tiate necrosis from apoptosis in MRC-5 cells treated with Hg or Cd, respectively, by differential CH2/CH3 signal intensity ratio and choline signal.
Correlation between the Hypodiploid DNA Content and CH2/CH3 Ratio To characterize the nuclear events, Cd-treated MRC-5 cells were assessed by hy-podiploid DNA assay (FIG. 4A). The percentage of cells with hypodiploid DNA
(de-noted by M1) (FIG. 4B) was similar to that of the cells undergoing apoptosis as revealed by the PS externalization assay showed in FIGURE 1. FIGURE 4C showed a
linear regression fit of the percentage of apoptosis versus the spectral intensity ratio of the CH2/CH3 (1.3/0.9 ppm) resonances. The percentage of apoptosis was highly
FIGURE 3. 1H NMR spectra of Hg-treated MRC-5 cells. (A) MRC-5 cells were treated with 100 µM HgCl2 for the indicated time periods and resuspended in 90% D2O/PBS before measurement of 1H NMR spectra obtained at 500 MHz. The spectral resonances of choline protons (-N(CH3)) at 3.2 ppm, methylene protons (-CH2-) at 1.3 ppm, and methyl protons (-CH3) at 0.9 ppm are indicated. (B) The CH2/CH3 signal intensity ratios were 0.92, 1.31, 1.43, 1.28, 1.41, and 1.31 at 0, 2, 4, 12, 16, and 24 h following Hg exposure, respectively. It is worth noting that the CH2/CH3 signal intensity ratios reached the plateau within 2 h after Hg treatment.
and positively correlated with the spectral intensity ratio of the CH2/CH3 with a very high correlation coefficient (r2 = 0.9868), suggesting that the simple spectral inten-sity ratio of the CH2/CH3 can be used to estimate the extent of apoptosis, a very com-plicated process.
Comparison of 1H NMR Spectra between Apoptosis and Necrosis
The 1H NMR spectra between apoptosis and necrosis induced by Cd and Hg, re-spectively, were compared as shown in FIGURE 5. Please note that the CH2/CH3
in-tensity ratio around 1.4 generated either by Cd (12 h)- or by Hg (4 h)-treatment is listed. The intensity of the CH3 resonance (0.9 ppm) increased in Cd-induced apop-tosis, but did not change in Hg-induced necrosis. The decrease in the choline inten-sity (3.2 ppm) was much more obvious in necrotic cell death than in apoptosis. Compared with the control, the resonances of apoptosis or necrosis in the region be-tween 3.4 and 3.9 ppm (consistent with myoinositol and ethanolamine) and the res-onances between 2.1 and 2.9 ppm (consistent with glutamine and glutamic acid) were either reduced distinctly or completely disappeared. Recently, a glioma study
FIGURE 4. Correlation between the hypodiploid DNA content and CH2/CH3 ratio in Cd-induced apoptosis. (A) MRC-5 cells were treated with 100 µM CdCl2 for the indicated time periods and then subjected to flow cytometric analysis with PI staining as described in MATERIALSAND METHODS. M1 was presented as the percentage of hypodiploid DNA in total DNA content, indicating the apoptotic percentage. Data presented in (A) are representative of three independent experiments. (B) The percentage of hypodiploid DNA content (denoted as M1) in Cd-induced MRC-5 apoptosis increased with time (**, P < 0.01) and data repre-sented mean ± SD. (C) The linear regression analysis showed a strong and positive correla-tion between the percentage of apoptosis and the CH2/CH3 (1.3/0.9 ppm) NMR spectral ratio in Cd-induced MRC-5 apoptosis.
model implicates the possibility for detection of the apoptotic tissue in vivo.14 Our current data are consistent with this earlier finding and strongly support the notion that 1H NMR might provide a simple and convenient method for distinguishing apo-ptosis from necrosis in vivo, which might have a significant impact on clinical application.
CONCLUSION
One of the most significant findings in this study is that the spectral intensity ratio of CH2/CH3 resonances measured by 1H NMR is highly and positively correlated with the percentage of apoptosis. Moreover, apoptosis and necrosis induced different
1H NMR spectral patterns. These findings together strongly suggest that 1H NMR is
an easy and reliable tool that can distinguish apoptosis from necrosis as early as the onset of cell death and support the idea that 1H NMR can be used to detect apoptosis and necrosis in vivo in the future.
ACKNOWLEDGMENTS
This work was supported by grants NSC 92-2320-B-038-055 and NSC 93-2320-B-038-055 (to C-M.S.) from the National Science Council, Taiwan, Republic of China.
FIGURE 5. Comparison of 1H NMR spectra of MRC-5 cells between Cd treatment and Hg treatment.
REFERENCES
1. ROBERTSON, J. D. & S. ORRENIUS. 2000. Molecular mechanisms of apoptosis induced
by cytotoxic chemicals. Crit. Rev. Toxicol. 30: 609–627.
2. NICOTERA, P. & M. LESIA. 1997. Energy supply and the shape of death in neuron and
lymphoid cells. Cell Death Differ. 4: 435–442.
3. MOYEC, L.L. et al. 1992. Cell and membrane lipid analysis by proton magnetic
reso-nance spectroscopy in five breast cancer cell lines. Br. J. Cancer 66: 623–628. 4. BLANKENBERG, F.G. et al. 1996. Detection of apoptosis cell death proton nuclear
mag-netic resonance spectroscopy. Blood 87: 1951–1956.
5. BLANKENBERG, F.G. et al. 1997. Quantitative analysis of apoptotic cell death using
pro-ton nuclear magnetic resonance spectroscopy. Blood 89: 3778–3786.
6. FERRETTI, A. et al. 1999. Biophysical and structural characterization of 1
H-NMR-detectable mobile lipid domains in NIH-3T3 fibroblasts. Biochim. Biophys. Acta 438: 329–348.
7. MILLIS, K. et al. 1999. Classification of human liposarcoma and lipoma using ex vivo proton NMR spectroscopy. Magn. Reson. Med. 41: 257–267.
8. JUHANA, M. et al. 2000. 1H NMR visible lipids in the life and death of cells. Trend Biochem. Sci. 25: 357–361.
9. VITO, M.D. et al. 2001. 1H NMR-visible mobile lipid domains correlate with cytoplas-mic lipid bodies in apoptotic T-lymphoblastoid cells. Biochim. Biophys. Acta 1530: 47–66.
10. BEZABEH, T. et al. 2001. Detection of drug-induced apoptosis and necrosis in human
cervical carcinoma cells using 1H NMR spectroscopy. Cell Death Differ. 8: 219–224. 11. VERMES, I. et al. 1995. A novel assay for apoptosis. Flow cytometric detection of
phos-phatidylserine expression on early apoptotic cells using fluorescein-labeled Annexin V. J. Immunol. Methods 184: 39–51.
12. VAN, M.E. et al. 1996. A novel assay to measure loss of plasma membrane asymmetry during apoptosis of adherent cells in culture. Cytometry 24: 131–139.
13. ORMEROD, M.G. et al. 1992. Apoptosis in interleukin-3-dependent haemopoietic cells. Quantification by two flow cytometric methods. J. Immunol. Methods 153: 57–65. 14. HAKUMAKI, J.M. et al. 1999. 1H MRS detects polyunsaturated fatty acid accumulation
during gene therapy of glioma: implication for the in vivo detection of apoptosis. Nat. Med. 5: 1323–1327.