國 立 交 通 大 學
電子工程學系 電子研究所
碩 士 論 文
背向散射理論應用於金氧半場效電晶體之非匹
配特性研究
Backscattering-Oriented MOSFET Mismatch
Experiment
研 究 生:宋東壕
指導教授:陳明哲 博士
背向散射理論應用於金氧半場效電晶體之非匹
配特性研究
Backscattering-Oriented MOSFET Mismatch
Experiment
研 究 生:宋東壕
Student:Tung-Hao Sung
指導教授:陳明哲博士
Advisor:Dr. Ming-Jer Chen
國 立 交 通 大 學
電子工程學系 電子研究所
碩 士 論 文
A Thesis
Submitted to Department of Electronics Engineering & Institute of Electronics College of Electrical Engineering
National Chiao Tung University in Partial Fulfillment of the Requirements
for the Degree of Master of Science
In
Electronics Engineering July 2008
Hsinchu, Taiwan, Republic of China
背向散射理論應用於金氧半場效電晶體之非匹
配特性研究
研究生:宋東壕
指導教授:陳明哲博士
國立交通大學
電子工程學系 電子研究所碩士班
摘要
在這篇論文中我們提出了幾個數學模型來呈現背向散射理論中
金氧半場效電晶體裡數個參數的不匹配特性。我們從實驗中萃取了
K
BT 層的寬度加以分析,並且運用拋物線能障理論提出了物理模型來
呈現它的不匹配特性。除此之外,這篇論文中也討論到了平均自由路
徑和背向散射係數的不匹配特性。為了精準的理由,我們將汲極和源
極電阻考慮在我們的參數萃取和模型上。最後我們提出了一個物理模
型來計算飽和區電晶體的電流不匹配效應。
iBackscattering-Oriented MOSFET Mismatch
Experiment
Student: Tung-Hao Sung
Advisor: Dr. Ming-Jer Chen
Department of Electronics Engineering
& Institute of Electronics
National Chiao Tung University
Abstract
In this thesis, we have derived several mathematical models to express the mismatch properties of MOS transistors based on the backscattering theory. We have extracted the KBT layer’s width from the experimental analysis and we have found a
simple model to express its mismatch properties based on the parabolic potential barrier. The mean-free-path and the backscattering coefficient have also been discussed in this thesis. For the purpose of the accuracy, the source/drain series resistance has been incorporated in to our parameters extraction. Straightforwardly, we have developed a drain current mismatch model based on backscattering theory in the saturation region.
Acknowledgement
就在打這頁的同時,長達六年的交大生涯也即將結束,當然也包括兩年的研究 所時光。在這段期間,遇到了很多事情,也學到了不少東西。雖然這些年的生活 得到許多有趣的理工知識,但我始終認為最珍貴的,是我在這段時間所遇到的" 人"。因為有這些夥伴,我才有動力可以往前,才能有去體驗不同事物的渴望。 因為有陳明哲教授的教導,使得我了解到做研究所需要的精神和方法;因為有謝 振宇、李建志、許智育和李韋漢學長們在知識上的傳承,使的我做研究的過程更 為順利;呂立方、周佳弘、林以唐、梁惕華、陳彥銘、簡鶴年同學以及湯侑穎、 陳又正、陳以東學弟們的陪伴,使得兩年多的研究時光並不孤單;除了實驗室的 夥伴,無論是大學四年的同學、室友,或者是打球的球友,都讓這些日子的生活 更益多采多姿,在此要感謝每個人的幫助和陪伴。最後要感謝的就是在美國默默 支持我的家人,雖然這段時間每年見面的時間並不多,但是學期中透過短暫的電 話以及信件,都讓我獲得莫大的力量。這篇論文的完成並不是一個結果,只是一 個過程,因此在往後的人生旅途上,希望這份羈絆可以繼續延續下去。 iiiContents
Chinese Abstract ... i English Abstract ... ii Acknowledgement ... iii Contents ... iv Figure Captions ...v Chapter 1 Introduction ...1
1.1 Mismatch in MOS Transistors ...1
1.2 Organization of the thesis ...1
Chapter 2 Backscattering Theory and Parameters Extraction ...3
2.1 Backscattering Theory ...3
2.2 Parabolic Potential Barrier ...5
2.3 Mean-Free-Path...7
2.4 Source/Drain Series ResistanceExtraction ...8
2.5 Threshold Voltage and DIBL ...10
Chapter 3 Mismatch Experiment and Results ...12
3.1 Mismatch Model ...12
3.2 Experiment ...13
3.3 Mismatch Properties of KBT layer’s width ...13
3.4 Backscattering Coefficient Mismatch ...16
3.5 Drain Current Mismatch ...17
Chapter 4 Conclusions ...20
References ...21
Figure Captions
Fig.1 Schematic illustration of channel backscattering theory in terms of the cross section and the conduction band profile.
………..23
Fig.2 The mean value of KBT layer’s width versus channel length for W=0.13(um),
and 0.24(um). Open triangle displays the mean value of A extracted by parabolic potential model and open circle shows the mean value of A extracted by experiment.
………..24 Fig.3 The measured mobility versus channel length for W=0.13(um) and 0.24(um).
The mobility is obtained from G-D method.
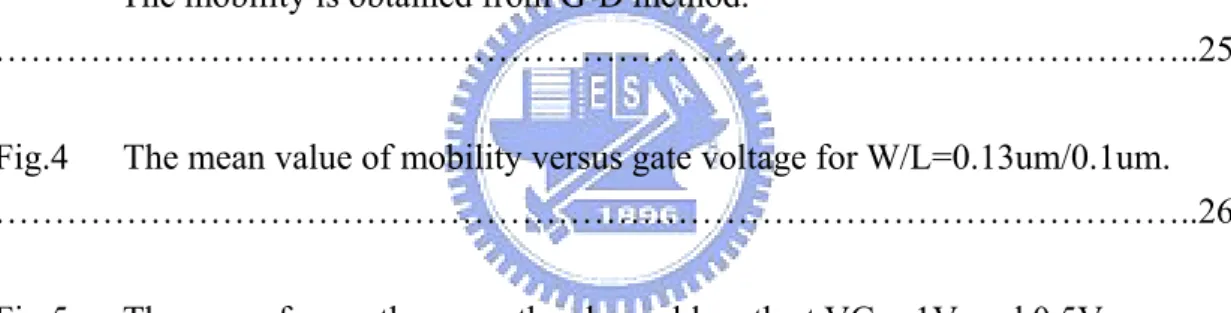
………..25 Fig.4 The mean value of mobility versus gate voltage for W/L=0.13um/0.1um. ………..26 Fig.5 The mean-free-path versus the channel length at VG = 1V, and 0.5V.
………..27 Fig.6 The mean-free-path versus gate voltage for W/L=0.13um/0.5um. The
thermal injection velocity is substituted as 107 cm/sec.
………..28 Fig.7 The backscattering coefficient versus channel length. The mean value of RC
are extracted from W=0.13 um, 0.24 um and 1 um at VG=1 V and 0.5 V. ………..29 Fig.8 RSD comparison for different dimension.
………..30
Fig.9 RSD comparison for different VBS values.
………..31 Fig.10 RSD comparison for different device sample with the same dimensions.
………..32 Fig. 11 Drain current and gm versus the gate voltage and threshold voltage
extraction.
………..33 Fig.12 The standard deviation of KBT layer’s width from experiments versus the
gate voltage.
………..34 Fig.13 The variance of threshold voltage versus the inverse square root of area
along with a fitting line.
………..35 Fig.14 Comparison of mismatch model calculation and the experiments for
W/L=0.13um/0.1um, 0.24um/0.1um, and 1um/0.5um at drain voltage VD=1V.
………..36 Fig. 15 The standard deviation of KBT layer’s width versus the square root of L/W.
………..37 Fig. 16 The standard deviation divided by mean value of KBT layer’s width versus
the inverse square root of area.
………..38 Fig.17 The σλ/mean(λ) versus the inverse square root of area.
………..39 Fig.18 The standard deviation of RC versus gate voltage VG for model calculation
and experimental data for W/L=0.13um/0.1um and 0.24um/0.1um.
Fig.19 The variance of threshold voltage versus the inverse square root of area. ………..41 Fig.20 The variance of DIBL versus the inverse square root of area with a fitting
line.
………..42 Fig. 21 Comparison of drain current mismatch model and experiments for
W/L=0.13um/0.1um and 0.24um/0.1um at drain voltage VD= 1V.
Chapter 1
Introduction
Section 1.1 Mismatch in MOS Transistors
This dissertation is a contribution to the discussion on the mismatch properties of MOS transistors based on backscattering theory. Mismatch is the process that causes time-independent random variations in physical quantities of identically designed devices. In MOS transistors, It is well recognized that most MOS parameters variations are mainly caused by the doping variation , such as threshold voltage, drain induced barrier lowering(DIBL), backscattering coefficient, etc. And these variations will directly effect the MOS transistor properties and performance, thus mismatch research plays an important role in the design of accurate analog circuits and digital circuits in the future. What we want is deriving a mismatch model to express the variation from long channel to short channel at different electric field and the mismatch properties of the nanoscale device in the future will also be clearly showed.
Section 1.2 Organization of This Thesis
Chapter 1 is a brief introduction about this dissertation and our work. In Chapter 2 of this dissertation, we have discussed the backscattering theory and some parameters
2
extraction method, including the traditional backscattering coefficient extraction and parabolic potential model [1]. On the other hand, we applied the drain/source series resistance theory in our parameter extraction by using constant mobility method [2]. In Chapter 3, we have derived several mismatch model based on the backscattering theory. The first mismatch model is derived by the parabolic potential theory [1]. On the other hand, it is well-known that the backscattering coefficient can be expressed as:
where A and λ are the critical length in the channel near the source that the conduction band bends down by a thermal energy of KBT (KBT layer’s width) and
mean free path. The A variation will be analyzed in this part. Based on this mismatch model, RC mismatch model is also derived and discussed. The third
mismatch model is developed by using drain current equation in saturation region:
where Ving, Vtho are the thermal injection velocity at the top of source-channel
junction barrier and the quasi- equilibrium threshold voltage. In this model, the drain current mismatch can be expressed as a function of three parameters variation: Vtho,
Rc, and DIBL. We have also compared our mismatch models with experiments in chapter 3, whereas the details of data extraction about experiment will be discussed in the chapter 2.
(
)
[
]
C C D tho G inj DR
R
V
DIBL
V
V
V
C
W
I
+
−
×
×
−
−
×
×
×
=
1
1
' ' cr
λ
=
+
A
A
Chapter 2
Backscattering Theory and Parameters
Extraction
Section 2.1 Backscattering Theory
The backscattering theory describes the near-equilibrium scattering process near the source when the electrons travel across the channel. Electrons are injected from the source into the channel and only those over a potential barrier can be collected by the drain. This potential barrier is the conduction band which bends “up” due to the presence of the source-channel junction and then bends down due to the channel electric field caused by drain voltage. This barrier may be linked to drain-induced barrier lowering. As schematically shown in Fig. 1, A is the length across which the conduction band bends down by a thermal energy of KBT, where T is the temperature,
and KB is the Boltzmann’s constant. This length is known as the width of KBT layer.
Backscattering is mainly occurring in the KBT layer due to the lattice and carrier. The
backscattering coefficient, RC, is determined to describe the scattering in the KBT
layer, as shown in Fig. 1, RC can be written as:
)
1
(
λ
+
=
A
A
CR
where λ is the mean-free-path and A is the width of KBT layer. We note that RC is
determined by the electric field profile very near the source where the electrons have been heated to no more than KBT/q. Thus the λ can be estimated by the
4
on the backscattering coefficient, we assume that there is a source flux F injected into the channel and part of F will be reflected back to the source. From Fig. 1, the flux entering the drain can be expressed as:
(
1
C)
(
2
)
S
D
F
R
F
=
−
Here we assume the flux reflected back to the source from the channel does not reflect. Thus the electron density in the source side can be expressed as:
(3)
where the VT is the velocity of the flux. From (2) and (3), we can obtain an equationbelow:
(4)
As a result, we find)
5
(
1
1
C C T DR
R
V
Q
I
+
−
⋅
⋅
=
where Q is the charge density per unit area. In the saturation region, above equation can be also written as:(
)
(
6
)
1
1
C C T th G eff DR
R
V
V
V
C
W
I
+
−
⋅
⋅
−
⋅
⋅
=
This is the backscattering theory based current equation in saturation region used in this thesis. We can note that there is no mobility parameter in this formula and the drain current heavily depends on the new parameter: RC. For example, in the ballistic
situation RC =0, the drain current is governed by the thermal injection velocity [1]. T C S s
V
R
F
n
=
⋅
(
1
+
)
C C T S DR
R
V
n
F
+
−
⋅
⋅
=
1
1
From (6), we can extract RC from several processes in the experiment. In order to get
the parameter accurately, the drain-induced-barrier-lowering and drain/source series resistance must be considered. Thus equation (6) should be modified as:
(
)
(
(
)
)
[
]
(
7
)
1
1
C C T SD D D tho S D G eff DR
R
V
R
I
V
DIBL
V
R
I
V
C
W
I
+
−
⋅
⋅
⋅
−
⋅
−
−
−
⋅
⋅
=
The RS, RD and DIBL parameters extraction will be discussed later.
Section 2.2 Parabolic Potential Barrier
If there is no electric field, the backscattering coefficient can be simply written as [4]:
)
8
(
λ
+
=
L
L
R
CWhen the electric field is present, the conduction band will bend down and the backscattering coefficient should be expressed as [5]:
)
9
(
λ
+
=
A
A
CR
Because the value of backscattering coefficient highly depends on A which is the width of KBT layer, the quantity of A is an important issue in the backscattering
6
problem. We assume that the conduction band bends down as a parabolic situation and the equation of potential drop can be described as:
)
10
(
/
)
(
2 ~⎟
⎠
⎞
⎜
⎝
⎛
=
V
x
L
x
V
D ~L is the distance that the conduction band drop from the top of the barrier to VD. The
definition of the width of the KBT layer is that the critical distance that the conduction
band potential drops KBT /q. So we substitute x and V(x) in above equation as A and
KBT/q. Thus the equation can be rewritten as:
)
11
(
5 . 0 ~⎟⎟
⎠
⎞
⎜⎜
⎝
⎛
=
D BqV
T
K
L
A
This is an equation about the relation of L and A based on parabolic potential ~
model, whereas L is expected to be a function of channel length, drain voltage, gate ~
voltage, and temperature. To derive the relation between L and L, thus V~ G0, VD0,
and T0 must be defined in order to ensure that ~
L = L in these situations and A can 0
be calculated from this function in these situations (VD-> VD0, VG-> VG0, T->T0). To
find the relation of these parameters, the different parameters should be discussed separately. The process of the equation derivation between L and each parameter ~
was discussed in [1] and L can be expressed as: ~
(
)
(
12
)
5 . 0 5 . 0 25 . 0 ~⎟⎟
⎠
⎞
⎜⎜
⎝
⎛
−
=
q
T
K
V
V
V
L
L
B th G Dη
where(
)
0.25 0 5 . 0 0 5 . 0 0/ ( ) − − − = KBT q VG Vth VDη and it is a constant that can be known by
fitting in experiment [1]. In this thesis, we consider that n=4.1( −0.25
the L in equation (12) to equation (11), a compact relation between A and bias, ~
device geometrical parameters can also be obtained:
(
)
0.5(
)
(
13
)
25 . 0q
T
K
V
V
V
L
B th G D−
=
η
−A
From equation (13), We have extracted A for W/L = 0.13um/0.065um, 0.24um/0.065 um, 1um/0.065um, 0.13um/0.1um, 0.24um/0.1um, 1um/0.1um, 0.13um/1um, 0.24um/1um, 1um/1um, 0.13um/10um, 0.24um/10um, and 1um/10um all at VG = 1 V,
VG = 0.7 V, and VG = 0.5V for VD = 1 V. On the other hand, A extracted
experimentally is also shown for comparison. In Fig. 2, open circle represents the mean value of A extracted by parabolic potential model and open triangle represents the mean value of A extracted experimentally.
Section 2.3 Mean‐Free‐Path
The backscattering coefficient can be written as (1). λ is the low-field mean-free-math and can be linked to μn0 through
(
/
)
/
(
14
)
2
μ
n0K
BT
q
V
injλ
=
where Ving is the thermal velocity and μn0 is the near-equilibrium mobility because
that the backscattering occurs very near the source and it can be regard as a near-equilibrium case even there is a strong electric field in the channel due to the drain voltage [3]. Fig. 3 shows the mobility versus channel length, whereas the mobility is obtained from G-D method. It can be seen that there is a drop of the mobility when the channel length decreases due to the short channel effect. Fig. 4
8
displays the mobility versus gate voltage and the three components, which affect the curve of the mobility, can be clearly expressed by the following scatterings: Coulomb scattering, phonon scattering, and surface roughness scattering. Substituting above mobility data into equation (13), the mean-free-path can be obtained. Fig. 5 and Fig. 6 show the mean-free-path versus the channel length at VG = 1V, and 0.5V, and the
mean-free-path versus the intrinsic gate voltage, respectively. Here the thermal velocity is substituted as 107 cm/sec in equation (14). In order to get the backscattering coefficient, we substitute the mean-free-path obtained and the ℓ extracted from parabolic potential model into equation (2). Fig. 7 displays the backscattering coefficient versus channel length at different device widths for VG =
1V. The open circle represents the backscattering coefficient extracted from different mean-free -paths for different channel lengths. The open triangle represents the backscattering coefficient extracted from the same mean free path in the long channel case because we consider the mean free path as a parameter due to the material (independent of L). The backscattering coefficient extracted from experiment is also shown in Fig. 7 and labeled by the open square. It can be seen that the backscattering coefficient decreases as the channel length decreases in these cases and the open triangle are closer to the experimental data compared to those of short channel length devices.
Section 2.4 Drain/Source Series Resistance
Extraction
In order to extract the accurate parameters such as backscattering coefficient in this work, the existence of the series resistance RSD should be considered. The series
because the channel resistance of the long channel device is huge compared with the series resistance, the series resistance can be ignored. But in today’s MOSFET nanoscale technology, the existence of the RSD may lead to many problems such as the
drive current degradation and parameter extraction accuracy. In the traditional method, the RSD can be extracted from different gate voltage and devices of different channel
lengths. The conventional method is not accurate at short channel situations. So we use a new method called constant-mobility-method to extract RSD [2]. The constant
mobility method is used to extract RSD in the high oxide electric field region where
surface roughness scattering becomes the dominant mechanism. In the high electric region, a constant mobility is achieved for a given effective vertical electric field, regardless of impurity scattering and phonon scattering, and the change of VBS will
lead to the same mobility in this region. The current equation of MOSFETs operating in the linear region can be expressed as:
(
)
(
15
)
)
2
1
(
(1) (1) (1) ) 1 ( ) 1 ( d sd ds ds th gs eff eff ox DV
V
V
V
R
I
L
W
C
I
=
μ
−
−
−
(
)
(
16
)
)
2
1
(
(2) (2) (2) ) 2 ( ) 2 ( d sd ds ds th gs eff eff ox DV
V
V
V
R
I
L
W
C
I
=
μ
−
−
−
Equation (15) and equation (16) apply to linear operation mode at different VBS and
VDS =0.01 V. To extract RSD, we assume that μ(1)= μ(2) and substitute the mobility
of equation (15) as equation (16). Then the RSD can be written as:
)
17
(
)
(
)
(
(2) (1) (1) (2) th th ds d d sdV
V
V
I
A
I
B
R
−
−
=
η
ds th gsV
V
V
A
2
1
) 1 ( ) 1 (−
−
=
10 ds th th gs
V
V
V
V
B
2
1
)
1
(
(1) (2) ) 1 (+
−
−
−
=
η
η
Fig. 8 shows the RSD extracted by equation (17) for W/L=0.24um/0.1um and
W/L=0.24um/0.065um and we focus on VG>1V to ensure a high electric field
condition. Fig. 9 shows the RSD extracted at different VBS conditions. Fig. 10 shows
the RSD extracted from different devices at the same scale. We have done many
experiments in order to ensure that the RSD extracted from different channel length
and bias conditions should be a constant. The RSD value extracted from the constant
mobility method at different device dimensions will be used in some parameters extraction in this thesis.
Section 2.5 Threshold Voltage and DIBL
The threshold voltage extraction is an important part in the MOS transistors research and a key parameter in this work. We employ a maximum tran-conductance method in the linear region to assess quasi-equilibrium threshold voltage and the constant subthreshold current method in the saturation region to extract the DIBL. The maximum tran-conductance is a method establishing a tangent line from the point where the tran-conductance is the maximum to show the threshold voltage in the ID-VG gragh. We set the drain voltage VD = 10mV to ensure the quasi- equilibrium
case. Fig. 11 shows drain current versus gate voltage and the maximum tran-conductance method.
The Drain Induced Barrier-Lowering is the decreasing of the threshold voltage when the drain voltage increases, caused by conduction band bends lowering. In other words, the channel control from the gate will weaken at high drain electric field,
especially in the short channel devices. To develop the mismatch model accurately, the DIBL must be considered. We use the constant subthreshold current method to calculate the threshold voltage shift due to the VD increase and measure the DIBL in
the saturation region. We set the drain voltage VD = 1V to ensure that the device is
operated in the saturation region.
12
Chapter 3
Mismatch Experiment and Results
Section 3.1 Mismatch Model
The mismatch model is a mathematical equation to express the variation of the parameter. The mismatch properties have two features: the total mismatch of the parameter is composed of many single events of the mismatch-generating process and the effects on the parameter are so small that the contributions to the parameter can be summed [6]. The mismatch properties of threshold voltage are the main topic of mismatch since 1970s. In this thesis, our mismatch model is developed based on the research of threshold voltage in the traditional theory and the backscattering theory. To reach for our goal, we must develop the mismatch model step by step. First of all, we focus on the width of the KBT layer and analyse its mismatch properties. Then we
develop the backscattering coefficient mismatch properties in the next step.
One of the fundamental factors limiting the accuracy of MOS circuits is the current mismatch between identically devices. So, based on above considerations and series resistance extraction, the drain current mismatch model will be presented later. The transistors in the circuits usually operate in the saturation region. Thus, the mismatch models in this thesis are all developed and discussed in saturation region.
Section 3.2 Experiment
The measurement procedure is an important part in the mismatch work. Generally, to obtain the statistical variation, we need to measure a lot of devices. In this work, we measure over than 20 different dimensions of n-channel devices, whereas each scale has more than 30 dies on the wafer. All dies are made from the same process and have the same structure. They were fabricated using 65nm CMOS process. We measure our drain current by sweeping gate voltage from 0 to 1.2 V in a step of 25 mV when we fixed the drain voltage at 0.01 V, 0.1 V, and 1 V in order to cover both the equilibrium case and the saturation region case. In the extraction of the series resistance, we set substrate bias VB at = -0.4 V, -0.8 V, and 0 V. The temperature was fixed at 298 K. The measurement setup includes the HP4156B and a Faraday box for shielding the wafer.
Section 3.3 Mismatch Properties of K
BT Layer’s Width
The mismatch properties can be expressed as the standard deviation: σ. The standard deviation can be calculated from the parameters extracted in the experiment. In statistics, there should be more than 20 measured devices to ensure that the standard deviation calculated can be considered as the mismatch properties of all dies on the wafer. In this section, the standard deviations are calculated from over than 20 dies. The extreme variance of the parameter would be lead to high standard deviation. Fig. 12 shows the standard deviation of KBT layer’s width versus the gate voltage
14
voltage increases. To propose a simple statistical model to explain the phenomenon observed, we pay attentions to the equation of the KBT layer’s width. In Chapter 2, we
introduce the parabolic potential barrier model to calculate the width of KBT layer:
(18)
From above equation, we will express the mismatch of A as a function of the variance of threshold voltage. The variance of standard deviation with one random variable x can be expressed as:
(19)
Thus, from equation (18) and equation (19), the standard deviation of KBT layer’swidth can be written as:
where . The standard deviation can be expressed as a function of inverse square root of the device area [6]. Thus we obtain a compact model:
where A is a constant depending on channel length and drain voltage and is independent of gate voltage.
th
V
A is the size proportionality constant for the variance x
x
x
σ
σ
⎟
⋅
⎠
⎞
⎜
⎝
⎛
∂
∂
=
A
(
)
A 1/ 2 1/ 2 0.25 1/ 2(
)
D B B G th DV
k T
k T
L
V
V
q
qV
η
⎛
⎞
⎛
⎞
=
⎜
⎟
⎜
⎟
−
⎝
⎠ ⎝
⎠
A
( )
(
20
)
)
)
(
2
(
1.5 Vth th GV
V
A
σ
σ
⋅
−
⋅
=
A)
(
0.5 25 . 0V
nm
L
V
q
T
K
A
=
B⋅
η
⋅
D−⋅
⋅
)
21
(
)
)
(
2
(
1.5⎟⎟
⎠
⎞
⎜⎜
⎝
⎛
⋅
−
⋅
=
WL
A
V
V
A
Vth th G Aσ
of threshold voltage, as shown in Fig. 13. From the threshold voltage term in above equation, we can observe that the variance of KBT layer’s width would decrease when
the gate voltage increases because that the effect of the threshold voltage fluctuation would become smaller. In other words, the variance of KBT layer’s width is sensitive
to threshold voltage in the weak inversion region. This is a simple mathematical model to understand the mismatch properties of KBT layer’s width and can calculate it
from just three simple parameters: threshold voltage, device size, and drain voltage. Fig. 14 displays the mismatch calculations compared with the experiments for W/L=0.13um/0.1um, 0.24um/0.1um, and 1um/0.5um at drain voltage VD=1V. We can observe that the differences between the two are small. Fig. 15 shows that the variance of A versus square root of L/W for different devices at fixed gate voltage VG=1V. When the gate voltage is high, the difference of the threshold voltage in equation (21) can be ignored and the standard deviation of KBT layer’s width can be
proportional to the square root of channel length divided by device width (L/W). It can be clearly shown in equation (21) by separating the channel length (L) term from constant A and multiplied by the inverse square root of area. Another relation can be observed from dividing each sides of equation (21) by KBT layer’s width, where the
channel length term in constant A would be deleted. Then the standard deviation divided by the mean of KBT layer’s width is proportional to the inverse square root of
device area when gate voltage is high. Fig. 16 displays this relationship which is a traditional relationship like current factor or mobility [6].
16
Section 3.4 Backscattering Coefficient Mismatch
The backscattering coefficient RC can be expressed as (1), whereas RC is a function
of two variables: mean free path and KBT layer’s width. To express the mismatch as
these two parts, we applied a differential equation below for analysis:
where σx and σy, are the variance of x and y, respectively. COV (x, y) is the correlation
coefficient between (x, y). We assume that the mean-free-path and KBT layer’s width
are independent of each other, that is, the correlation coefficient COV (x, y) is zero.
Thus the RC mismatch model can be expressed as:
This is a simple mathematical model to estimate the fluctuation of RC in the
saturation region. The σA is already discussed in Section 3.3 and the ratio σλ/mean(λ)
can be obtained by the experiment. Both of them have a proportional relationship with the inverse square root of area. From these two different mismatch properties, the standard deviation of RC can also be obtained, so does the standard deviation divided
by the mean: σRC/mean(RC). The mismatch properties of the mean-free-path should
have the same properties as mobility in [7]. Fig. 17 shows the relationship between the σλ/mean(λ) and the inverse square root of area. Fig. 18 displays the standard
deviation RC versus gate voltage VG from equation (23), compared with experiments
( )
,
(
22
)
2
2 2 2 2 2 ) , (⎟⎟
⎠
⎞
⎜⎜
⎝
⎛
∂
∂
⎟
⎠
⎞
⎜
⎝
⎛
∂
∂
+
⎟⎟
⎠
⎞
⎜⎜
⎝
⎛
∂
∂
+
⎟
⎠
⎞
⎜
⎝
⎛
∂
∂
=
y
P
x
P
y
x
C
y
P
x
P
ov y x y x Pσ
σ
σ
2 2 2 2 2 ) , ( λσ
λ
σ
λσ
⎟
⎠
⎞
⎜
⎝
⎛
∂
∂
+
⎟
⎠
⎞
⎜
⎝
⎛
∂
∂
=
C C RR
R
C AA
A( )
( )
2(
23
)
2 2 2 λσ
λ
λ
λ
σ
λ
λ
⎟
⎠
⎞
⎜
⎝
⎛
+
−
+
⎟
⎠
⎞
⎜
⎝
⎛
+
=
R
CR
CA
A
A
Afor W/L=0.13um/0.1um, and W/L=0.24/0.1um, all at VD=1V to ensure the saturation region. We can observe that the model and the experiments are quite close to each other.
Section 3.5 Drain Current Mismatch
Drain current mismatch properties is the last part of this work which directly affects the performance of the circuit. To develop the drain current mismatch model accurately, we considered the extracted series resistance:
(
)
(
(
)
)
[
]
(
24
)
1
1
C C T SD D D tho S D G eff DR
R
V
R
I
V
DIBL
V
R
I
V
C
W
I
+
−
⋅
⋅
⋅
−
⋅
−
−
−
⋅
⋅
=
This is a whole drain current equation based on backscattering theory. We define that the current mismatch is the standard deviation divided by the mean: σID/mean(ID).
The standard deviation σg(x,y,z) with three variables of x, y and z can be expressed as:
)
25
(
)
,
(
2
)
,
(
2
)
,
(
2
)
(
)
(
)
(
2 2 2 2 2 2 ) , , ( 2z
x
C
z
g
x
g
z
y
C
z
g
y
g
y
x
C
y
g
x
g
z
g
y
g
x
g
OV OV OV z y x z y x g⎟
⎠
⎞
⎜
⎝
⎛
∂
∂
⎟
⎠
⎞
⎜
⎝
⎛
∂
∂
+
⎟
⎠
⎞
⎜
⎝
⎛
∂
∂
⎟⎟
⎠
⎞
⎜⎜
⎝
⎛
∂
∂
+
⎟⎟
⎠
⎞
⎜⎜
⎝
⎛
∂
∂
⎟
⎠
⎞
⎜
⎝
⎛
∂
∂
+
∂
∂
+
∂
∂
+
∂
∂
=
σ
σ
σ
σ
where σx, σy and σz are the standard deviation of x, y and z, respectively; and COV(x,
y), COV(y, z), and COV(x, z) are the correlation coefficients of each variables. In this
equation, we assume that these three coefficients are so small, leading to COV(x, y),
18
where σVth, σDIBL and σRC can be proportional to the inverse of square root of area.
Fig. 19 and Fig. 20 display the relationship between threshold voltage, DIBL and area. The variance of backscattering RC is discussed in Section 3.4 already. Thus we have:
)
27
(
,
,
0L
W
A
L
W
A
L
W
A
RC RC DIBL DIBL vtho vth⋅
=
⋅
=
⋅
=
σ
σ
σ
Substituting equation (27) into the drain current mismatch model, we obtain the compact model:
Fig. 21 shows the mismatch of current versus gate voltage for W/L=0.13um/0.1um, and 0.24um/0.1um, at VD=1V to ensure the saturation region. We can observe that the
current mismatch decreases when the gate voltage increases because that the
(
)
(
)
(
)
) 26 ( ) ( ) 1 ( 4 1 1 ) ( 1 ) 1 / 1 ( 1 ) 1 ( 2 2 2 2 2 2 2 2 2 C R C C DIBL D tho G C C D tho G SD D Vtho D tho G D ID R R R V DIBL V V R R V DIBL V V R C W V V DIBL V V I C σ β α σ β α β α σ σ − ⎟⎟ ⎠ ⎞ ⎜⎜ ⎝ ⎛ + + + ⎥ ⎦ ⎤ ⎢ ⎣ ⎡ × + − + + + − × + − ⋅ ⋅ − + + + × + − = ⎟⎟ ⎠ ⎞ ⎜⎜ ⎝ ⎛⎪
⎩
⎪
⎨
⎧
+
−
⋅
⋅
⋅
⋅
⋅
=
+
−
⋅
⋅
⋅
⋅
=
Rc
Rc
R
DIBL
V
C
W
Rc
Rc
R
V
C
W
sd ing s ing1
1
1
1
β
α
(
)
(
)
(
)
)
28
(
)
1
(
4
1
1
)
(
1
)
1
/
1
(
1
)
1
(
2 2 2 2 2 2 2 2 2⎟⎟
⎠
⎞
⎜⎜
⎝
⎛
⋅
−
⎟⎟
⎠
⎞
⎜⎜
⎝
⎛
+
+
+
⎟⎟
⎠
⎞
⎜⎜
⎝
⎛
⋅
⎥
⎦
⎤
⎢
⎣
⎡
×
+
−
+
+
+
−
×
+
−
⋅
⋅
−
+
+
+
⎟⎟
⎠
⎞
⎜⎜
⎝
⎛
⋅
×
+
−
=
⎟⎟
⎠
⎞
⎜⎜
⎝
⎛
L
W
A
R
L
W
A
V
DIBL
V
V
R
R
V
DIBL
V
V
R
C
W
V
L
W
A
V
DIBL
V
V
I
RC C DIBL D tho G C C D tho G SD D vtho D tho G D IDβ
α
β
α
β
α
σ
fluctuation of the threshold voltage, DIBL and backscattering coefficient would have smaller effects at high gate voltages. And we can also observe that the difference between the model and the experiments are small. In this mismatch, the variance of RC is the dominant parameter which affects the drain current mismatch compared with
threshold voltage and DIBL.
20
Chapter 4
Conclusion
We have developed a compact mathematical model for mismatch properties of MOS transistors in this thesis. Unlike the traditional research focused on threshold voltage variance only, we have incorporated additional parameters into discussion: DIBL and backscattering coefficient. We have done many works in detail based on the backscattering theory, covering KBT layer’s width and mean-free-path. Besides, many
data have been measured in order to verify our mismatch model. Step by step, several mismatch models have been successfully developed to express the matching properties of each involved parameters, especially the KBT layer’s width and the drain
current mismatch.
Reference:
[1] M. J. Chen, and Li-Fang Lu, “A Parabolic Potential Barrier-Oriented Compact Model for the KBT Layer’s Width in Nano-MOSFETs,” IEEE Transactions on Electron Devices, vol. 55, no. 5, pp. 1265-1268, May 2008.
[2] Da-Wen Lin, Ming-Lung Cheng, Shyh-Wei Wang, Chung-Cheng Wu, and Ming-Jer Chen,” A Constant-Mobility Method to Enable MOSFET Series-Resistance Extraction,” IEEE Electron Device Letters, vol. 28, no. 12, pp.
1132-1134, December 2007.
[3] M. J. Chen, Huan-Tsung Huang, Yi-Chin Chou, Rong-Ting Chen, Yin-Ta Tseng, Po-Nien Chen, and Carlos H. Diaz, “Seperation of Channel Backscattering Coefficients in Nanoscale MOSFETs,” IEEE Transactions on Electron Devices,
vol. 51, no. 9, pp. 39-42,September 2004.
[4] Raphael Clerc, Pierpaolo Palestri, and Luca Selmi, “On the Physical Understanding of the KT-layer Concept in Quasi-Ballistic Regime of Transport in Nanoscale Devices,” IEEE Transactions On Electron Devices, vol. 53, no. 7,
pp. 1634-1640, July 2006.
[5] M. S. Lundstrom, “Elementary scattering theory of the si MOSFET,” IEEE
Electron Device letters, vol. 18, no. 7, pp. 361-363, Jul. 1997.
[6] Marcel J. M. Pelgrom C. J. Duinmaijer, and Anton P. G. Welbers, “Matching Properties of MOS Transistors,” IEEE Journal of Solid-State Circuits, vol. 24, no.
22
[7] Kadaba R. Lakshmikumar, Robert A. Hadaway, and Miles A. Copeland, “Characterization and Modeling of Mismatch in MOS Transistors for Precision Analog Design,” IEEE Journal of Solid-State Circuits, vol. sc-21, no. 6, pp.
1057-1066 ,December 1986.
)
0
(
V
V
E
C D=
)
0
(
V
V
E
C D≠
~L
A
(
C)
S DF
R
F
=
⋅
1
−
SF
C SR
F
+n
n
+ ) ( th G V V > q T KBFig.1
24
Fig.2
0.0 0.2 0.4 0.6 0.8 1.0 0 20 40 60 80 100 120 140 160 180 0.0 0.2 0.4 0.6 0.8 1.0 0 20 40 60 80 100 120 140 160 180 ) ) ( ( n m m e a n A L(um) Experiment VG=1(V) Parabolic model VG=1(V) Experiment VG=0.7(V) Parabolic model VG=0.7(V) Experiment VG=0.5(V) Paranolic model VG=0.5(V) W=0.13(um) VD=1(V) 0.0 0.2 0.4 0.6 0.8 1.0 0 20 40 60 80 100 120 140 160 180 0.0 0.2 0.4 0.6 0.8 1.0 0 20 40 60 80 100 120 140 160 180 ) ) ( ( n m m e a n A L(um) Experiment VG=1(V) Parabolic model VG=1(V) Experiment VG=0.7(V) Parabolic model VG=0.7(V) Experiment VG=0.5(V) Paranolic modelVG=0.5(V) W=0.24(um) VD=1(V)
Fig.3
0.0 0.2 0.4 0.6 0.8 1.0 0 50 100 150 200 250 300 350 400 0.0 0.2 0.4 0.6 0.8 1.0 0 50 100 150 200 250 300 350 400 W=0.13(um) W=0.24(um) L(um)VG=1(V)
) / )( ( 2 S V cm meanμ
⋅26
Fig.4
0.4 0.5 0.6 0.7 0.8 0.9 1.0 1.1 1.2 100 120 140 160 180 200 220 240 260 280 0.4 0.5 0.6 0.7 0.8 0.9 1.0 1.1 1.2 100 120 140 160 180 200 220 240 260 280Experiment
VG(V)W=0.13(um) L=0.1(um)
) / )( ( 2 S V cm meanμ
⋅
Fig.5
0.0 0.2 0.4 0.6 0.8 1.0 0 2 4 6 8 10 12 14 16 18 20 0.0 0.2 0.4 0.6 0.8 1.0 0 2 4 6 8 10 12 14 16 18 20 ) )( ( nm meanλ
L(um) W=0.13 (um) W=0.24 (um) W= 1 (um)VG=1(V)
0.0 0.2 0.4 0.6 0.8 1.0 0 2 4 6 8 10 12 14 16 18 20 22 0.0 0.2 0.4 0.6 0.8 1.0 0 2 4 6 8 10 12 14 16 18 20 22 ) )( ( nm meanλ
L(um) W=0.13 (um) W=0.24 (um) W= 1 (um)VG=0.5(V) VD=1(V)
28 0.2 0.4 0.6 0.8 1.0 1.2 10 11 12 13 14 15 16 17 18 me an f ree pa th (nm) VG(V)
L=0.5(um)
W=0.13(um)
Fig.6
Fig.7
0.0 0.2 0.4 0.6 0.8 1.0 0.0 0.1 0.2 0.3 0.4 0.5 0.6 0.7 0.8 0.9 1.0 0.0 0.2 0.4 0.6 0.8 1.0 0.0 0.1 0.2 0.3 0.4 0.5 0.6 0.7 0.8 0.9 1.0 RC L(um) Experiment ParabolicModelParabolicModel ( long channel MeanFreeMath)
W=0.13(um)
VG=1(V)
0.0 0.2 0.4 0.6 0.8 1.0 0.0 0.1 0.2 0.3 0.4 0.5 0.6 0.7 0.8 0.9 1.0 0.0 0.2 0.4 0.6 0.8 1.0 0.0 0.1 0.2 0.3 0.4 0.5 0.6 0.7 0.8 0.9 1.0 RC L(um) Experiment ParabolicModelParabolicModel ( long channel MeanFreeMath)
W=0.24(um)
VG=1(V)
30 0.4 0.6 0.8 1.0 1.2 0 1000 2000 3000 4000 5000 6000 7000 8000 0.4 0.6 0.8 1.0 1.2 0 1000 2000 3000 4000 5000 6000 7000 8000 L=0.065(um) L=0.1(um) Rsd(ohm * um) VG(V)
W=0.24(um)
Rsd=220(ohm*um)(VB=-0.8V,0V)
Fig.8
0.4 0.6 0.8 1.0 1.2 0 500 1000 1500 2000 2500 3000 3500 4000 4500 5000 0.4 0.6 0.8 1.0 1.2 0 500 1000 1500 2000 2500 3000 3500 4000 4500 5000
VB=0V ,-0.4V
VB=0V ,-0.8V
Rsd(ohm * um) VG(V)W=0.24(um) L=0.1(um)
Rsd=220(ohm*um)Fig.9
32 0.5 0.6 0.7 0.8 0.9 1.0 1.1 1.2 200 400 600 800 1000 1200 1400 1600 0.5 0.6 0.7 0.8 0.9 1.0 1.1 1.2 200 400 600 800 1000 1200 1400 1600
sample1
sample2
Rsd( ohm *um ) VG(V)W=1(um),L=0.1(um)
Rsd=220(ohm*um)Fig.10
0.0 0.2 0.4 0.6 0.8 1.0 0.0000000 0.0000005 0.0000010 0.0000015 0.0000020 0.0000025 0.0000030 0.0000035 0.0000040 0.0 0.2 0.4 0.6 0.8 1.0 0.000000 0.000001 0.000002 0.000003 0.000004 0.000005 0.000006 0.000007 0.000008 0.000009 0.000010 VG(V) W=0.13(um) L=0.1(um) ) ( V A Gm
)
(A
I
D 0 thV
Fig.11
34 0.4 0.5 0.6 0.7 0.8 0.9 1.0 1.1 1.2 1.3 0.0 0.2 0.4 0.6 0.8 1.0 1.2 1.4 1.6 0.4 0.5 0.6 0.7 0.8 0.9 1.0 1.1 1.2 1.3 0.0 0.2 0.4 0.6 0.8 1.0 1.2 1.4 1.6
)
(nm
Aσ
Gate Voltage(V)Experiment
W=0.13(um) L=0.1(um) VD=1(V)
Fig.12
Fig.13
0 2 4 6 8 10 12 0.00 0.01 0.02 0.03 0.04 0.05 0 2 4 6 8 10 12 0.00 0.01 0.02 0.03 0.04 0.05)
(V
Vthσ
)
(
1
−1um
WL
)
(
00454
.
0
V
um
A
Vth=
⋅
36 0.4 0.6 0.8 1.0 1.2 0.0 0.2 0.4 0.6 0.8 1.0 1.2 1.4 1.6 1.8 2.0 2.2 2.4 0.4 0.6 0.8 1.0 1.2 0.0 0.2 0.4 0.6 0.8 1.0 1.2 1.4 1.6 1.8 2.0 2.2 2.4 ) (nm A
σ
Gate Voltage(V)Mismatchmodel
experiment
W=1(um) L=0.5(um) VD=1(V)Fig.14
0.4 0.5 0.6 0.7 0.8 0.9 1.0 1.1 1.2 1.3 0.0 0.2 0.4 0.6 0.8 1.0 1.2 1.4 1.6 0.4 0.5 0.6 0.7 0.8 0.9 1.0 1.1 1.2 1.3 0.0 0.2 0.4 0.6 0.8 1.0 1.2 1.4 1.6 ) (nm Aσ
Gate Voltage(V) Mismatch Model Experiment W=0.13(um) L=0.1(um) VD=1(V) 0.4 0.5 0.6 0.7 0.8 0.9 1.0 1.1 1.2 1.3 0.0 0.2 0.4 0.6 0.8 1.0 1.2 1.4 0.4 0.5 0.6 0.7 0.8 0.9 1.0 1.1 1.2 1.3 0.0 0.2 0.4 0.6 0.8 1.0 1.2 1.4 ) (nm Aσ
Mismatch model
experiment
Gate voltage(V) W=0.24(um) L=0.1(um) VD=1(V)0.0 0.5 1.0 1.5 2.0 2.5 3.0 0.0 0.2 0.4 0.6 0.8 1.0 1.2 1.4 1.6 0.0 0.5 1.0 1.5 2.0 2.5 3.0 0.0 0.2 0.4 0.6 0.8 1.0 1.2 1.4 1.6
VG=1(V)
Fig.15
W
L
)
(nm
Aσ
38
Fig.16
0 2 4 6 8 10 12 0.00 0.02 0.04 0.06 0.08 0.10 0 2 4 6 8 10 12 0.00 0.02 0.04 0.06 0.08 0.10VG=1(V)
)
(
1
−1um
WL
(%) ) (A A mean σ
Fig.17
0 2 4 6 8 10 12 0.00 0.01 0.02 0.03 0.04 0.05 0.06 0.07 0.08 0.09 0.10 0 2 4 6 8 10 12 0.00 0.01 0.02 0.03 0.04 0.05 0.06 0.07 0.08 0.09 0.10( )
% ) (λ σλ mean W L 1 W=0.13 (um) W=0.24 (um) W= 1 (um)VG=1(V)
(1/um)40 0.5 0.6 0.7 0.8 0.9 1.0 1.1 1.2 0.000 0.005 0.010 0.015 0.020 0.025 0.030 0.035 0.040 0.045 0.050 0.5 0.6 0.7 0.8 0.9 1.0 1.1 1.2 0.000 0.005 0.010 0.015 0.020 0.025 0.030 0.035 0.040 0.045 0.050 Gate voltage(V) Experiment model
W=0.13(um) L=0.1(um)
VD=1(V)
Fig.18
C Rσ
C Rσ
0.5 0.6 0.7 0.8 0.9 1.0 1.1 1.2 0.000 0.005 0.010 0.015 0.020 0.025 0.030 0.035 0.040 0.045 0.050 0.5 0.6 0.7 0.8 0.9 1.0 1.1 1.2 0.000 0.005 0.010 0.015 0.020 0.025 0.030 0.035 0.040 0.045 0.050 experiment model Gate voltage(V)W=0.24(um) L=0.1(um)
VD=1(V)
Fig.19
0 2 4 6 8 10 12 0.000 0.005 0.010 0.015 0.020 0.025 0.030 0.035 0 2 4 6 8 10 12 0.000 0.005 0.010 0.015 0.020 0.025 0.030 0.035)
(V
Vthoσ
)
(
1
−1um
WL
)
(
00347
.
0
V
um
A
Vtho=
⋅
42
Fig.20
0 2 4 6 8 10 12 0.000 0.005 0.010 0.015 0.020 0.025 0.030 0.035 0.040 0.045 0 2 4 6 8 10 12 0.000 0.005 0.010 0.015 0.020 0.025 0.030 0.035 0.040 0.045 DIBLσ
)
(
1
−1um
WL
)
(
00346
.
0
um
A
DIBL=
Fig.21
0.4 0.5 0.6 0.7 0.8 0.9 1.0 1.1 1.2 0.00 0.02 0.04 0.06 0.08 0.10 0.12 0.14 0.16 0.18 0.20 0.22 0.24 0.26 0.4 0.5 0.6 0.7 0.8 0.9 1.0 1.1 1.2 0.00 0.02 0.04 0.06 0.08 0.10 0.12 0.14 0.16 0.18 0.20 0.22 0.24 0.26 s( ID )/ m (I D ) VG(V) ExperimentThe mismatch model
w=0.13(um) L=0.1(um)
VD=1(V)
0.4 0.5 0.6 0.7 0.8 0.9 1.0 1.1 1.2 0.00 0.05 0.10 0.15 0.20 0.25 0.30 0.35 0.40 0.4 0.5 0.6 0.7 0.8 0.9 1.0 1.1 1.2 0.00 0.05 0.10 0.15 0.20 0.25 0.30 0.35 0.40 VG(V) ExperimentThe mismatch model