Protein Kinase-Specific Phosphorylation Sites
HSIEN-DA HUANG,1 TZONG-YI LEE,1 SHIH-WEI TZENG,2 LI-CHENG WU,2 JORNG-TZONG HORNG,2,3 ANN-PING TSOU,4 KUAN-TSAE HUANG5 1Department of Biological Science and Technology, Institute of Bioinformatics, National Chiao Tung University, Hsin-Chu 300, Taiwan, Republic of China
2
Department of Life Science, National Central University, Chung-Li 320, Taiwan, Republic of China
3
Department of Computer Science and Information Engineering, National Central University, Chung-Li 320, Taiwan, Republic of China
4
Institute of Biotechnology in Medicine, National Yang-Ming University, Taipei 112, Taiwan, Republic of China
5
National Taiwan Normal University, Taipei 162, Taiwan, Republic of China Received 22 October 2004; Accepted 10 February 2005
DOI 10.1002/jcc.20235
Published online in Wiley InterScience (www.interscience.wiley.com).
Abstract:
Protein phosphorylation, which is an important mechanism in posttranslational modification, affects essential cellular processes such as metabolism, cell signaling, differentiation, and membrane transportation. Proteins are phosphorylated by a variety of protein kinases. In this investigation, we develop a novel tool to computationally predict catalytic kinase-specific phosphorylation sites. The known phosphorylation sites from public domain data sources are categorized by their annotated protein kinases. Based on the concepts of profile Hidden Markov Models (HMM), computational models are trained from the kinase-specific groups of phosphorylation sites. After evaluating the trained models, we select the model with highest accuracy in each kinase-specific group and provide a Web-based prediction tool for identifying protein phosphorylation sites. The main contribution here is that we have developed a kinase-specific phosphorylation site prediction tool with both high sensitivity and specificity.©2005 Wiley Periodicals, Inc. J Comput Chem 26: 1032–1041, 2005
Key words: phosphorylation; protein kinase; profile hidden Markov model
Introduction
Protein phosphorylation, performed by a group of enzymes known as kinases and phosphotransferases (Enzyme Commis-sion classification 2.7), is a posttranslational modification es-sential to correct functioning within the cell.1The
posttransla-tional modification of proteins by phosphorylation is the most abundant type of cellular regulation. It affects a multitude of cellular signal pathways, including metabolism, growth, differ-entiation, and membrane transport.2 The enzymes must be
sufficiently specific and act only on a defined subset of cellular targets to ensure signal fidelity. Proteins can be phosphorylated at serine, threonine, and tyrosine residues.
Because of its importance in cellular control, it is desirable to have a computational tool for quickly and efficiently predicting phosphorylation sites in protein sequences, as well as the catalytic kinases involved in the phosphorylation. This will increase the efficient characterization of new protein sequences.1Therefore, in
this investigation, we designed and implemented a prediction tool
that can facilitate the identification of the phosphorylation sites and the related catalytic kinases.
PhosphoBase3 is a database of experimentally verified
phos-phorylation sites. The entries supply the annotations about the phosphoprotein and the exact position of its phosphorylation sites. Furthermore, part of the entries contain information about kinetic data obtained from enzyme analyzes on specific peptides. Swiss-Prot4is a comprehensively annotated protein database. Both
ex-Correspondence to: H.-D. Huang; e-mail: [email protected]; J.-T. Horng; e-mail: [email protected]
Contract/grant sponsor: TASKCO E-Business Corporation
Contract/grant sponsor: the National Science Council of the Republic of China; contract/grant number: NSC 93-2622-E-008-008-CC3 and NSC 93-2213-E-009-075
This article includes Supplementary Material available from the authors upon request or via the Internet at http://www.interscience.wiley.com/ jpages/0192-8651/suppmat
perimentally validated and putative phosphorylation annotations can be obtained from the posttranslational modification annotation in the database.
NetPhos2 presents an artificial neural network method that
predicts the phosphorylation sites in independent protein se-quences with a sensitivity in the range from 69 to 96%. DIPHOS5
is a Web-based tool for the prediction of protein phosphorylation sites. In this study, the position-specific amino acid frequencies and disorder information are used to improve the discrimination between phosphorylation and nonphosphorylation sites. Berry et al.1employ backpropagation neural networks (BPNNs), the
deci-sion tree algorithm C4.5 and the reduced biobasis function neural networks (rBPNN) to predict phosphorylation sites. NetPhosK6is
an artificial neural network algorithm to predict protein kinase A (PKA) phosphorylation sites with reported 100% sensitivity and 40% specificity in their experiments.
Most of the previous studies on phosphorylation site prediction have concentrated on only the substrate specificity. In this inves-tigation, the catalytic kinases of the protein phosphorylation are taken into account. The known phosphorylation sites from data sources in the public domain are categorized by their annotated protein kinases. To increase the sensitivity of the models, the sequences in the larger groups of phosphorylated sites can be further clustered and split into subgroups by the Maximal Depen-dence Decomposition (MDD) method.7Based on the concepts of
profile Hidden Markov Models (HMM), computational models are trained from the kinase-specific groups of the phosphorylation sites. After evaluating the trained models by the k-fold crossvali-dation method or leave-one-out crossvalicrossvali-dation method, we select the best performing model in each kinase-specific group and provide a Web-based prediction tool to facilitate the identification of protein kinase-specific phosphorylation sites.
Materials and Methods
PhosphoBase3consists of 1083 experimentally verified
phosphor-ylation sites within 436 protein entries. As given in Table 1, the number of serine sites, threonine sites, and tyrosine sites are 713, 164, and 206, respectively. Swiss-Prot4 (release 45 of October
2004) maintains 163,500 protein entries, of which 3614 entries are annotated as phosphorylated. The entries which contain residues annotated as “phosphorylation” in the “MOD_RES” fields have been extracted. The number of serine sites, threonine sites and
tyrosine sites are 1005, 281, and 321, respectively. Those sites annotated as “by similarity,” “potential,” or “probable” are con-sidered separately as a test set (see Discussion section, below).
The statistics of kinase-specific phosphorylated sites in the data sources are given in Table 2. The present study confirms that the existence of two major types of protein kinases phosphorylating either at serine/threonine residues or at tyrosine residues. The collected data sets show that the majority of serine/threonine specific protein kinases have a preference for serine residues.8The
number of serine phosphorylation sites is, in most case, 3–10 times more numerous than threonine sites in both PhosphoBase and Swiss-Prot. Comparing this to the natural situation for the different proteins annotated in the Swiss-Prot database, the ratio is 1.3:1 for serine and threonine; we and others are unable to satisfactorily explain this disparity.9
The flow of the proposed method is shown in Figure 1. We first extracted the phosphorylated sites as positive sets, nonphosphory-lated sites as negative sets, and the catalytic kinase annotations from PhosphoBase and Swiss-Prot. The positive sets are then categorized by catalytic kinases. Alternatively, in larger positive groups, the sequences of the phosphorylated sites can be clustered into subgroups by Maximal Dependence Decomposition (MDD).7
Thereupon, we incorporate the concept of profile Hidden Markov Model (HMM) to learn computational models from positive sets of the phosphorylation sites. To evaluate the trained models, k-fold crossvalidation and leave-one-out crossvalidation are carried out. After evaluating the models, the model with highest accuracy in each data set is selected. Each step in the proposed method will be introduced below.
Constructing Positive Sets and Negative Sets
We construct the phosphorylated sites as the positive sets and the nonphosphorylated sites as the negative sets. As given in Table 3, the positive sets, PB_Pos and SP_Pos, are constructed from the phosphorylation sites extracted from PhosphoBase and Swiss-Prot, respectively. PB_Pos and SP_Pos are merged into a nonredundant positive set, namely Com_Pos. Similarly, the negative sets, PB_Neg and SP_Neg, are the nonphosphorylation sites extracted from PhosphoBase and Swiss-Prot, respectively. PB_Neg and SP_Neg are merged into a nonredundant data set, namely Com_Neg. Generally, the serines, threonines and tyrosines, which are not annotated as phosphorylation residues, within the experi-mentally validated phosphorylated proteins are selected as
nega-Table 1. The Data Sources of the Phosphorylation Sites.
Data sources
Number of phosphorylated
proteins
Number of phosphorylated sites
Serine (S) Threonine (T) Tyrosine (Y) Total
PhosphoBase 436 713 164 206 1083
Swiss-Prot (Release 45 of October 2004)
796 1005 281 321 1607
a3614 3578 1331 1434 6343
aThe entries are annotated as “by similarity,” “potential,” or “probable.” The data set will be considered as test set in the Discussion section.
tive sets, that is, the nonphosphorylated sites. Therefore, two negative (nonphosphorylated) data sets are extracted from Phos-phoBase and Swiss-Prot based on the phosphorylation annotation. Specially, a few phosphorylated residues and nonphosphorylated residues located at the ends of the protein sequences lead to incompleteness of the 9-mer phosphorylated sites or nonphospho-rylated sites. These sites are eliminated from the constructed data sets.
We define the position 0 as the phosphorylated residue and the positions (⫺4–⫺1) and (⫹1–⫹4) designated the residues sur-rounding the phosphorylation residue, such as serine, threonine, and tyrosine. For the sake of the observation of the sequence distribution surrounding the phosphorylated residues, we make up the 9-mer sequence logos10,11of the phosphorylation sites and the
nonphosphorylation sites. The sequence logos10,11are a graphical
representation of an amino acid or nucleotide multiple sequence alignment. Each logo consists of stacks of symbols, one stack presents each position in the sequence. The overall height of the stack indicates the sequence conservation at that position, while the height of the symbols within the stack indicates the information content of each amino or nucleotide at that position.
As shown in Figure 2, we present the sequence logos built by the three types of the 9-mer phosphorylated sites and the 9-mer nonphosphorylated sites. By observing the sequence logos, the sequences surrounding the phosphorylated sites are more con-served than the ones surrounding the nonphosphorylated sites. Especially, the sequence logos of serine, threonine and tyrosine sites categorized by protein kinases are made and given in Figures 3, 4, and 5, respectively. Previous studies have confirmed that the most of the serine and threonine protein kinases can be divided into three classes, namely the basophilic kinases (i.e., PKA, PKC, PKG, and CaM-II), the acidophilic kinases (i.e., CKI and CKII) and the proline-directed protein kinases (i.e., cdc2 and MAPK).8
For the tyrosine kinases, most of the tyrosine kinases are acido-philic kinases.
Phosphorylation Sites are Clustered by Maximal Dependence Decomposition (MDD)
The site sequences in the positive sets with a larger size can be alternatively clustered by MDD method to increase the predictive sensitivity and specificity of the models. The Maximal
Depen-Table 2. The Statistics of the Catalytic Kinase-Specific Phosphorylation Sites.
Swiss-Prot (Release 45 of October 2004)
Catalytic protein kinases
Number of
substrate sites Serine Threonine Tyrosine
Protein kinase C (PKC) 81 67 14
cAMP-dependent protein kinase (PKA) 106 97 9
Casein kinase II (CKII) 65 55 10
Calmodulin-dependent protein kinase II (CaM-II) 14 14 0
cGMP-dependence protein kinase (PKG) 7 6 1
Casein kinase I (CKI) 14 10 4
Cell division cycle protein kinase p34cdc2 47 30 17
Mitogen-activated protein kinase (MAPK) 36 21 15
Epidermal growth factor receptor (EGFR) 10 10
Tyrosine kinase Src 14 14
Insulin receptor (INSR) 11 11
Total 405 300 70 35
PhosphoBase
Catalytic protein kinases Number of substrate sites Serine Threonine Tyrosine
Protein kinase C (PKC) 180 150 30
cAMP-dependent protein kinase (PKA) 178 167 11
Casein kinase II (CKII) 83 70 13
Calmodulin-dependent protein kinase II (CaM-II) 35 33 2
cGMP-dependence protein kinase (PKG) 26 23 3
Casein kinase I (CKI) 26 24 2
Cell division cycle protein kinase p34cdc2 23 16 7
Mitogen-activated protein kinase (MAPK) 8 7 1
Epidermal growth factor receptor (EGFR) 21 21
Tyrosine kinase Src 17 17
Insulin receptor (INSR) 13 13
dence Decomposition (MDD)7is a methodology to group an set of
aligned signal sequences to moderate a large group into subgroups that capture the most significant dependencies between positions. Furthermore, MDD was originally proposed to group the splice sites during the identification process of splice site prediction.7
However, in our study, we group protein sequences instead of nucleotides. To reduce the data complexity of the phosphorylated sites when doing MDD, we categorize the 20 types of amino acids into five groups such as neutral, acidic, basic, aromatic and imino groups, as the mapping given in Table S1 (see Supplementary Materials). Then, we implement the MDD algorithm for amino acids groups and apply it to the large sets of the phosphorylated sites for sequence clustering.
The MDD is a recursive process to divide the positive sets into tree-like subgroups. When applying MDD to cluster the sequences of a positive set, a parameter, that is, the minimum cluster size, should be set. If the size of a subgroup is less than the minimum cluster size, the subgroup will not be divided any more. The MDD process terminates when all the subgroup sizes are less than the minimum cluster size.
When considering a MDD-clustered data set, for instance, MDD-clustered PKA catalytic serine (S_PKA), the HMMs are trained separately from the subgroups of the phosphorylated sites resulted by MDD. Each model is used to search in the given
protein sequences for the phosphorylated sites. A positive predic-tion of the model group is defined by at least one of the model makes a positive prediction, whereas a negative prediction is defined as all the models make negative predictions.
Learning Models by HMMER
Profile Hidden Markov Models (HMMs) are trained from the site sequences in the positive sets. An HMM describes a probability distribution over a potentially infinite numbers of sequences.12It can
be used to detect distant relationships between amino acids sequences. Here, we use the software package HMMER12(version 2.3.2) to build
the models, to calibrate the models and to search the putative phos-phorylation sites against the test sets. The emission and transition probabilities are generated from each of the training set to capture the characteristics of the training sequences. All three residue types of the raw phosphorylation sites, the sets of the kinase-specific phosphory-lation sites, the MDD-clustered sets of the phosphoryphosphory-lation sites, and the MDD-clustered sets of the kinase-specific phosphorylation sites are taken as training sets to learn the models.
Evaluating the Trained Models
After the models are trained, it is necessary to evaluate whether the models are fitted or not. The following measures of the predictive performance of the models are then calculated: Precision (Prec)⫽ TP/(TP ⫹ FP), Sensitivity (Sn) ⫽ TP/(TP ⫹ FN), Specificity (Sp)⫽ TN/(TN ⫹ FP), and Accuracy (Acc) ⫽ (Sn ⫹ Sp)/2, where TP, TN, FP and FN are true positive, true negative, false positive, and false negative predictions, respectively. Especially, we make the equal sizes of the positive samples and the negative samples during the crossvalidation processes.
To evaluate the trained models, two crossvalidation methods, k-fold crossvalidation and leave-one-out crossvalidation, are ap-plied in this study. For a large positive set, that is, the number of a positive set of the phosphorylated sites is equal or greater than 30 sites, the fivefold crossvalidation is used to evaluate the model trained from the data set. The size of the negative set, which is constructed by randomly selected from the corresponding non-phosphorylation sites, is equal to the size of positive set. The experiments are repeated for 20 times and the average precision, sensitivity, specificity, and accuracy are calculated. Furthermore, to avoid a skewed sampling during the crossvalidation process, for a small positive set (less than 30), the leave-one-out crossvalida-tion is alternatively applied. Similarly, the negative set in this
Figure 1. The flow of the proposed method. [Color figure can be viewed in the online issue, which is available at www.interscience.wiley.com.]
Table 3. Data Sets Constructed in This Study.
Data sets Data sources No. of entries Descriptions
PB_Pos {S, T and Y} PhosphoBase 1083 Phosphorylation sites extracted from PhosphoBase SP_Pos {S, T and Y} Swiss-Prot 1607 Phosphorylation sites extracted from Swiss-Prot
Com_Pos {S, T and Y} PhosphoBase and Swiss-Prot 2460 Merge the PB_Pos and SP_Pos to an non-redundant positive set PB_Neg {S, T and Y} PhosphoBase 33,711 Non-phosphorylation sites extracted from PhosphoBase SP_Neg {S, T and Y} Swiss-Prot 69,193 Non-phosphorylation sites extracted from Swiss-Prot
crossvalidation is constructed by the same strategy as the fivefold crossvalidation.
Selecting the Trained Models
For each pair of the positive set and the negative set, we compare the performance of the models trained by HMMER from different data sources and with different grouping strategies, such as the raw phosphorylation sites, the kinase-specific phosphorylation sites, and MDD-clustered phosphorylation sites. For each positive set, the model with highest accuracy is selected.
Figure 2. The logos of the phosphorylated sites and the nonphosphorylated sites.
Figure 3. The logos of the phosphorylated serine sites of different catalytic kinases.
Figure 4. The logos of the phosphorylated threonine sites of different catalytic kinases.
Prediction by the Selected Models
For each kinase-specific positive set of the phosphorylated sites, the best performed model is selected and used to identify the phosphorylation sites within the input protein sequences by HMMsearch.12To search the hits of a model, HMMER returns
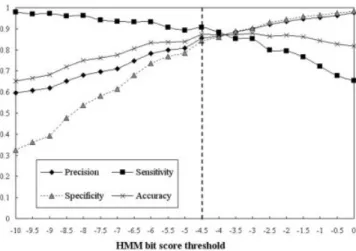
both a HMMER score and an expectation value (E-value). The score is the base two logarithm of the ratio between the probability that the query sequence is a significant match and the probability that it is generated by a random model. The E-value represents the expected number of sequences with a score greater than or equal to the returned HMMER bit scores. Although decreasing the E-value threshold favors finding true positives, increasing the E-value threshold favors finding true negatives. We select the HMMER score as the criteria to define a HMM match. A search of a model with the HMMER score greater than the threshold t is defined as a positive prediction, that is, a HMM recognizes a phosphorylation site. The threshold t of each model is decided by maximizing the accuracy measure during a variety of crossvalidations with the HMM bit score value range from 0 to⫺10. For instance, Figure 6 depicts the optimization of the threshold of the HMM bit scores in the S_PKA model. The threshold of the S_PKA model is set to ⫺4.5 to maximize the accuracy measure of the model.
The Interfaces
The users can submit their uncharacterizing protein sequences to the query interface and make a choice for the appropriate models to predict for kinase-nonspecific or kinase-specific serine, threonine, or tyrosine. Our system provides the positions of the candidate phosphorylation sites, as well as the catalytic protein kinases involved. The Web service is freely available at http://KinasePhos.mbc.NCTU.edu.tw/.
Results
The models perform well by incorporating kinase annotations. The three phosphorylated residue types in PB_Pos and PB_Neg are
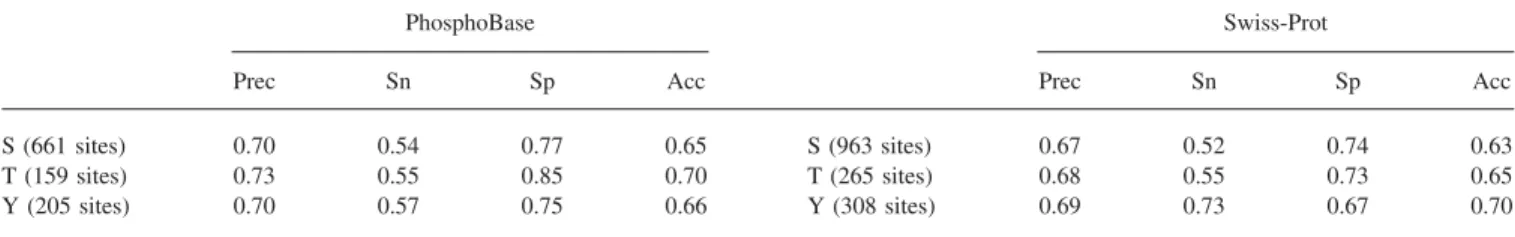
separately used to learn the models and then the models are evaluated by crossvalidations. Similarly, the same experiment is applied to SP_Pos and SP_Neg. The experimental results are given in Table 4. For instance, the precision (Prec), sensitivity (Sn), specificity (Sp), and accuracy (Acc) of the models trained from the serine-phosphorylation sites in PhosphoBase are 0.70, 0.54, 0.77, and 0.65, respectively. As to the consideration of kinase annota-tions, several experiments are also done in the kinase-specific groups in PB_Pos/PB_Neg and SP_Pos/SP_Neg data sets. As given in Table 5, the Prec, Sn, Sp, and Acc of the model trained from the S_PKA (kinase PKA catalytic serine) data set are 0.83, 0.81, 0.84, and 0.83, respectively. The averages of Prec, Sn, Sp, and Acc for all serine kinase types in PB_Pos/PB_Neg are 0.87, 0.74, 0.89, and 0.81, respectively. By comparing the results given in Tables 4 and 5, we find that the models trained from the kinase-specific groups of the phosphorylation sites perform better than the phosphorylated data sets without considering the protein kinases. As to the combined data sets from Swiss-Prot and Phos-phoBase, the results of the experiments in Com_Pos/Com_Neg data sets are partially provided in Table S2 (see Supplementary Material).
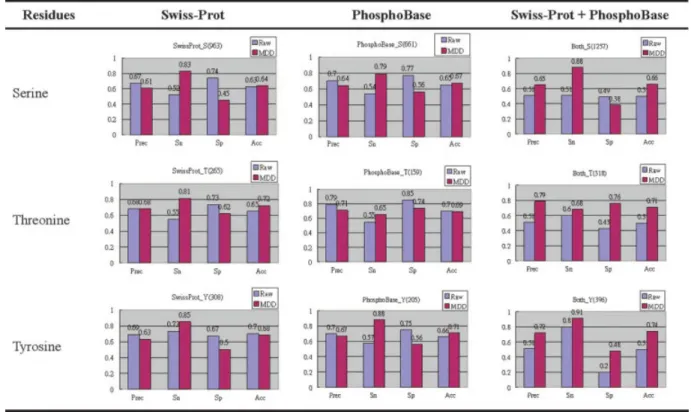
The models perform well in MDD-clustered data sets. Espe-cially in larger data sets (greater then 100 sites), we apply the MDD to group the sequences of the phosphorylated sites into several subgroups, which are separately taken as training sets, and HMM models for each subgroup are generated. Partial experiment results are given in Table S3, Table S4, and Table S5 (see Sup-plementary Material). Figures 7 and 8 show the model compari-sons between the original data sets and the MDD-cluster data sets. For the raw phosphorylation sets in PB_Pos, SP_Pos, and Com_Pos, all the models trained from MDD-clustered data sets have higher sensitivity than the ones trained from the data sets not applied MDD, but the models lose a little specificity, as shown in Figure 7. As for the kinase-specific groups of the phosphorylation serine sites, applying MDD in S_PKA, S_PKC, and S_CKII groups can increase the sensitivity of the trained models.
By comparing the results given in Figures 7 and 8, the accuracy of the models trained from the combined data sets in the raw
Figure 5. The logos of the phosphorylated tyrosine sites of different catalytic kinases. [Color figure can be viewed in the online issue, which is available at www.interscience.wiley.com.]
Figure 6. The optimization of the threshold of the HMM bit score in the S_PKA model.
sequences set experiments and the kinase-specific group experi-ments are better than the models trained from only PhosphoBase or Swiss-Prot data sets. Except for S_PKA and S_PKC in PB_Pos and SP_Pos, the sizes of the kinase-specific groups are relatively small. To avoid the skew sampling of the data, for small data sets like S_PKG, S_CaM-II, and S_CKII, it is necessary to merge the kinase-specific groups of phosphorylation sites from two different data sources into one group to increase size of the training set. All the kinase-specific data sets are constructed for learning compu-tational models, which are then evaluated. Alternatively, the MDD can be applied to the data sets that are large enough. For each kinase-specific group, the model with the highest accuracy is selected, as given in Table 6. For instance, the Prec, Sn, Sp, and Acc of the model trained from MDD-clustered S_PKA data set, which are constructed by the combined PhosphoBase and Swiss-Prot data sources, are 0.85, 0.91, 0.84, and 0.88, respectively. The threshold of the score of the model is set to be⫺4.5. The average Prec, Sn, Sp, and Acc of all the kinase-specific serine models are 0.88, 0.84, 0.88, and 0.86, respectively.
Assessment of Kinase Specificity
To assess the of the specific models, especially kinase-specific serine models, we take a particular group as the positive set and the other groups as the negative sets one by one. The higher specificity the crossvalidation, the less incorrect prediction of the phosphorylation sites in other groups. As given in Table 7, the number in the parenthesis besides the kinase name indicates the size of the positive set. For example, the first row gives that there are 232 phosphorylated sites in kinase PKA catalytic serine set. The sensitivity (Sn) of the PKA model is 0.89. The specificity are given in the table; for instance, in the first column the specificity (Sp) of PKC, PKG, and CaM-II sets corresponding to the PKA model are 0.51, 0.07, and 0.35, respectively. In particular, consid-ering the negative sets in basophilic group, the Sp values (in red color) resulted from the models trained from the positive sets in the same group are relatively lower than ones resulted from the neg-ative sets in the other groups. We observe that the specificity values corresponding to the kinase-specific data sets in the same
Table 4.The Model Evaluation of the Raw Data Sets Separately from PhosphoBase and Swiss-Prot.
PhosphoBase Swiss-Prot
Prec Sn Sp Acc Prec Sn Sp Acc
S (661 sites) 0.70 0.54 0.77 0.65 S (963 sites) 0.67 0.52 0.74 0.63
T (159 sites) 0.73 0.55 0.85 0.70 T (265 sites) 0.68 0.55 0.73 0.65
Y (205 sites) 0.70 0.57 0.75 0.66 Y (308 sites) 0.69 0.73 0.67 0.70
Table 5.The Model Evaluation of the Kinase-Specific Data Sets (HMM Bit Score Threshold t⫽ ⫺5).
Residues
PhosphoBase Swiss-Prot
Kinases Prec Sn Sp Acc Kinases Prec Sn Sp Acc
Serine S_PKA (166) 0.83 0.81 0.84 0.83 S_PKA (96) 0.88 0.74 0.90 0.82
S_PKC (142) 0.87 0.72 0.90 0.81 S_PKC (66) 0.86 0.68 0.88 0.78 S_PKG (23) 1.00 0.83 1.00 0.91 S_PKG (6) 1.00 0.50 1.00 0.75 S_CaM-II (33) 0.69 0.61 0.73 0.67 S_CaM-II (13) 1.00 0.69 1.00 0.85 S_CKI (23) 0.81 0.57 0.87 0.72 S_CKI (9) 0.83 0.56 0.89 0.72 S_CKII (62) 0.97 0.76 0.98 0.87 S_CKII (48) 0.88 0.64 0.90 0.77 S_cdc2 (15) 1.00 0.51 1.00 0.76 S_cdc2 (30) 0.96 0.81 0.97 0.89 S_MAPK (7) 1.00 0.71 1.00 0.86 S_MAPK (21) 1.00 0.73 1.00 0.86 Average 0.87 0.74 0.89 0.81 Average 0.90 0.70 0.91 0.81
Threonine T_PKA (11) 1.00 0.82 1.00 0.91 T_PKA (9) 1.00 0.78 1.00 0.89
T_PKC (29) 0.95 0.66 0.97 0.81 T_PKC (14) 0.71 0.36 0.86 0.61
T_CKII (13) 1.00 0.62 1.00 0.81 T_CKII (10) 1.00 0.62 1.00 0.81
T_cdc2 (7) 1.00 0.57 1.00 0.79 T_cdc2 (17) 1.00 0.82 1.00 0.91
T_MAPK (1) N/A T_MAPK (15) 0.78 1.00 0.93 0.90
Average 0.98 0.67 0.98 0.82 Average 0.92 0.69 0.95 0.82
Tyrosine Y_EGFR (21) 0.85 0.81 0.86 0.83 Y_EGFR (10) 0.67 0.80 0.60 0.70
Y_INSR (13) 0.80 0.62 0.85 0.73 Y_INSR (11) 1.00 0.55 1.00 0.77
Y_Src (17) 0.93 0.82 0.94 0.88 Y_Src (13) 0.70 0.54 0.77 0.65
Figure 7. Model comparisons between the original data sets and the MDD-clustered data sets (HMM bit score threshold t⫽ ⫺5). [Color figure can be viewed in the online issue, which is available at www.interscience.wiley.com.]
Figure 8. Serine model comparisons between the original data sets and the MDD-clustered data sets (HMM bit score threshold t⫽ ⫺5). [Color figure can be viewed in the online issue, which is available at www.interscience.wiley.com.]
group, such as basophilic, acidophilic and proline-directed group, are relatively lower than the specificity values resulted correspond-ing to the kinase-specific data sets in the other groups.
Discussion and Conclusion
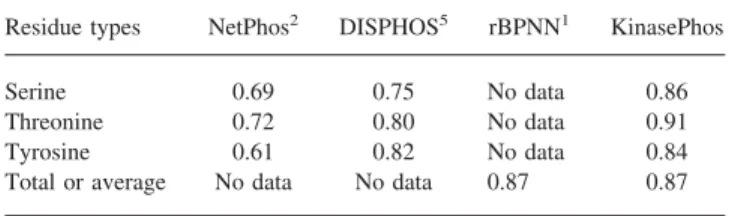
The proposed method is compared to several previously developed phosphorylation prediction tools such as NetPhos,2 DISPHOS,5
and rBPNN.1All the previous tools did not consider the catalytic
kinase annotations. Especially, in our investigation we construct the kinase-specific models for phosphorylation sites. We only compare our average accuracy from the best model selected in each kinase-specific model. As given in Table 8, the average accuracy of the models trained from serine, threonine, and tyrosine sets are 0.86, 0.91, and 0.84, respectively. The average accuracy
for KinasePhos is 0.87. All the accuracies of the serine, threonine, and tyrosine models are higer than NetPhos and DISPHOS. When comparing to rBPNN, the average accuracy of KinasePhos is equal to rBPNN.
Furthermore, we would like to test our trained models against those putative phosphorylated sites in Swiss-Prot.4 As given in
Table 1, the total number of putative phosphorylated sites anno-tated as “by similarity,” “potential,” or “probable” are 6343. Es-pecially, we construct the kinase-specific putative phosphorylated sites as kinase-specific test sets, which are then predicted by the trained kinase-specific models. For instance, in the experiment of S_PKA models and putative PKA catalytic serine sets, the positive rate is 0.87 as given in Table 9. However, the accuracy of the model trained from experimentally validated phosphorylated sites in Com_Pos is 0.88. We observed that the annotations of the putative phosphorylation sites in Swiss-Prot seem to be as accurate as the experimental validated kinase-specific phosphorylated sites in Swiss-Prot and PhosphoBase.
Based on the concept of profile Hidden Markov Models, a predictive tool for protein phosphorylation sites is designed and implemented to facilitate the identification of the phosphorylation sites and the catalytic kinases involved. After evaluating the trained models, we select the best model in each kinase-specific group and provide a Web-based prediction tool for accurately identifying protein phosphorylation sites. Rather than only consid-ering the three phosphorylated residues, the main contribution here is that we successfully develop a kinase-specific phosphorylation site prediction tool.
The prospective works to improve the accuracy of the predic-tive models are addressed as follows. First, the species-specific phosphorylation sites can be taken into consideration to assess the
Table 6. The Selected Models with the Highest Accuracy.
Kinases Data sources
Threshold (t) Prec Sn Sp Acc S_PKA* (232) Combined ⫺4.5 0.85 0.91 0.84 0.88 S_PKC* (176) Combined ⫺4.5 0.87 0.77 0.88 0.82 S_PKG (23) PhosphoBase ⫺9.5 0.94 0.96 0.93 0.95 S_CaM-II (37) Combined ⫺8.0 0.84 0.76 0.86 0.81 S_CKI (30) Combined ⫺7.0 0.82 0.65 0.86 0.76 S_CKII* (62) PhosphoBase ⫺3.5 0.95 0.79 0.96 0.87 S_cdc2 (43) Combined ⫺10 0.94 0.94 0.94 0.94 S_MAPK (27) Combined ⫺6.0 0.97 0.77 0.97 0.87 Average 0.88 0.84 0.88 0.86 T_PKA (19) Combined ⫺7.0 0.97 0.94 0.97 0.95 T_PKC (37) Combined ⫺8.5 0.85 0.83 0.85 0.84 T_CKII (13) PhosphoBase ⫺9.0 0.79 0.98 0.75 0.86 T_cdc2 (17) Swiss-Prot ⫺9.5 1.00 0.95 1.00 0.97 T_MAPK (15) Combined ⫺9.5 1.00 1.00 1.00 1.00 Average 0.91 0.92 0.91 0.91 Y_EGFR (30) Combined ⫺5.5 0.89 0.83 0.89 0.86 Y_INSR (16) Combined ⫺9.5 0.82 0.78 0.83 0.80 Y_Src (17) PhosphoBase ⫺5.0 0.86 0.81 0.87 0.84 Average 0.86 0.81 0.97 0.84
aMeans the data set is clustered by MDD.
Table 7. The Specificity of the Kinase-Specific Serine Models.
Neg. set Basophilic group Acidophilic group Proline-directed group
Pos. set PKA (232) PKC (176) PKG (27) CaM-II (37) CKI (30) CKII (85) CDC2 (43) MAPK (27)
PKA (232) Sn⫽ 0.89 0.51 0.07 0.35 0.83 0.97 0.97 0.98 PKC (176) 0.34 Sn⫽ 0.88 0.33 0.43 0.85 0.96 0.87 0.93 PKG (27) 0.47 0.84 Sn⫽ 0.91 0.49 0.97 0.98 1 1 CaM-II (37) 0.56 0.76 0.39 Sn⫽ 0.98 0.93 0.95 0.98 0.93 CKI (30) 0.82 0.9 0.94 0.89 Sn⫽ 0.91 0.55 0.94 0.96 CKII (85) 0.96 0.98 0.98 0.89 0.68 Sn⫽ 0.97 1 0.98 CDC2 (43) 0.98 0.96 1 0.96 1 0.99 Sn⫽ 0.98 0.37 MAPK (27) 0.98 0.98 0.98 0.99 0.98 0.98 0.56 Sn⫽ 0.89
Table 8. The Comparisons to NetPhos, DISPHOS, and rBPNN.
Residue types NetPhos2 DISPHOS5 rBPNN1 KinasePhos
Serine 0.69 0.75 No data 0.86
Threonine 0.72 0.80 No data 0.91
Tyrosine 0.61 0.82 No data 0.84
mechanisms of protein phosphorylation in different organisms. The accuracy of the models trained from a species-specific data set might be improved. Second, the structural properties, such as solvent accessibility, of the phosphorylated sites can be considered to possibly reduce those false positive predictions of phosphory-lated sites located in buried regions that are potentially to be nonphosphorylated sites. For proteins with known structures, the solvent accessibility of a phosphorylated site can be calculated trivially. However, as to the proteins without structures, the solvent accessibility of a residue should be computationally determined.
References
1. Berry, E. A.; Dalby, A. R.; Yang, Z. R. Comput Biol Chem 2004, 28, 75.
2. Blom, N.; Gammeltoft, S.; Brunak, S. J Mol Biol 1999, 294, 1351.
3. Blom, N.; Kreegipuu, A.; Brunak, S. Nucleic Acids Res 1998, 26, 382. 4. Boeckmann, B.; Bairoch, A.; Apweiler, R.; Blatter, M. C.; Estreicher, A.; Gasteiger, E.; Martin, M. J.; Michoud, K.; O’Donovan, C.; Phan, I.; Pilbout, S.; Schneider, M. Nucleic Acids Res 2003, 31, 365. 5. Iakoucheva, L. M.; Radivojac, P.; Brown, C. J.; O’Connor, T. R.;
Sikes, J. G.; Obradovic, Z.; Dunker, A. K. Nucleic Acids Res 2004, 32, 1037.
6. Hjerrild, M.; Stensballe, A.; Rasmussen, T. E.; Kofoed, C. B.; Blom, N.; Sicheritz–Ponten, T.; Larsen, M. R.; Brunak, S.; Jensen, O. N.; Gammeltoft, S. J Proteome Res 2004, 3, 426.
7. Burge, C.; Karlin, S. J Mol Biol 1997, 268, 78.
8. Kreegipuu, A.; Blom, N.; Brunak, S.; Jarv, J. FEBS Lett 1998, 430, 45. 9. Bairoch, A.; Apweiler, R. Nucleic Acids Res 1998, 26, 38. 10. Crooks, G. E.; Hon, G.; Chandonia, J. M.; Brenner, S. E. Genome Res
2004, 14, 1188.
11. Schneider, T. D.; Stephens, R. M. Nucleic Acids Res 1990, 18, 6097. 12. Eddy, S. R. Bioinformatics 1998, 14, 755.
Table 9. The Prediction Results of Putative Phosphorylation Sites Annotated as “by Similarity,” “Potential,” and “Probable” in Swiss-Prot.
Residue types Catalytic kinases Accuracy Threshold (t) No. of sites in the test set
No. of positive prediction Positive rates Serine S_PKA* (232) 0.88 ⫺4.5 412 358 0.87 S_PKC* (176) 0.82 ⫺4.5 164 123 0.75 S_PKG (23) 0.95 ⫺9.5 14 9 0.64 S_CaM-II (37) 0.81 ⫺8.0 19 18 0.95 S_CKI (30) 0.76 ⫺7.0 31 29 0.94 S_CKII* (62) 0.87 ⫺3.5 144 91 0.63 S_cdc2 (43) 0.94 ⫺10 44 41 0.93 S_MAPK (27) 0.87 ⫺6.0 44 40 0.91 Threonine T_PKA (19) 0.95 ⫺7.0 20 18 0.90 T_PKC (37) 0.84 ⫺8.5 59 48 0.81 T_CKII (13) 0.86 ⫺9.0 29 19 0.66 T_cdc2 (17) 0.97 ⫺9.5 29 29 1.00 T_MAPK (15) 1.00 ⫺9.5 31 31 1.00 Tyrosine Y_EGFR (30) 0.86 ⫺5.5 12 12 1.00 Y_INSR (16) 0.80 ⫺9.5 39 39 1.00 Y_Src (17) 0.84 ⫺5.0 6 2 0.33


![Figure 1. The flow of the proposed method. [Color figure can be viewed in the online issue, which is available at www.interscience.wiley.com.]](https://thumb-ap.123doks.com/thumbv2/9libinfo/7650747.139281/4.891.75.423.117.397/figure-proposed-method-color-figure-viewed-available-interscience.webp)