Regional Effects of Monetary Policy in the Netherlands
Ivo J. M. Arnold
Center for Finance, Universiteit Nyenrode, The Netherlands Evert B. Vrugt*
Center for Finance, Universiteit Nyenrode, The Netherlands
Abstract
This paper measures the impact of monetary policy shocks on regional and sectoral out-put in the Netherlands for the period 1973 to 1993. We document large regional and sectoral variation in monetary policy transmission. Our results support previous findings that the dif-ferential regional effects of monetary policy are significantly related to industrial composi-tion. We also find that sectoral effects account for much more of the variation in interest sen-sitivity than regional effects. Finally, we explore whether sectors which react more strongly to interest rate shocks are compensated by higher returns.
Key words: monetary transmission; sectoral effects; regional effects JEL classification: E50; R10
1. Introduction
In recent years, research into the regional effects of monetary policy has been stimulated by two developments. First, economic theory has been enriched with new insights on the role of credit market imperfections in the monetary transmission process. Second, in the Economic and Monetary Union (EMU), the question has risen whether a common monetary policy will have a differential impact across member states. When one size doesn’t fit all, this may complicate macro-economic management for the European Central Bank (ECB), as the ECB will have to weigh the varying consequences of its actions on EMU countries. For the ECB, it is there-fore important to understand how interest rates affect the euro area. The large litera-ture on monetary transmission in the euro area is surveyed in, e.g., Favero and Giavazzi (1999) and Eijffinger and De Haan (2000). The focus of most empirical studies in this area is on cross-country differences in monetary transmission between EMU member states. As the nation state is still a force to be reckoned with, this
Received October 19, 2002, revised February 25, accepted April 8, 2002.
*Correspondence to: Universiteit Nyenrode, Straatweg 25 3621 BG Breukelen, The Netherlands. Email: [email protected]. We thank the referees and the editor for helpful comments and suggestions.
cus is understandable. Yet, the reliance on cross-country evidence risks overstating the importance of cross-country differences. Documenting regional variation in monetary policy transmission within countries may therefore put the cross-country variation in a different perspective: if existing monetary unions have coped with differential regional effects in the past, maybe EMU can cope with them in the fu-ture.
The first contribution of this paper is to present new empirical evidence on the regional differential effects of monetary policy for the Netherlands. For this we em-ploy a data set spanning the period 1973 to 1993 and covering 11 regions and 12 sectors. We then report additional empirical evidence on the importance of industrial composition for the regional transmission of monetary policy, building on earlier work by Ganley and Salmon (1997), Carlino and DeFina (1998), and Hayo and Uhlenbrock (2000). These studies point to industrial composition as an important explanatory variable for the regional transmission of monetary policy in respectively the United Kingdom, the United States, and Germany. Our final contribution is a preliminary investigation into the question whether industries which suffer dispro-portionately from the impact of monetary policy shocks are compensated by higher average returns. In other words, we try to apply the risk-return trade-off to the dif-ferential effects of monetary policy.
The organization of this paper is as follows. The next section briefly reviews what may cause differential effects of monetary policy and surveys some recent em-pirical work in this area. Section 3 contains the emem-pirical evidence. Section 4 con-cludes.
2. Differential Effects of Monetary Policy
The monetary transmission mechanism can be defined as the process through which monetary policy decisions are transmitted into changes in economic growth and inflation [Taylor (1995)]. In most empirical work, monetary policy decisions are modeled as changes in the short-term interest rate set by the central bank [Leeper, Sims, and Zha (1996)]. These affect aggregate demand through a large set of vari-ables, including the real cost of capital, the real exchange rate, income, wealth, and credit availability. In view of the many excellent surveys in this area [e.g., Bernanke and Gertler (1995) and Mishkin (1996)], we will refrain from giving a complete overview. Instead, we will briefly discuss the factors which may give rise to differ-ential regional effects of monetary policy.
Firms differ with regard to their sensitivity to interest rate shocks, depending on their type of product and their leverage. A tightening of monetary policy may reduce demand for investment goods and (durable) consumer goods by increasing the real costs of capital of firms and consumers. Taylor (1995) provides a survey of the so-called interest rate channel. Regions with a high share of interest-sensitive indus-try may therefore be especially vulnerable to monetary tightening.
Monetary policy shocks also affect other asset prices, such as exchange rates and equity prices. Through the exchange rate channel, monetary policy affects competitiveness and net exports. Regional effects may arise in the presence of
petitiveness and net exports. Regional effects may arise in the presence of cross-regional variation in openness; see Dornbusch, Favero, and Giavazzi (1998). A third channel of monetary transmission is the equity channel. It may work through Tobin’s q theory of investment demand or through a wealth effect on consumer de-mand; see Mishkin (1996). Regional differences in Tobin’s q or in the distribution of wealth may lead to regional effects.
Recently, economic theory has focused on the role of information problems in credit markets. This so-called credit view of monetary transmission identifies two transmission channels: the bank lending channel and the balance sheet channel. The former channel looks at the ability and willingness of banks to lend; see Kashyap and Stein (1997). As some borrowers (notably small firms) lack easy substitutes for bank loans, monetary policy may influence the economy through the supply of bank credit. Regional effects arise when regions differ in the dependence on and availabil-ity of bank credit. The balance sheet channel works through the net worth and cash flows of firms. An expansionary monetary policy will raise both, thereby reducing asymmetrical information problems in credit markets. As a result, lending and in-vestment spending may increase. In the credit view, differential regional effects of monetary policy may be attributed to cross-regional differences in financial structure. For these, several measures have been employed, including the proportion of small banks and small firms in an economy, the health of the banking sector, the availabil-ity of non-bank funding and the amount of collateral; see Kashyap and Stein (1997) and Dornbusch, Favero, and Giavazzi (1998). It can be argued that credit market imperfections can best be interpreted as factors that may amplify or propagate the more traditional effects of interest rate shocks, rather than as channels which work independently from other transmission channels [see Bernanke and Gertler (1995)].
All transmission channels described above relate to the effect of monetary pol-icy on aggregate demand. The final effect on output and prices is the result of the interaction of supply and demand. Differential effects of monetary policy could therefore also be the result of regional differences in the supply curve, which may be caused by, for instance, differences in the flexibility and institutional features of la-bor and product markets; see De Grauwe (2000).
The present paper adds to the literature on the disaggregated measurement of monetary policy transmission. Guiso, Kashyap, Panetta, and Terlizzese (1999) raise objections to the use of aggregate data in empirical studies of monetary transmission. In their view, the use of disaggregated data allows for a better identification of fac-tors which are deemed important in the process of monetary transmission. An early example of the disaggregated analysis of monetary transmission is Bernanke and Gertler (1995), who use a vector autoregressive (VAR) model to show the different impact of monetary policy on spending components (such as consumer durables, non-durable consumption, residential investment, and business fixed investment). Building on this, several studies have analyzed the impact of monetary policy on different sectors of the economy in more detail. Ganley and Salmon (1997) analyze industry data for the United Kingdom. Based on a VAR analysis over the period from 1970 to 1995, they show that the construction sector is the most
inter-est-sensitive sector, followed by the manufacturing industry, services, and agricul-ture. In contrast to Ganley and Salmon (1997), Hayo and Uhlenbrock (2000) focus on the manufacturing sector. Estimating a VAR model for 28 industries over the pe-riod from 1978 to 1994, their findings in general correspond to prior notions about the cyclicality of industries; e.g., the heavy industries react more strongly to interest rate shocks than the production of non-durables such as clothing and food. Dedola and Lippi (2000) estimate the effect of interest rate shocks on 21 manufacturing in-dustries in five OECD countries. Relating their estimated interest rate elasticities to a set of industry characteristics, they find that credit channel variables (firm size, borrowing capacity, and interest payment burden) are as significant as interest rate channel variables (durability and investment intensity). Taking a regional perspec-tive, Carlino and DeFina (1998) apply a two-stage procedure to measure and explain the differential regional effects of monetary policy in the United States. First, they use a VAR model to estimate cumulative impulse responses of state real personal income to a shock in the federal funds rate. Second, they try to link these impulse responses to a variety of interest channel and credit channel variables in a cross-section of states. They find that the regional share of manufacturing industry is the most important explanatory variable. Credit channel variables such as firm size are insignificant. Interest rate shocks have an especially strong impact on the state of Michigan, which has a large concentration of the car industry.
3. Empirical Evidence
Our empirical approach consists of three parts. First, we use a VAR model to measure the effects of monetary policy shocks on output for individual region-sector combinations and for regions and sectors separately. In the second part, we analyze the interest rate effects using the Carlino and DeFina (1998) procedure and an analysis of variance similar to Arnold (2000). Finally, we relate the interest rate ef-fects to production and wage growth to test the risk-return trade-off.
Annual data on regional and sectoral production are taken from the Dutch Bu-reau of Statistics (available at http://statline.cbs.nl/statweb/index.stm). The sample runs from 1973 to 1993. In principle, data are also available for 1995 and 1996 (but not for 1994). However, due to major changes in the industry classification, these data could not be linked to the earlier data. The classification contains 12 regions and 13 sectors. The “polder” region of Flevoland has been excluded as it has been reclaimed from the sea in recent history, its rapid economic development in the past three decades is due to structural factors, not to monetary policy shocks. The sector “other goods and services” has also been excluded: it is a composite category mak-ing up just 0.5% of total production. We end up usmak-ing data for 11 regions and 12 sectors. The production data have been deflated using the GDP deflator. Taking growth rates yields 'yi,j,t, which denotes real production growth of sector j in region
i for year t. The short-term nominal interest rate is,t – measured by the call money rate (IFS line 60B) – is used as our indicator of the stance of monetary policy. Using the KPSS test [Kwiatkowski et al. (1992)], we couldn't reject the null hypothesis of
stationarity for both 'yi,j,t and is,t. With one lag and no trend, the KPSS test statistics are 0.152 for 'y (for the Netherlands as a whole) and 0.186 for the level of the in-terest rate. The 5% critical value is 0.463. Applying the ADF-test yields the same conclusion. The absence of a unit root in is,t precludes a cointegration analysis.
Our VAR model consists of four variables: aggregate Dutch real production growth (excluding sector j in region i), CPI-inflation, 'yi,j,t, and is,t. Aggregate real production growth is included to increase the likelihood that monetary policy shocks are similar across regions, sectors, or region-sector combinations [cf. Carlino and DeFina (1998)]. CPI-inflation is included as an additional macro-economic control variable. We should note as a caveat that the use of annual data severely limits the degrees of freedom. As a result we cannot include as many control variables as comparable VAR studies on quarterly data typically do. The four-variable VARs have been estimated for 11 regions, 12 sectors, and 132 region-sector combinations. In addition, for the Netherlands as a whole, a three-variable VAR has been estimated with aggregate Dutch real production growth, CPI-inflation, and is,t. The VAR mod-els have been estimated over the period 1973-1993 and include two lags. We meas-ure the interest rate effects by calculating impulse responses over both a one-year and a two-year (cumulative) time horizon. The impulse responses measure the effect of a one standard deviation shock in is,t on 'yi,j,t. They have been calculated using the standard Cholesky orthogonalization of shocks using the above ordering. In this or-dering, shocks to aggregate real production growth and inflation come first and thus are contemporaneously unaffected by shocks to 'yi,j,t and is,t [cf. Dedola and Lippi (2000)]. We have experimented with switching the ordering of 'yi,j,t and is,t (with is,t at rank 3 and 'yi,j,t at rank 4), but this did not affect the results. The correlation coefficients between the impulse responses for the two different orderings were always higher than 0.95.
Tables 1A and 1B report the impulse responses. In most cases they have the an-ticipated negative sign, whereby a positive interest rate shock reduces real produc-tion growth. For the Netherlands as a whole, the one-year impulse response equals -0.60. As the standard deviation of is,t over the sample period equals 2.25, this im-plies that a one standard deviation shock in is,t reduces real production growth by 1.35 percentage points after one year. This increases to 1.87 percentage points after two years.
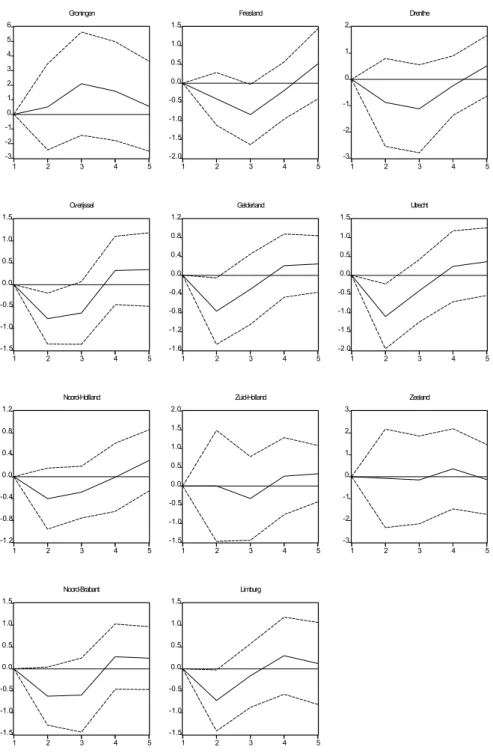
A notable exception to the negative relationship between interest rate shocks and production growth is the oil and gas sector. Higher interest rates will increase the opportunity costs of not extracting oil and minerals. Therefore, an increase in the interest rate may stimulate oil and gas production. Another reason why this sector moves against the grain is the oil crises in the 1970s, which had a positive impact on this sector, but not on the rest of the economy. The final columns of Tables 1A and 1B contain the results per region. Groningen is the only region with a positive inter-est coefficient, due to its huge natural gas production. All other regions have nega-tive interest coefficients. Figure 1 plots the impulse responses for the 11 regions over a five-year horizon, including two standard deviation error bands. There are notable differences across the regions.
Figure 1: Response of Real Production Growth to a one Standard Deviation Innovation in the Interest Rate
-3 -2 -1 0 1 2 3 4 5 6 1 2 3 4 5 Groningen -2.0 -1.5 -1.0 -0.5 0.0 0.5 1.0 1.5 1 2 3 4 5 Friesland -3 -2 -1 0 1 2 1 2 3 4 5 Drenthe -1.5 -1.0 -0.5 0.0 0.5 1.0 1.5 1 2 3 4 5 Overijssel -1.6 -1.2 -0.8 -0.4 0.0 0.4 0.8 1.2 1 2 3 4 5 Gelderland -2.0 -1.5 -1.0 -0.5 0.0 0.5 1.0 1.5 1 2 3 4 5 Utrecht -1.2 -0.8 -0.4 0.0 0.4 0.8 1.2 1 2 3 4 5 Noord-Hollland -1.5 -1.0 -0.5 0.0 0.5 1.0 1.5 2.0 1 2 3 4 5 Zuid-Holland -3 -2 -1 0 1 2 3 1 2 3 4 5 Zeeland -1.5 -1.0 -0.5 0.0 0.5 1.0 1.5 1 2 3 4 5 Noord-Brabant -1.5 -1.0 -0.5 0.0 0.5 1.0 1.5 1 2 3 4 5 Limburg
For Noord-Holland, Zuid-Holland, and Zeeland, the impulse responses are small and insignificant. In contrast, the impact of interest rate shocks is much stronger in Friesland, Overijssel, Gelderland, Utrecht, and Noord-Brabant. As dis-cussed, the positive impulse responses for Groningen are related to its production of natural gas.
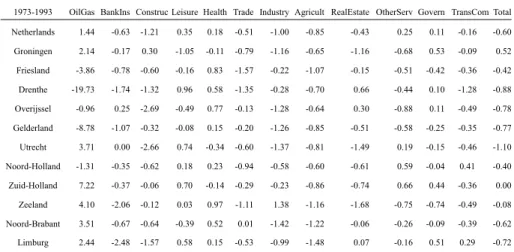
Table 1A. Impulse Responses (One-Year)
1973-1993 OilGas BankIns Construc Leisure Health Trade Industry Agricult RealEstate OtherServ Govern TransCom Total Netherlands 1.44 -0.63 -1.21 0.35 0.18 -0.51 -1.00 -0.85 -0.43 0.25 0.11 -0.16 -0.60 Groningen 2.14 -0.17 0.30 -1.05 -0.11 -0.79 -1.16 -0.65 -1.16 -0.68 0.53 -0.09 0.52 Friesland -3.86 -0.78 -0.60 -0.16 0.83 -1.57 -0.22 -1.07 -0.15 -0.51 -0.42 -0.36 -0.42 Drenthe -19.73 -1.74 -1.32 0.96 0.58 -1.35 -0.28 -0.70 0.66 -0.44 0.10 -1.28 -0.88 Overijssel -0.96 0.25 -2.69 -0.49 0.77 -0.13 -1.28 -0.64 0.30 -0.88 0.11 -0.49 -0.78 Gelderland -8.78 -1.07 -0.32 -0.08 0.15 -0.20 -1.26 -0.85 -0.51 -0.58 -0.25 -0.35 -0.77 Utrecht 3.71 0.00 -2.66 0.74 -0.34 -0.60 -1.37 -0.81 -1.49 0.19 -0.15 -0.46 -1.10 Noord-Holland -1.31 -0.35 -0.62 0.18 0.23 -0.94 -0.58 -0.60 -0.61 0.59 -0.04 0.41 -0.40 Zuid-Holland 7.22 -0.37 -0.06 0.70 -0.14 -0.29 -0.23 -0.86 -0.74 0.66 0.44 -0.36 0.00 Zeeland 4.10 -2.06 -0.12 0.03 0.97 -1.11 1.38 -1.16 -1.68 -0.75 -0.74 -0.49 -0.08 Noord-Brabant 3.51 -0.67 -0.64 -0.39 0.52 0.01 -1.42 -1.22 -0.06 -0.26 -0.09 -0.39 -0.62 Limburg 2.44 -2.48 -1.57 0.58 0.15 -0.53 -0.99 -1.48 0.07 -0.16 0.51 0.29 -0.72
From Table 1A we may conclude that the construction sector has the highest interest rate sensitivity. Also strongly interest sensitive are trade, industry, and the financial and agricultural sectors. Considerably less interest sensitive are the gov-ernment, health, and leisure sectors and the category “other services.” For the two-year time horizon, the results are qualitatively similar, although the much higher values for the construction sector are remarkable; see Table 1B. Overall, the results are in line with previous results for the United States and the United Kingdom.
Next, we try to establish a relationship between the impulse responses and variables measuring the regional industrial composition, using the cross-section ap-proach in Carlino and DeFina (1998). In contrast to Carlino and DeFina (1998), we do not include financial structure variables, as the Dutch financial sector is domi-nated by a few large nationally operating banks. With respect to the number of small firms we lack regional data. Sectoral data on firm size were available, but did not provide additional insights.
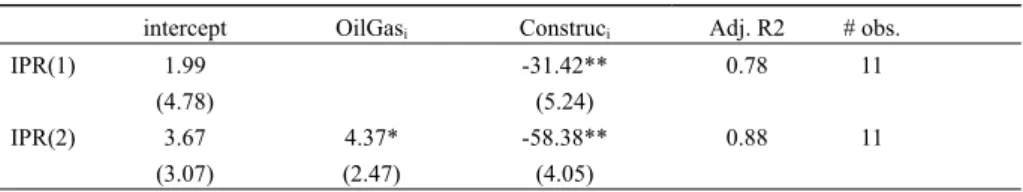
On the basis of correlation coefficients between the impulse responses and a sector's share in regional production (not reported here), we have selected the share of oil and natural gas production (OilGasi) and the share of construction activity (Constri) in regional production as our explanatory variables in the cross-section regressions. Panel A in Table 2 gives an overview of the final regression results.
Constri is strongly related to the regional impulse responses. Its negative coefficient implies that a higher share of construction in regional production leads to a more negative impulse response (i.e., to a stronger impact of monetary policy shocks).
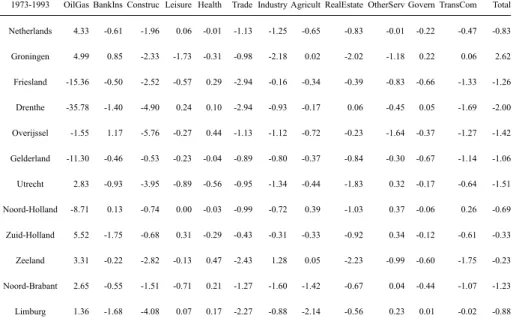
Table 1B. Impulse Responses and Industrial Composition
1973-1993 OilGas BankIns Construc Leisure Health Trade Industry Agricult RealEstate OtherServ Govern TransCom Total
Netherlands 4.33 -0.61 -1.96 0.06 -0.01 -1.13 -1.25 -0.65 -0.83 -0.01 -0.22 -0.47 -0.83 Groningen 4.99 0.85 -2.33 -1.73 -0.31 -0.98 -2.18 0.02 -2.02 -1.18 0.22 0.06 2.62 Friesland -15.36 -0.50 -2.52 -0.57 0.29 -2.94 -0.16 -0.34 -0.39 -0.83 -0.66 -1.33 -1.26 Drenthe -35.78 -1.40 -4.90 0.24 0.10 -2.94 -0.93 -0.17 0.06 -0.45 0.05 -1.69 -2.00 Overijssel -1.55 1.17 -5.76 -0.27 0.44 -1.13 -1.12 -0.72 -0.23 -1.64 -0.37 -1.27 -1.42 Gelderland -11.30 -0.46 -0.53 -0.23 -0.04 -0.89 -0.80 -0.37 -0.84 -0.30 -0.67 -1.14 -1.06 Utrecht 2.83 -0.93 -3.95 -0.89 -0.56 -0.95 -1.34 -0.44 -1.83 0.32 -0.17 -0.64 -1.51 Noord-Holland -8.71 0.13 -0.74 0.00 -0.03 -0.99 -0.72 0.39 -1.03 0.37 -0.06 0.26 -0.69 Zuid-Holland 5.52 -1.75 -0.68 0.31 -0.29 -0.43 -0.31 -0.33 -0.92 0.34 -0.12 -0.61 -0.33 Zeeland 3.31 -0.22 -2.82 -0.13 0.47 -2.43 1.28 0.05 -2.23 -0.99 -0.60 -1.75 -0.23 Noord-Brabant 2.65 -0.55 -1.51 -0.71 0.21 -1.27 -1.60 -1.42 -0.67 0.04 -0.44 -1.07 -1.23 Limburg 1.36 -1.68 -4.08 0.07 0.17 -2.27 -0.88 -2.14 -0.56 0.23 0.01 -0.02 -0.88
In addition, OilGasi appears to be significant for the two-year impulse re-sponses. The finding that construction activity reacts strongly to interest rate shocks corresponds to the results in Ganley and Salmon (1997). The significance of OilGasi corresponds to the US results in Carlino and DeFina (1998). In contrast to Carlino and DeFina (1998), the share of industry in regional production does not signifi-cantly enter the cross-section regressions. This is caused by two factors. First, the province of Zeeland is an outlier, having both a high share of industry and small impulse responses. Second, in this small cross-section, the effect of industry may have been overshadowed by the strong effect of construction.
We have also carried out an analysis of variance to test whether region- or sec-tor-specific influences are the main source of variation in interest rate effects. As the oil and natural gas sector represents an extremely small part of production in most Dutch regions and its impulse responses are therefore less reliable – witness, for example, the extreme estimates for Drenthe – we have excluded this sector from the analysis of variance. This means that the analysis of variance is based on the impulse responses of 121 region-sector combinations. Panels B and C in Table 2 show that the hypothesis that, ceteris paribus regional differences, all sectors have identical impulse responses is rejected at a 1% significance level. On the other hand, the hypothesis that, ceteris paribus sectoral differences, all regions have identical impulse responses cannot be rejected. We conclude that sector-specific variation in interest sensitivity is more important than region-specific variation. This conclusion holds both for the one-year and the two-year cumulative impulse responses.
Table 2. Impulse Responses and Industrial Composition
Panel A. Cross-section regressions: dependent variable is one-year (IPR(1)) or two-year (IPR(2)) cumulative impulse response
intercept OilGasi Construci Adj. R2 # obs.
IPR(1) 1.99 -31.42** 0.78 11
(4.78) (5.24)
IPR(2) 3.67 4.37* -58.38** 0.88 11
(3.07) (2.47) (4.05)
Panel B. Analysis of variance: one-year impulse responses
Source of variation Sums of Squares Degrees of Freedom Mean Squares F-ratios P-value
Regions 2.30 10 0.23 0.53 0.87
Sectors 20.56 10 2.06 4.71** 0.00
Error 43.66 100 0.44
Total 66.52 120
Panel C. Analysis of variance: two-year cumulative impulse responses
Source of variation Sums of Squares Degrees of Freedom Mean Squares F-ratios P-value
Regions 8.41 10 0.84 1.12 0.35
Sectors 64.27 10 6.43 8.59** 0.00
Error 74.80 100 0.75
Total 147.48 120
Note: t-statistics are in parentheses; * is significant at a 5% level; ** is significant at a 1% level.
We now turn to the risk-return trade-off. A basic economic insight is that eco-nomic agents who voluntarily take on more risk expect to be compensated by a higher return. In so far as sectoral or regional vulnerability to monetary policy shocks results from the free choice of employees regarding their occupation, the theory of compensating wage differentials would predict this risk to be priced. Note that it is hard for employees to diversify their human capital, in contrast to the ease with which investors can reduce risk by diversifying their financial assets. There is indeed some evidence in the literature that this risk is priced. For example, Abowd and Ashenfelter (1981) show that durable manufacturing industries and construction face higher unemployment risk than the government and the professional services industries and that the labor market offers compensating wage differentials.
In the remainder, we explore the risk-return trade-off using the sectoral impulse responses as our measure of risk. We note that our contribution is a first and pre-liminary step. A full investigation of the relationship between the impulse responses and compensating wage differentials would require an expanded data set, including more observations and many other variables which may influence this relationship. This is beyond the scope of the present study. We do, however, take into account the important effect of differences in skill levels on sectoral wages. To this end, we use data on the percentage of the labor force with higher education by sector. This information was kindly made available to us by the Dutch Bureau of Statistics.
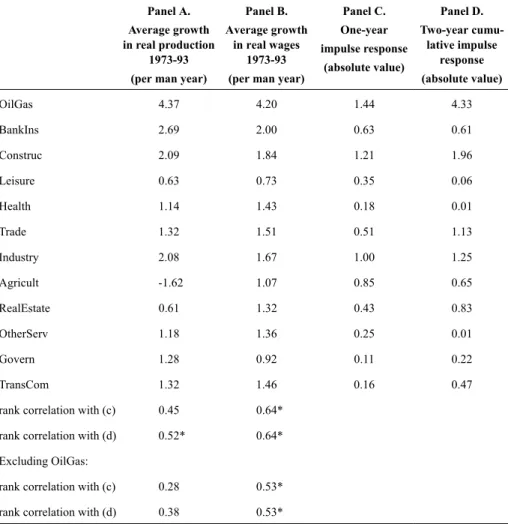
Table 3. The Risk-Return Trade-Off Panel A.
Average growth in real production
1973-93 (per man year)
Panel B. Average growth
in real wages 1973-93 (per man year)
Panel C. One-year impulse response (absolute value) Panel D. Two-year cumu-lative impulse response (absolute value) OilGas 4.37 4.20 1.44 4.33 BankIns 2.69 2.00 0.63 0.61 Construc 2.09 1.84 1.21 1.96 Leisure 0.63 0.73 0.35 0.06 Health 1.14 1.43 0.18 0.01 Trade 1.32 1.51 0.51 1.13 Industry 2.08 1.67 1.00 1.25 Agricult -1.62 1.07 0.85 0.65 RealEstate 0.61 1.32 0.43 0.83 OtherServ 1.18 1.36 0.25 0.01 Govern 1.28 0.92 0.11 0.22 TransCom 1.32 1.46 0.16 0.47
rank correlation with (c) 0.45 0.64* rank correlation with (d) 0.52* 0.64* Excluding OilGas:
rank correlation with (c) 0.28 0.53* rank correlation with (d) 0.38 0.53* Note: * is significant at a 5% level.
Panel A in Table 3 combines for all sectors the average real wage level (per man year) with our measure for skill level and with the absolute values of the im-pulse responses. In Panel B, we report the results of two regressions using the rank-ings of these variables. We use rankrank-ings because of the presence of one outlier (the oil and gas sector). The results are mixed: the two-year impulse responses are sig-nificantly related to the wage level, but the one-year impulse responses are not. In both regressions, our skill variable is significant at a level of at least 5%. All coeffi-cients have the correct sign, whereby an increase in skill level or risk increases wage levels. Considering the limited number of observations, some caution should be ex-ercised in interpreting the results in Table 3. Yet they do seem to offer some tenta-tive support for the risk-return trade-off. A more careful investigation of this issue would require a larger data set and is left for further research.
4. Conclusions
This paper measures the response of regional and sectoral output on monetary policy shocks in the Netherlands. We have documented the variation in the regional and sectoral transmission of monetary policy across 132 region-sector combinations. Our findings corroborate previous empirical results: the regional effects of monetary policy are significantly related to industrial composition. We also find that sectoral effects account for most of the variation in interest coefficients. In addition, we find weak support for the notion that workers in sectors which react more strongly to monetary policy shocks are compensated by higher average wage levels. Though the evidence is far from conclusive, some sectors are more risky but also better paid than others.
Governments may feel tempted to support regions which are hit hard by mone-tary policy shocks, for example through subsidies. Our findings suggest that, to the extent that regional differences are the result of differences in industrial composition, such intervention could distort the risk-return trade-off which economic agents face.
Appendix A Sector codes:
OilGas: Oil and natural gas production BankIns: Banking and insurance Construc: Construction activity Leisure: Culture, sports, and recreation Health: Health and veterinary services
Trade: Trade, hotel, and catering – and reparation industry Industry: Industry, public utilities, and other minerals Agricult: Agriculture, horticulture, and fishery RealEstate: Real estate and professional services OtherServ: Other services
Govern: Government
TransCom: Transport and communication services
References
Abowd, J. M. and O. Ashenfelter, (1981), “Anticipated Unemployment, Temporary Layoffs and Compensating Wage Differentials,” in Studies in Labour Markets, S. Rosen, ed., Chicago: The University of Chicago Press, 141-170.
Arnold, I. J. M., (2000), “The Industry Effects of Monetary Policy and Their Wel-fare Implications,” Banca Nazionale del Lavoro Quarterly Review, 214, 287-315.
Bernanke, B. S. and M. Gertler, (1995), “Inside the Black Box, The Credit Channel of Monetary Policy Transmission,” Journal of Economic Perspectives, 9,
27-48.
Carlino, G. and R. DeFina, (1998), “The Differential Regional Effects of Monetary Policy,” Review of Economics and Statistics, 80, 572-587.
De Grauwe, P., (2000), Economics of Monetary Union, Oxford: Oxford University Press.
Dedola, L. and F. Lippi, (2000), “The Monetary Transmission Mechanism: Evidence from the Industries of Five OECD Countries,” Temi di Discussione, No. 389, Rome: Banca D'Italia.
Dornbusch, R., C. Favero, and F. Giavazzi, (1998), “Immediate Challenges for the ECB,” Economic Policy, April, 17-63.
Eijffinger, S. C. W. and J. de Haan, (2000), European Monetary and Fiscal Policy, Oxford: Oxford University Press.
Favero, C. and F. Giavazzi, (1999), “An Evaluation of Monetary Policy Transmis-sion in the Context of the European Central Bank,” Report to the European
Parliament.
Ganley, J. and C. Salmon, (1997), “The Industrial Impact of Monetary Policy Shocks: Some Stylised Facts,” Bank of England Working Paper, 68. Guiso, L., A. K. Kashyap, F. Panetta, and D. Terlizzese, (1999), “Will a Common
European Monetary Policy have Asymmetric Effects?” Economics Perspectives, Federal Reserve Bank of Chicago, 56-75.
Hayo, B. and B. Uhlenbrock, (2000), “Sectoral Effects of Monetary Policy in Ger-many,” in Regional Aspects of Monetary Policy in Europe, von Hagen, J. and C. Waller, eds., Dordrecht: Kluwer Academic Publishers, 127-158.
Kashyap, A. K. and J. C. Stein, (1997), “The Role of Banks in Monetary Policy: a Survey with Implications for European Monetary Union,” Economic
Perspec-tives, Federal Reserve Bank of Chicago, September/October, 2-18.
Kwiatkowski, D., P. C. B. Phillips, P. Schmidt, and Y. Shin, (1992), “Testing the Null Hypothesis of Stationarity Against the Alternative of a Unit Root,”
Jour-nal of Econometrics, 54, 159-178.
Leeper, E.M., C.A. Sims, and T. Zha, (1996), “What Does Monetary Policy Do?”
Brookings Papers on Economic Activity, 2, 1-78.
Mishkin, F., (1996), “The Channels of Monetary Transmission: Lessons for Mone-tary Policy,” Banque de France Bulletin: Digest, 27, 33-44.
Taylor, J., (1995), “The Monetary Transmission Mechanism: an Empirical Frame-work,” Journal of Economic Perspectives, 9, 11-26.