行政院國家科學委員會專題研究計畫 成果報告
應用信號偵側理論評估介面複雜度對視覺搜尋表現之影響
研究成果報告(精簡版)
計 畫 類 別 : 個別型 計 畫 編 號 : NSC 98-2410-H-009-018- 執 行 期 間 : 98 年 08 月 01 日至 100 年 01 月 31 日 執 行 單 位 : 國立交通大學通識教育中心 計 畫 主 持 人 : 廖敏如 共 同 主 持 人 : 許清芳 計畫參與人員: 碩士班研究生-兼任助理人員:法諾昕 處 理 方 式 : 本計畫可公開查詢中 華 民 國 100 年 01 月 14 日
1 Table of Contents Introduction ………..…… 4 Method……….10 Experiment 1 ………...10 Experiment 2………12 Experiment 3………13 Results………..14 Experiment 1 ………...14 Experiment 2………15 Experiment 3………16
Conclusions and discussions………22
2
Figures
Figure 1. Experiment 1 display with 36 icons ……...24 Figure 2. Experiment 2 display with 24 icons and 2 different icon colors …………..25 Figure 3. Experiment 3 display with 36 icons and a high clutter background graphs..26 Figure 4. Hit rates of the three graphical background conditions in Experiment 3…..27 Figure 5. d’ values for the three graphical background conditions in Experiment 3…28 Figure 6. ROC curves for Experiment 1 and Experiment 2………..29 Figure 7. ROC curves for Experiment 1 and Experiment 3………..30 Figure 8. Response accuracy for the 9 experimental conditions in Experiment 4……31 Figure 9. False alarm rates for the 9 experimental conditions in Experiment 4……....32 Figure 10. d’ values for the 9 experimental conditions in Experiment 4………...33 Figure 11. β values for the 9 experimental conditions in Experiment 4………34 Figure 12. ROC curves for the 9 experimental conditions in Experiment 4…………..35
3
Tables
Table 1. Summary of the average d’ and β values for all the experimental conditions for the four experiments………...………36
4
Introduction
Advanced technology enables us to present ample and multifaceted information on computer-based interfaces. However, more does not mean better. For instance, demands from a complex interface system may exceed users’ perceptual limitations, memory load, and cognitive capacities, and thus degrade task performance. To develop an effective interface system, a designer needs to ensure that the demands from the system will not exceed users’ capacity limitations and mental resources. The goal of the preset study was to investigate the impacts of perceptual complexity on users’ target detection performance within a computer display. Participants’ task was to detect a target icon among alternative icons on a computer display. Signal detection theory which nicely distinguishes
observers’ perceptual sensitivity and decision criterion in detecting a signal among noise provides an ideal methodology in the preset study. Of specific interests therefore were the changes in users’ perceptual sensitivity (d’) and decision criterion (β) under different levels of perceptual complexity on a computer display.
Complexity
The definitions and measures of complexity from different aspects such as
information complexity, cognitive complexity, and display complexity were reviewed by Xing (2005). For example, from the perspective of information theories, Kolmogorov complexity is defined as the minimum possible length of a description in some language (Casti, 1979). On the other hand, cognitive complexity focuses on the complexity from the perspective of the user. Therefore, Halford, Wilson, and Phillips (1998) defined cognitive complexity as relational complexity, that is, the number of interacting variables that must be presented in parallel to perform a task. Studying display complexity, Tullis (1985, 1986) found that four display characteristics, overall density, local density, grouping, and layout complexity, could predict users’ search time to locate items on the display and their subjective rating. On the other hand, Klinger and Salingaros (2000) proposed a pattern complexity index based on the visual features such as size, density, line curvature, color, symmetry, similarity of shapes, and correctness of form.
Based on previous research on complexity, Xing (2005) summarized that complexity can eventually be identified from three basic aspects: numeric size of basic elements, variety, and structural rule or relation. Numeric size may to some degree correspond to
5
the degree of complexity. For example, larger numeric size could result in higher degree of complexity. But size is not a strong definition of complexity. Variety or disorder accounts for complexity too. Studies have shown that complexity lies somewhere between order and disorder (Drozdz, Kwapien, Speth, & Wojcik, 2002). Variety plus numeric size still are not sufficient to describe complexity. Relation or interconnections between items, i.e., structural rule, to some extent also contributes to the complexity. Xing (2005) eventually proposed that one can view complexity as a three-dimensional entity comprised of numeric size, variety, and relation. The contribution of each dimension to the entity depends on how the observer processes information and which aspects the observer is concerned with. Ultimately, Xing (2005) concluded that
complexity is the integration of the observer with these three basic factors under task requirements.
Xing (2004) further proposed that while evaluating an interface system, the three complexity factors should be evaluated at each of the three human information processing stages, perception, cognition, and action. This will result in a 3x3 matrix. For example, the size factor in perception is corresponding to the number of fixation groups on the display. A fixation group is defined as a set of visual stimuli that can be grabbed with one eye fixation. Variety factor in perception, on the other hand, is the differences in visual features such as element size, texture, luminance, contrast, and color. Finally, relation factor is evaluated in perception as the degree of clutter. Clutter is the mask of the visual perception of a stimulus with the presence of other stimuli. While evaluating the three complexity factors in cognition, numeric size, variety, and relation correspond to the number of independent elements in a given mental representation, the rate of information change over time, and the dimensionality of the relation in a task, respectively. For action, the three complexity factors correspond to the number of keystrokes, the number of
action transitions in a functional unit, and the degree of action depth needed to achieve the goal of a functional unit.
Target detection and Signal Detection Theory
Of interest in the present study was how the three complexity factors at the stage of perception such as number of eye fixation items, visual feature variety, and background graphs cluttered level affected users’ target detection performance within a
6
computer-based display. Visual search and detection of a target is a common activity we engage while interacting with a computer. Very often we have to search for and detect a desired icon on a computer display and then click on it for further operations. One may notice that in some situations this process may be influenced by the perceived complexity of a computer display. For example, we may find that searching within a simple website with only a few objects will be easier than searching within a complex website full of texts and graphs. While a delay in searching over a website may seem trivial, in some cases a little delay in detecting a target may become crucial. For instance, if the information presented to a pilot is perceptually too complex, it may exceed his
information processing limitations and as a result, he may miss or delay in responding to potentially threatening or critical situations.
Of primary interest in the present study therefore was whether the degree of perceptual complexity would affect our search and detection of a target icon within a computer display. Within this context, signal detection theory and methodology seem to provide us with a useful evaluation tool to address the questions of interest.
The application of signal detection theory in psychology lies primarily in detection and discrimination experiments (e.g., Swets, 1973; 1986, 1988b). For example, an observer is to discriminate whether a (weak) signal, which is embedded in noise, is present or not and to make a binary choice (yes or no). The combination of the presence and absence of the signal (signal vs. noise) and the binary responses (yes or no) produces four classes of joint events: hit, miss, false alarms, and correct rejection. Signal detection theory further breaks down the process of classification as signals or noise into two elements. The first element corresponds to sensitivity (d’), which is driven by the signal strength. The second element corresponds to the decision criterion (β), which is used to decide whether there is enough evidence to classify an observation as a signal or noise. A liberal criterion leads to more responses of ‘yes’ and thus results in both higher hit and false alarms rates. The opposite holds for a conservative criterion. The shifts of the criterion could be induced by instructions or payoff. Signal detection theory has been applied to many different situations such as detecting a threatened weapon by an airport security guard (Mackworth, 1984) or spotting a tumor on an x-ray film by a radiologist (e.g., Swets & Pickett, 1982).
7
A graphical representation known as receiver operating characteristics (ROC) in signal detection theory plots an observer’s hit rate against false alarm rate for different settings of decision criteria. Each signal detection condition generates one point on the ROC curve. If the signal strength and an observer’s sensitivity remain constant, changing criterion from one condition to another will produce different points along the ROC curve. Points in the lower left region of the ROC curve space indicate conservative criteria; whereas points in the upper right represent risky criteria. On the other hand, an observer with higher sensitivity level will have a more bowed ROC curve locating closer to the upper left region on the space. The ROC curve is thus very useful for a researcher to gain an insight into the joint effects of perceptual sensitivity and decision criterion.
Conventionally, the ROC curve in an experiment is obtained by requiring participants to rate the confident level of their yes/no responses.
In the present target detection task, participants were given a brief amount of time to inspect among alternatives for a target icon and reported with “yes” or “no” regarding to whether thetarget was present or absent. According to signal detection theory, two elements were involved in this detection process. One was participant’s perceptual sensitivity, which was determined by the distinction between the target icon and the alternative icons, and the other was their decision criterion, how liberal or conservative, they would respond with “yes”. The influences of perceptual complexity on the target detection process, therefore, may reflect on either one or both of these two elements. Of specific focus in the present study therefore were the changes of the perceptual sensitivity and decision criterion under different levels of perceptual complexity on a computer display.
Studies have used signal detection methodology measures and the ROC curve to evaluate display designs (e.g., Johnson, Jordan, Liao, & Granada, 2003;Liao, Johnson, & Granada, 2007). For example, Johnson et al. (2003) found that within a cockpit display, when a dimmer target was surrounded by brighter distractors, the delay of the target detection was due to the degraded perceptual sensitivity rather than the decision criterion. The concepts in signal detection theory are highly applicable in human factors research. It has two general benefits (Wickens & Hollands, 2000). One is that it provides a way to compare sensitivity and thus the quality of performance for given observers who may
8
have different decision/response biases. The other is that by partitioning performance into sensitivity and decision criterion, it can serve as a diagnostic tool to recommend more appropriate actions.
In the current experiments, we may speculate that a perceptually more complex display (with more objects, more feature varieties, or cluttered graphical background) will lower the response accuracy and alter the hit and false alarm rates in detecting a target icon. To understand the cause of the hit and false alarm rate alternation under
displays with different complexities, we need to differentiate the impacts of two elements, perceptual sensitivity and decision criterion, in the detection process. Distinguishing the roles of sensitivity and decision criterion in the preset experiments will provide us with valuable recommendations for interface designs, especially when either one element is particularly critical in those settings.
It appeared that young participants have various amounts of exposures and experiences with the computers and video games, and that resulted in big individual differences among participants’ performance. To address this issue, instead of calculating the perceptual sensitivity (d’) and decision criterion (β) from the conventional signal detection methodology, the present study adopted a nonlinear mixed-effect signal detection model proposed by Sheu, Lee, and Shih (2008) to estimate d’ and β.In their model, random effects were included to account for variations of hit and false alarm rates between participants. The premise is that participants may have different response
tendencies such that some are high responders, some are low responders, and some are medium responders. Each individual therefore are assumed to have their own
participants-specific mean hit and false alarm rates in their model. The formulation in Sheu et al.’s (2008) model assumes a normal distribution for d’ in the population and adjusts model parameter estimates as a function of both between- and within-participants variability in hit and false alarm rates. Their procedure directly estimates the parameters d’ and β in a signal detection model under considerations so that whether an experimental manipulation is better accounted for by a shift in sensitivity or by decision bias can be examined.
The preset study
9
complexity on the user’s perceptual sensitivity and decision criterion during target icon detection process on a computer display. Signal detection methodology was employed to examine the questions of interest. Factors of perceptual complexity, numeric size, color variety, and background graph clutter level were manipulated in the three experiments. The task employed was a target detection task where participants searched for a target icon among alternative icons on a computer display within a brief period of time and reported whether the target was present. Visual search is a common activity we engage in our daily use of computers. The present task was also a speeded task given that
participants had only a brief period of time to inspect the display. This time constraint and limitation would certainly reduce the accuracy of the detection of the target icon. In the present experiments reaction time, response accuracy, as well as hit and false alarm rates were primary measures, and signal detection theory measures d’ and β were further derived from the parameter estimates procedure in a nonlinear mixed-effects signal detection model (Sheu, et al., 2008). Those dependent measures were all examined in statistical analyses. Additionally, participants were also asked to rate the confident level of their yes/no responses from 1 to 6. The ROC curve therefore could also be plotted to further explore the relation between the sensitivity and decision criterion under different perceptual complexities.
In this study, the impacts of the three perceptual complexity factors on target detection performance were examined in three experiments. The first experiment examined the effect of numeric size on target detection performance. The second
experiment examined the effect of feature variety on target detection performance. Color was used to categorize groups of icons and was the perceptual complexity factor.
Cummings and Tsonis (2005) examined the effect of display complexity in air traffic controller environment by manipulating the color categories on the display. They found that up to six color categories on the display could benefit participants’ task performance, whereas more than six colors may eventually hurt performance. The processing limit for color variety on a computer display was further examined in the present study. The third experiment investigated the effect of background graph clutter level on target detection performance. Researchers have shown that the background graph clutter level delayed the search time (Grahame, Laberge, & Scialfa, 2004). In Grahame et al.’s (2004) experiment,
10
clutter was measured according to the percentage of the used or occupied space, including graphics and text. Occupied space was measured by outlining the text or graphics in pages and counting the pixels within those outlines areas. The present
experiment incorporated graphs on the display as a background and they occupied around 25% or 50 % of the display background space.
Summary
Complexity is an important issue in advanced interface design provided that it may influence the efficiency of the user-interface interactions. Xing (2004) proposed that, for any interface system, three complexity factors, numeric size, variety, and relation, need to be evaluated at each stage of information processing, perception, cognition, and action. The goal of the present study was to investigate the impacts of three complexity factors at the perceptual stage, numeric size, color variety, and background graph clutter level, on the user’s perceptual sensitivity and decision criterion during the detection of a target icon within a computer display. Three experiments were conducted, and signal detection theory paradigm and methodology were employed. The speeded target detection task was adopted where participants searched for a target icon among alternatives on the computer display within a limited time. Performance measures included reaction time, response accuracy, hit rate, false alarm rate, confidence rating, and signal detection measures d’ and β. Note that the present study adopted a nonlinear mixed-effects signal detection model proposed by Sheu, et al., (2008) to estimate parameters d’ and β. In Sheu, et al. (2008) model, participants’ individual differences were considered as a random factor. ROC curves were also plotted for further inspection of the relation between the
sensitivity and decision criterion for different complexity levels.
Method Experiment 1
Experiment 1 aimed to examine the perceptual complexity factor numeric size on target detection performance. The manipulations were the total number of icons on the display (12, 24, & 36) and the target location. The display was partitioned into four equal- sized regions (upper left, upper right, lower left, lower right) and the target
11
appeared equally often in each region to minimize possible location effects. The number of icons and the target location were within-participants variables. Participants’ reaction time, yes/no response, and the confidence rating of their response from 1 to 6 (least confidence to most confidence) were recorded by the computer. Figure 1 shows an example display where 36 icons are presented on the display.
Participants
Thirty-two college students participated in the experiment. Half of the participants were male and half of them were female. The average age was 21.
Stimuli and Apparatus
The stimulus display mimicked our computer desktop where numerous icons (12, 24, or 36) were placed across the display. The target icon that participants were to detect was shown in the beginning of each trial. The stimulus display containing 12, 24, or 36 icons then appeared after the target icon display. The target icon had 50% of probability to be present. When the target icon was present, it would appear equally often in each of the four equal-sized regions of the display to minimize possible location effects.
Procedure
All participants read and listened to a detailed account of the experimental
procedures before proceeding to the practice and experimental sessions. In each trial, a target icon first appeared alone on the display for participants to remember it. Participants could then press any key on the keyboard when they felt they were ready to proceed to the stimulus display. The stimulus display only appeared for about 60 ms. Up to 60 ms all the icons on the stimulus display were replaced by open circles. The circles served as a mask to eliminate any lingering sensory representation of the icons. Participants’ task was to make a “yes /no” judgment about the presence of a target icon. After responding “yes” or “no”, participants were further required to rate their confidence about their responses on a scale from one (least confident) to six (very confident). Half of the participants used the left mouse button to indicate a “yes” response and the right mouse button to indicate a “no” response, while the other half had these response buttons reversed.
Participants completed 24 practice trials first. In the practice trials, participants received a feedback after each trial where the stimulus display appeared again and the target icon was shown on the upper left region of the display. Participants then received 3
12
blocks of experimental trials after the practice. There were 1-minute breaks between each block. There were 72 trials in each block, with 24 trials for each of the experimental conditions (12, 24, and 36 icons). Among the 24 trials, 12 trials had the target icon present, 12 trials did not have the target icon. For the 12 target-present trials, the target icons were presented in the four equal-sized regions on the display equal amount of time. Trials with different experimental conditions were randomly presented within each block. Each participant therefore received a total of 240 trials in the whole experiment. The experiment finished within 40 minutes.
Experiment 2
Experiment 2 aimed to examine the perceptual complexity factors color variety on target detection performance. The manipulations therefore were the number of colors (2, 6, & 12) and the target location (upper left, upper right, lower left, lower right).
Twenty-four icons constantly appeared on the display. Whereas two, six, or 12 different colors were used to code the 24 icons into 12, four, or two different color groups, respectively. The number of color groups and target location were again
within-participants variables. Participants’ reaction time, yes/no response, and confidence ratings about their responses were recorded by the computer. Figure 2 shows an example display where there are two different color groups. Note that target icons which were shown in the beginning of the trial were black and white. In the stimulus display, icons with different colors were randomly placed within the display.
Participants
Thirty-two college students participated in the experiment. Half of the participants were male and half of them were female. The average age was 21.26
Stimuli and Apparatus
The stimulus display mimicked our computer desktop where 24 icons with different color coding were placed on the display. The target icon that participants were to detect appeared in the beginning of the trial with black and white color. The stimulus display could contain 2, 6, or 12 different colors of icons on the display. The target icon had 50% of probability to be present. When the target icon was present, it would appear equally often in each of the four equal-sized regions of the display to minimize possible location
13 effects.
Procedure
The procedure in the second experiment was the same as the first experiment except that now the three sets of 24 trials within each block corresponded to the 2-, 6-, and 12-color experimental conditions.
Experiment 3
Experiment 3 aimed to examine the perceptual complexity factor background graphs on target detection performance. The background graph clutter level was manipulated by adding graphical backgrounds on the display where 36 icons were placed. The clutter level measured with 25% coverage of the background space was classified as mid-level clutter and the clutter level measured with 50% coverage of the background space was classified as high-level clutter. The manipulations in the third experiment therefore were the level of clutter (none, mid, & high) and the target location (upper left, upper right, lower left, lower right). The clutter level and target location were again
within-participants variables. Participants’ reaction time, yes/no response, and confidence ratings were recorded by the computer. Figure 3 shows an example display with a
high-clutter level background. Participants
Thirty-two college students participated in the experiment. Half of the participants were male and half of them were female. The average age was 23.46.
Stimuli and Apparatus
The stimulus display mimicked our computer desktop where 36 icons were placed across the display. The target icon that participants were to detect appeared in the beginning of the trial. The stimulus display which could contain no, mid clutter level, or high clutter level of background graphs appeared after the target icon display. The target icon had 50% probability to be present in each trial. When the target icon was present, it would appear equally often in each of the four equal-sized regions of the display to minimize possible location effects.
Procedure
14
except that now the three sets of 24 trials within each block corresponded to the none, mid, and high clutter level of graphical background conditions.
Results
The reaction time, response accuracy, hit rate, and false alarm rate were computed for each participant in the three experiments. The signal detection measures d’ and β for each experimental condition (complexity level) in the three experiments were estimated from a nonlinear mixed-effect signal detection model proposed by Sheu, Lee, and Shih’s (2008). The ROC curves for each experiment were plotted based on the average of
participants’ confidence ratings. Repeated ANOVAs were conducted for the reaction time, response accuracy, hit rate, and false alarm rate. The independent variable was the
complexity factor in each experiment. Estimates of d’ and β for each complexity level were pair-tested by t-tests for any significant difference in each experiment.
Experiment 1 ANOVAs for dependent measures
In the present ANOVA s, the degrees of freedom and F values from
Greenhouse-Geisser correction were used and reported if the assumption of sphericity was violated.
Among all the dependent measures, only the analysis for the false alarm rate showed a significant complexity effect in Experiment 1 (F(1.7,62)=6.1, p<.01; mean=0.19 vs. 0.16 vs. 0.21 for 12-icon, 24-icon, & 36-icon condition, respectively). Follow-up analyses showed that the false alarm rate for the 36-icon was significantly higher than that of the 24-icon condition (F(1,31)=11.29, p<.01) and the false alarm rate for the 24-icon condition was significantly higher than that of the 12-icon condition (F(1,31)=5.45, p<05). Increasing the number of distractor icons on the display was comparable to increasing the level of noise. Under the assumption of signal detection theory, increasing the level of noise will shift the noise distribution towards to the signal distribution, which could then result in the higher false alarm rate.
Analyses for reaction time, response accuracy, and hit rate did not show any
15
s, response accuracy was 75%, hit rate was 69%, and false alarm rate was 19%.
d’ and β estimates
For each experimental condition (complexity level), d’ and β were estimated from the nonlinear mixed-effect signal detection model (Sheu, et. al., 2008). Paired t-tests were further conducted to examine significance of differences between each pair of conditions (12-icon vs. 24-icon; 24-icon vs. 36-icon; 12-icon vs. 36-icon condition). None of the tests were significant. The estimates of d’ for the 12-icon, 24-icon, and 36-icon conditions were 1.94, 1.72, and 1.84, respectively. The estimates of β for the 12-icon, 24-icon, and 36-icon conditions were 1.86, 1.49, and 1.63, respectively.
It appeared that in this experimental setting participants could use the color of the target icon as a cue to search it on the stimulus display, pop-out effect or similar to pop-out effect may therefore occur from time to time. When that happened, the
perceptual sensitivity and decision criterion would not be affected by the total numbers of icons on the display. Because once the detection process mimicked a parallel search, the number of items would not matter anymore. This may explain why the false alarm rate significantly increased with the display with more icons, while the d’ and β analyses did not catch any effect.
Experiment 2 ANOVAs for dependent measures
Unfortunately the analyses for reaction time, response accuracy, hit rate, and false alarm rate did not reveal any significant effect. The average reaction time was 1.0 s, response accuracy was 60%, hit rate was 41%, and false alarm rate was 21%.
d’ and β estimates
For each experimental condition (complexity level), d’ and β were again estimated from the nonlinear mixed-effect signal detection model (Sheu, et. al., 2008). Paired t-tests were further conducted to examine significance of differences between each pair of conditions (2-color vs. 6-color; 6-color vs. 12-color; 2-color vs. 12-color condition). None of the tests were significant. The estimates of d’ for the 2-color, 6-color, and 12-color conditions were 0.67, 0.56, and 0.61, respectively. The estimates of β for the 2-color, 6-color, and 12-color conditions were 1.36, 1.27, and 1.26, respectively.
16
the trial was black and white. Therefore when participants were searching for the target on the stimulus display, they needed to search for it primarily based on its shape feature. Color therefore became an irrelevant dimension that needed to be ignored. As a result, the color coding may have less impact on the noise distribution, whereas the shapes of the target and distractor icon may now play a more important role in affecting the noise distribution. The fact that neither d’ nor β significantly changed with the color coding suggested that participants could suppress the irrelevant color dimension on the display during their search of the target, regardless of how many colors there were. The overall lower response accuracy comparing to that of Experiment 1 (60% vs. 75%) may be due to the difficulty of suppressing the color feature and doing the shape matching. Overall, it appeared thatnot only that these processes did not affect participants’ perceptual sensitivity, but also they did not shift participants’ decision criterion to any direction.
Experiment 3 ANOVAs for dependent measures
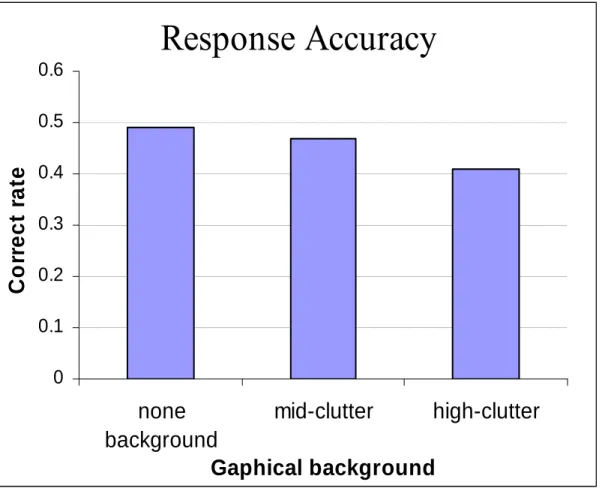
The analysis of the response accuracy showed a marginally significant
complexity effect (F(2,62)=3.07, p =0.05; mean=0.6 vs. 0.6 vs. 0.57 for none, mid-clutter, and high-clutter graphical background conditions, respectively). The follow-up analysis revealed that the correct rate of the high-clutter graphical background condition was significantly lower than that of the none background condition (F(1,31)=5.06, p<.05) and was close to significantly lower than the mid-clutter graphical background condition (p=.066)). The analysis of the hit rate also showed a significant complexity effect (F(2,62)=6.72, p<.01, mean=0.49 vs. 0.47 vs. 0.41 for the none, mid-clutter, and high-clutter graphical background conditions, respectively) (Figure 4). Follow-up
analyses revealed that the hit rate of the high-clutter graphical background condition was significantly lower than that of the none background and mid-clutter graphical
background conditions (F(1,31)=9.32, p< 0.01 for the comparison of high-clutter graphical background and none background condition; F(1,31)=8.62, p<.01 for the comparison of high-clutter and mid-clutter graphical background).
The average reaction time was 1.11 s, response accuracy was 59%, hit rate was 46%, and false alarm rate was 27%.
17
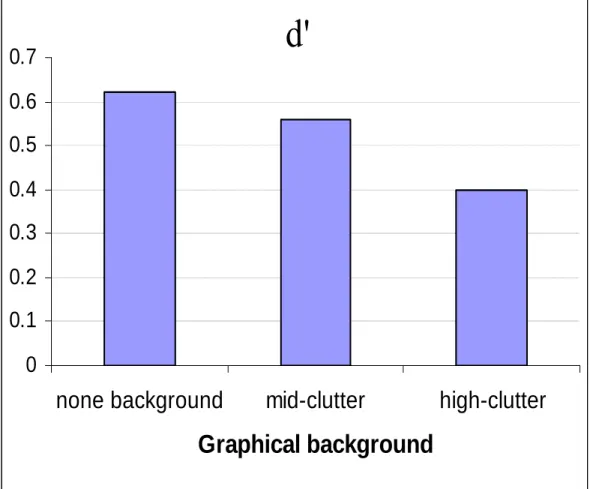
d’ and β estimates
For each experimental condition (complexity level), d’ and β were again estimated from the nonlinear mixed-effect signal detection model (Sheu, et. al., 2008). Paired t-tests were further conducted to examine significance of differences between each pair of conditions (none vs. mid-clutter; mid-clutter vs. high-clutter; none vs. high-clutter graphical background condition).
The paired t-tests revealed that the d’ of the high-clutter graphical background condition was significantly lower than that of the none background condition (t(62)=3.166, p <.01) and was also significantly lower than that of the mid-clutter graphical background condition (t(62)=2.2, p<.05) (Figure 5). The average d’s for the high-clutter, mid-clutter, and none graphical background conditions were 0.40, 0.56, and 0.62, respectively. None effect was shown for all the β analyses. The estimates of β for the none background, mid-clutter, and high-clutter graphical background conditions were 0.99, 1.22, and 1.09, respectively.
If the decision criterion was fixed, then the decrease of perceptual sensitivity will result in the lower hit rate. The current two analyses therefore agreed in that the high-clutter graphical background may have blurred the target, that is, reducing the strength of the signal, and thus decreased the perceptual sensitivity.
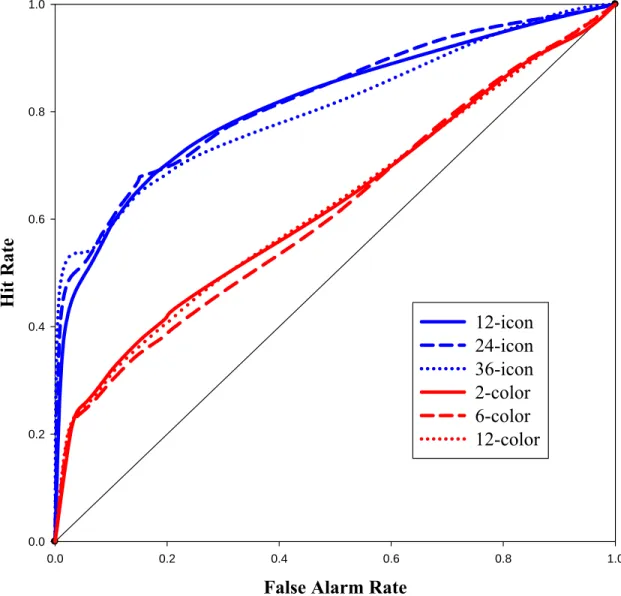
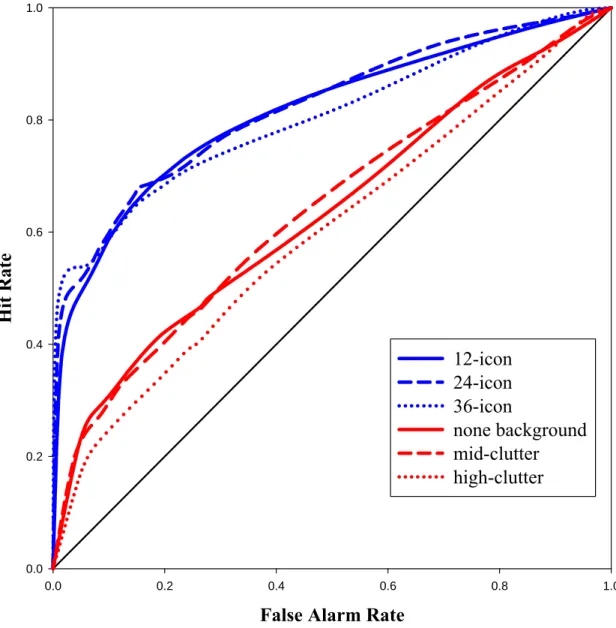
ROC curves for Experiment 1, 2, and 3
Each participant’s confidence ratings for yes and no responses were converted to 12 cutoff points from “most certain there was no target” to “most certain there was a target”. Assuming that these 12 cutoff points represented 12 decision criteria from the most conservative to the most liberal, ROC curves can be generated. Figure 6 shows the ROC curves for Experiment 1 and 2 for a comparison, and Figure 7 shows the ROC curves for Experiment 1 and 3 for a comparisonaveraging across all participants. As one can see, the areas under the curve, A’, which represents a non-parametric measure of sensitivity, were greater for Experiment 1 than for Experiment 2 and 3. This result thus agreed with the d’ estimates from the mixed-effect signal detection model (average of 1.83vs. 0.61. vs.0.53 for Experiment 1, 2, & 3, respectively).
The reason for the relatively higher perceptual sensitivity in Experiment 1 may be due to the pop-out effect. In Experiment 1 and 3, the target icon that participants saw in
18
the beginning of the trial was exactly the same as the one appeared within the stimulus display. Participants could therefore use color as a cue to detect the target icon, and this cue turned out to facilitate the detection process. In Experiment 1 when there was no background graph to mask icons, this pop-out effect was especially evident and resulted in a high discrimination, and thus high sensitivity, between the target and other
alternatives on the display. This pop-out effect did not work well in Experiment 3 since the background has now been cluttered with graphs and masked the target. The
discriminations among the target and alternative icons decreased and so did the perceptual sensitivity. Notice that the area under ROC curve for the high cluttered
background graphs was smallest (Figure 7). It again agrees with the d’ estimates from the mixed-effect signal detection model that the perceptual sensitivity was lowest in this condition.
Summary of Experiment 1, 2, and 3
Overall, Experiment 1, 2, and 3 suggested that as long as participants could use a pop-out effect to search the target on the display, the number of items on the display had a relatively minor impact on both the perceptual sensitivity and decision criterion in the target detection process. On the other hand, if participants had no idea about the color of the target and needed to search based on other features of the icon, then the color coding of both the target and distracting icons would not have any significant impact on
participants’ either perceptual sensitivity or decision criterion. The lower accuracy rate may be due to the difficulty of suppressing the color feature and to match the shape feature of the target and alternative icons. Finally, the background graphs appeared to reduce the discrimination between the target and alternative icons, i.e., lessen the strength of signal, and thus reduced participants’ perceptual sensitivity. However, participants’ decision criterion was not affected.
Experiment 4
The results from Experiment 1 and Experiment 3 suggested that increasing the number of distracting icons on the display may increase the noise level, whereas the background graphs may mask the visibility of icons and thus lessen the strength of the signal (target). A further question of interest therefore was whether there was any
19
interactive effect between the numerical size of icons and the background graphs on the display. That is, depending on different amount of icons on the display, could the background graphs have different impacts on participants’ perceptual sensitivity or decision criterion? Experiment 4 was conducted to answer this question. In Experiment 4, participants received three blocks of trials which corresponded to the three conditions of background graphs in Experiment 3: none background, mid-clutter, and high-clutter graphical background. Within each graphical background condition (block), participants received trials with the display of 12, 24, or 36 icons like in Experiment 1. Trials with different numbers of icons on the display were randomly presented within each graphical background conditions.
Participants
Twenty-four college students participated in the experiment. Half of the participants were male and half of them were female. The average age was 22.08.
Stimuli and Apparatus
The stimulus display had 12, 24, or 36 icons with none background, mid-clutter, or high-clutter graphical backgrounds. The target icon that participants were to detect was shown in the beginning of each trial. The stimulus display appeared after the target icon display. The target icon had 50% probability to be present. When the target icon was present, it would appear equally often in each of the four equal-sized regions of the display to minimize possible location effects.
Procedure
All participants read and listened to a detailed account of the experimental
procedures before proceeding to the practice and experimental sessions. In each trial, a target icon first appeared alone on the display for participants to remember it. Participants could then press any key on the keyboard when they felt they were ready to proceed to the stimulus display. The stimulus display appeared for about 100 ms. Up to 100 ms all the icons on the stimulus display were replaced by open circles. The circles served as a mask to eliminate any lingering sensory representation of the icons. Participants’ task was to make a “yes /no” judgment about the presence of a target icon. After responding “yes” or “no”, participants were further required to rate their confidence about their responses on a scale from one (least confident) to six (very confident). Half of the participants used
20
the left mouse button to indicate a “yes” response and the right mouse button to indicate a “no” response, while the other half had these response buttons reversed.
Participants completed 24 practice trials first. In the practice trials, participants received a feedback after each trial where the stimulus display appeared again and the target icon was shown on the upper left region of the display. There were eight practice trials for each of the three background graph conditions. Participants then received three blocks of experimental trials after the practice. The three blocks of trials corresponded to the three graphical background conditions: none background, mid-clutter, and high-clutter. There were 1-minute breaks between each block. There were 72 trials in each condition, with 24 trials for each of the experimental conditions (12, 24, and 36 icons). Among the 24 trials, 12 trials had the target icon present, 12 trials did not have the target icon. For the 12 target-present trials, the target icons were presented in the four equal-sized regions on the display equal amount of time. Trials with different number of icons were randomly presented within each graphical background conditions. The order of the presentations of the three graphical background conditions was counterbalanced among participants. Each participant received a total of 240 trials in the whole experiment. The experiment finished within 40 minutes.
Results ANOVAs for dependent measures
Repeated ANOVAs were performed for the reaction time, response accuracy, hit rate, and false alarm rate. Two within-subject variables were number of icons (12-icon,
24-icon, & 36-icon) and graphical backgrounds (none, mid-clutter, & high-clutter graphical background).
The analysis for the reaction time showed a significant main effect of number of icons (F(1.46, 46)=8.0, p< .01; mean= 1.11 vs. 1.18 vs. 1.42 s for 12-icon, 24-icon, & 36-icon condition, respectively). Follow-up analyses revealed that the reaction time for the 36-icon condition was greater than that of for the 12-icon condition (F(1,23)=10.28, p<.01) and that of for the 24-icon condition (F(1,23)=7.48, p<.05) across different graphical background conditions.
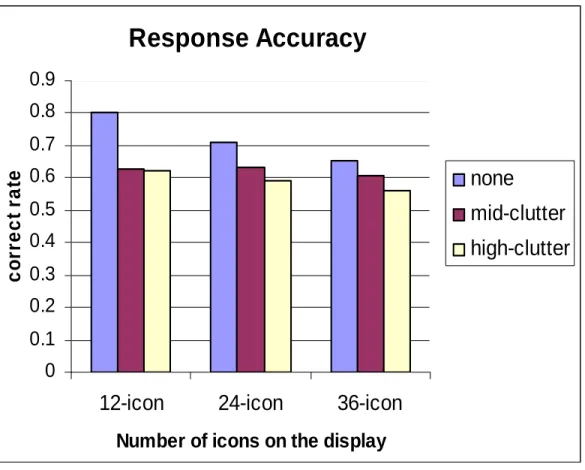
The analysis of response accuracy showed a significant main effect of number of icons (F(2,46)=17.46, p < .01; mean= 0.69 vs. 0.64 vs. 0.61 for 12-icon, 24-icon, &
21
36-icon condition, respectively), a significant main effect of graphical backgrounds (F(2,46)=13.14, p<.01; mean=0.72 vs. 0.62 vs. 0.59 for none background, mid-clutter, and high-clutter graphical backgrounds, respectively), and a significant interaction
between the number of icons and graphical background (F(4,92)=4.07, p<.01). Follow-up analyses for the interaction were performed for each of the 12-icon, 24-icon, and 36-icon condition with graphical background as an independent variable. The results from the 12-icon condition revealed that the correct rate for the none background condition was greater than that for the mid-clutter graphical background (F(1,23)=27.1, p<.01) and that for the high-clutter graphical background (F(1,23)=33.12, p<.01). The results from the 24-icon condition revealed that the correct rate for the none background condition was greater than that for the mid-clutter graphical background (F(1,23)=9.95, p<.01) and that for the high-clutter graphical background (F(1,23)=10.35, p<.01). The results from the 36-icon condition revealed that the correct rate for the none background condition was greater than that for the high-clutter graphical background (F(1,23)=8.86, p<.01) (Figure 8). Although the trend of decreasing the correct rate from none background to high-clutter graphical background was similar for the three numeric size conditions, the decrease from none background to mid-clutter and high-clutter graphical backgrounds seems more evident for the 12-icon condition. It may be due to the fact that the combination of 12 icons and the blank background became an easiest condition and thus participants performed much well in this condition.
The analysis for the hit rate showed significant main effects of number of icons (F(2,46)=5.38, p<.01; mean=0.60 vs. 0.51 vs. 0.51 for 12-icon, 24-icon, & 36-icon
condition, respectively) and graphical backgrounds (F(2,46)=6.99, p<.01; mean= 0.66 vs. vs. 0.50 vs. 0.47 for none background, mid-clutter, and high-clutter graphical
backgrounds, respectively).Follow-up analyses revealed that hit rate for the 12-icon condition was significantly greater than that for the 24-icon condition (F(1,23)=6.71, p<.05) and that for the 36-icon condition (F(1,23)=6.93, p<.05). Furthermore, the hit rate for the none background condition was significantly greater than that for the mid-clutter graphical background condition (F(1,23)=8.99, p<.01) and that for the high-clutter graphical background condition (F(1,23)=10, p<.01).
22
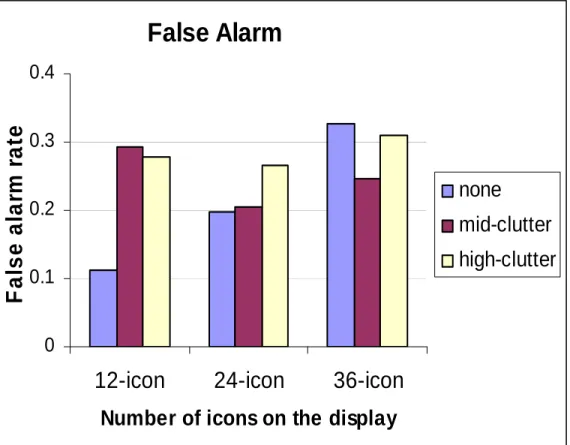
icons (F(2,46)=4.89, p<.05; mean=0.23 vs. 0.22 vs. 0.29 for 12-icon, 24-icon, & 36-icon condition, respectively) and a significant interaction between the number of icons and graphical background (F(4,92)=8.06, p<.01). Follow-up analyses for the interaction were performed for each of the 12-icon, 24-icon, and 36-icon condition with graphical
background as an independent variable. The results from the 12-icon condition revealed that the false alarm rate for the none background condition was lower than that for the mid-clutter graphical background (F(1,23)=10.39, p<.01) and that for the high-clutter graphical background (F(1,23)=23, p<.01). There was no significant effect for the analyses for the 24-icon and 36-icon conditions (Figure 9).
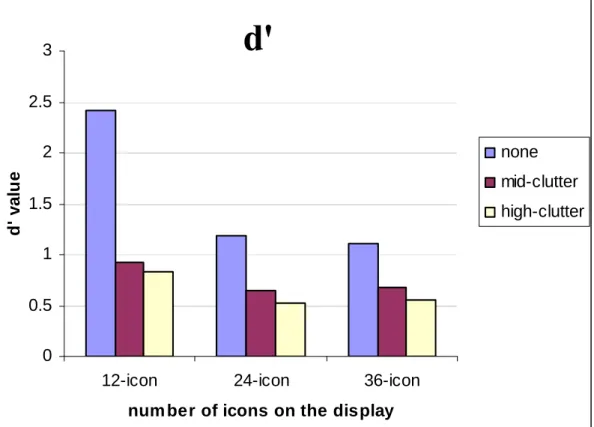
d’ and β estimates
The estimates of d’ and β values for each of the numeric size by graphical
background conditions are plotted in Figure 10 and 11. As it can be seen, the perceptual sensitivity decreased as the number of icons on the display increased and as the clutter of the graphical background increased. Mimicking the response accuracy, the decrease from none background to mid-clutter and high-clutter graphical backgrounds seems more evident for the 12-icon condition. Again, twelve icons and the blank background could become an easiest combination and thus participants had the highest d’ for this condition.
ROC curves
The ROC curves for each of the numeric size by graphical background conditions were generated and shown in Figure 12. As it can be seen, the high-clutter graphical background condition resulted in the lower A’ (green lines) and the none background condition resulted in the higher A’ (blue lines). The mid-clutter graphical background condition lies in between. On the other hand, the 36-icon condition resulted in the relatively lower A’ (dotted lines), whereas the 12-icon condition resulted in the relatively higher A’ (solid lines). The 24-icon condition was in between. Overall, it seems that the background graphs still had stronger effects on participants’ perceptual sensitivity. The current ROC curves with the estimates of A’ values are consistent with the d’ values estimated from the model.
Conclusions and Discussions
23
perceptual sensitivity and decision criterion during target icon detection process on a computer display. Signal detection methodology was employed to examine the questions of interest. Factors of perceptual complexity, numeric size, color variety, and background graph clutter level were manipulated in the three experiments. The task employed was a target detection task where participants searched for a target icon among alternative icons on a computer display within a brief period of time and reported whether the target was present. The time constraint and limitation reduced the accuracy of the detection of the target icon. In the present experiments reaction time, response accuracy, as well as hit and false alarm rates were primary measures, and signal detection theory measures d’ and β were further derived from the parameter estimates procedure in a nonlinear mixed-effects signal detection model (Sheu, et al., 2008). Those dependent measures were all examined in statistical analyses. Additionally, participants were also asked to rate the confident level of their yes/no responses from 1 to 6. The ROC curve therefore could also be plotted to further explore the relation between the sensitivity and decision criterion under different perceptual complexities.
The present results showed that when participants could use the color as a valid cue to detect the target, the total number of icons on the display did not have any significant impact on participants’ perceptual sensitivity or decision criterion in detect process. The potential pop-out effect may have made the task relatively easy. However, the fact that only the false alarm rate significantly increased with the number of icons on the display still implied that the number of icons on the display may have its effect on the level of noise (shifting the noise distribution to the direction of the signal distribution). The influence of the background graphs was more apparent in that it significantly decreased the hit rate as well as perceptual sensitivity. It could be due to the masking of the background graphs on the target and thus the reduction of the strength of the signal (target). The color variety did not have any impact on participants’ perceptual sensitivity or decision criterion in the present experimental setting given that it was the feature that participants tried to ignore.
While examining the interactive effect of numeric size and background graphs, it appeared that background graphs, regardless the clutter level, decreased the perceptual sensitivity at about the same amount when there were 24 and 36 icons on the display
24
(Figure 10). However, the sensitivity for the blank background with 12 icons was much higher and so there was a big drop of sensitivity from the blank background to cluttered background in the 12-icon condition. It may be due to the fact that the pop-out effect was most apparent when there were 12 icons appearing on the blank background, and that became the cause of participants’ high sensitivity. Participants’ decision criterion (β) seemed to have a similar pattern as d’ (Figure 11). Overall, as it can be seen from the ROC curves in Figure 12, background graphs seem to still play a more dominating role in determining participants’ perceptual sensitivity.
The present results demonstrated that the impact of perceptual complexity, graphical background in particular, was on participants’ perceptual sensitivity and not on their decision criterion. Implementing any graphs in the background of the design therefore needs to be more cautious especially when operators’ perceptual sensitivity is crucial in the task.
25
26
27
28
Response Accuracy
0 0.1 0.2 0.3 0.4 0.5 0.6none
background
mid-clutter
high-clutter
Gaphical background
C
o
rr
ect r
a
te
29
d'
0
0.1
0.2
0.3
0.4
0.5
0.6
0.7
none background
mid-clutter
high-clutter
Graphical background
30
False Alarm Rate
0.0 0.2 0.4 0.6 0.8 1.0 Hit Rate 0.0 0.2 0.4 0.6 0.8 1.0 12-icon 24-icon 36-icon 2-color 6-color 12-color
31
False Alarm Rate
0.0 0.2 0.4 0.6 0.8 1.0 Hit Ra te 0.0 0.2 0.4 0.6 0.8 1.0 12-icon 24-icon 36-icon none background mid-clutter high-clutter
32
Response Accuracy
0 0.1 0.2 0.3 0.4 0.5 0.6 0.7 0.8 0.912-icon
24-icon
36-icon
Number of icons on the display
c o rre c t ra te
none
mid-clutter
high-clutter
33
False Alarm
0 0.1 0.2 0.3 0.412-icon
24-icon
36-icon
Number of icons on the display
Fa
ls
e
a
la
rm
r
a
te
none
mid-clutter
high-clutter
34
d'
0 0.5 1 1.5 2 2.5 312-icon 24-icon 36-icon
num ber of icons on the display
d' v a lu e none mid-clutter high-clutter
35
Beta
0 0.5 1 1.5 2 2.5 3 3.512-icon 24-icon 36-icon
Num ber of icons on the display
b e ta v a lu e none mid-clutter high-clutter
36
False alarm rate
0.0 0.2 0.4 0.6 0.8 1.0 H it r ate 0.0 0.2 0.4 0.6 0.8 1.0
12-icon, none background 12-icon, mid-clutter 12-icon, high-clutter 24-icon, none background 24-icon, mid-clutter 24-icon, high-clutter 36-icon, none background 36-icon, mid-clutter 36-icon, high-clutter
37
d’ β
Exp 1 (Numeric size) 1.83 1.66
Exp 2 (Color variety) 0.61 1.30
Exp 3 (graphical background)
0.53 1.10
Exp 4 (Numeric size X graphical background)
0.99 1.37
38 References
Casti, J. L. (1979). Connectivity, Complexity, and Catastrophe. New York: Wiley. Cummings, M. L., & Tsonis, C. (2005). Deconstructing complexity in air traffic control.
In Proceedings of the Human Factors and Ergonomics Society 49th
Annual Meeting (pp 25-29). Santa Monica, CA: Human Factors Society.
Drozdz, S., Kwapien, J., Speth, J., & Wojcik, M. (2002). Identifying complexity by means of matrices. Physica A, 314, 355-361.
Edmonds, B. (1999). What is complexity? – The philosophy of complexity per se with application to some examples in evolution. In Heylighen, F. and Aerts, D. (Eds.): The Evolution of Complexity. (pp. 1-18). Kluwer, Dordrecht.
Grahame, M., Laberge, J., and Scialfa, C. T. (2004). Age difference in search of web pages: the effects of link size, link number, and clutter. Human Factors, 46(3), Halford, G. S., Wilson, W. H., & Phillips, W. (1998). Processing capacity defined by
relational complexity: implications for comparative, developmental and cognitive psychology. Behavioral Brain Sciences, 21, 803-831.
Johnson, W. W., Jordan, K., Liao, M., & Granada, S. (April, 2003). Sensitivity and bias in searches of Cockpit Display of Traffic Information Utilizing
Highlighting/Lowlighting. Proceedings of the 12th
International Symposium on Aviation Psychology, Dayton, Ohio, 625-629.
Klinger, A., & Salingaros, N. A. (2000). A pattern measure. Environment and Planning B: Planning and Design, 27, 537-547.
Liao, M., Johnson, W. W., & Granada, S. (2007). The effects of brightness highlighting on visual search within a cockpit display of traffic information. Chinese Journal of Psychology. 49(3), 271-284.
Macmillan, N. A. & Creelman, C. D. (1991a). Detection Theory: A User’s Guide. Cambridge: Cambridge University Press.
Mackworth, N. H. (1948). The breakdown of vigilance during prolonged visual search. Quarterly Journal of Experimental Psychology, 1, 5-61.
Sheu, C-F., Lee, Y-S, & Shih, P-Y. (2008). Analyzing recognition performance with sparse data, Behavior Research Methods, 40(3), 722-727.
Swets, J. A. (1973). The relative operating characteristic in psychology. Science, 182, 990-1000.
39
Swets, J. A. (1986). Form of empirical ROCs in discrimination and diagnostic tasks: implications for theory and measurement of performance. Psychological Bulletin, 99, 181-198.
Swets, J. A. (Ed.) (1988b). Signal detection and recognition by human observers. New York: Wiley.
Swets, J. A., & Pickett, R. M. (1982). The evaluation of diagnostic system. New York: Academic Press.
Tullis, T. S. (1985). Designing a menu-based interface to an operating system. In
Proceedings of CHI’85 Conference on Human Factors in Computing Systems. San Francisco, CA.
Tullis, T. S. (1986). Optimizing the usability of alphanumeric displays. In Proceedings of HCI’86 Conference on People and Computers. York, England.
Xing J. (2004) Metrics of information complexity and the implications for automation design. FAA Tech. Report. DOT/FAA/AM-04/17.
Xing J, Manning CA (2005) Complexity and Automation displays: Literature review and analysis. FAA Tech. Report. DOT/FAA/AM-05/4.
Wickens, C. D. & Hollands, J. G. (1999). Engineering Psychology and Human Performance (3rd edition). Prentice Hall.
40
Self-evaluation
Overall the four experiments were conducted successfully in the present project and the data analyses were performed properly. However, the most challenge issue in the present project was the individual difference. It appeared that participants’ performance varied differently depending on their experiences with computers or video/online games. The individual differences certainly make the analyses more difficult and challenging. Although the present study adopted an alternative mathematical model to account for the individual differences, there were still some uncertainties and the authors believe that the current data can be further explored with different methods and models to reveal more information about participants’ performance. How to handle individual differences in interface design studies becomes a new challenge for future research.
Despite the difficulties, the present analysis results still provide some useful recommendations for designs of computer-based interfaces. The experimental results have been presented in one conference. The manuscript of the present project is undergoing and will be finished to submit to a journal in a near future.
The research assistant in the project has been making great progress in
understanding the project, running experiments, collecting data, and finally assisting in data analyses through the two years’ appointment. She was very well trained through this project.
Conference presentations:
Liao, M., Sheu, C. F., & Fa, N-H (November, 2010). Impacts of display complexity on target detection performance: A signal detection analysis. Forty-ninth Annual Meeting of the Taiwan Psychological Association, Chai-Yi, Taiwan.
Liao, M., Wu, Y., & Sheu, C. F. (May, 2009). Effects of 3D Display Complexity on Target Acquisition Performance. Association for Psychological Science 21st Annual Convention, San Francisco, California.
Liao, M. & Wu, Y. (November, 2008). Perceptual complexity and older adults’ target acquisition performance. Forty-ninth Annual Meeting of the Psychonomic Society, Chicago, Illinois.
Liao, M., Wu, Y., & Sheu, C. F. (October, 2008). Impacts of perceptual complexity on target acquisition performance within a 3-D perspective. Forty-seventh Annual Meeting of the Taiwan Psychological Association, Taipei, Taiwan.
41
Publications
Liao, M., Johnson, W. W., & Granada, S. (2007). The effects of brightness highlighting on visual search within a cockpit display of traffic information. Chinese Journal of Psychology. 49(3), 271-284.
Liao, M., Wu, Y., & Sheu, C. F. (in preparation) Effects of perceptual complexity on target acquisition performance within a computer display.
國科會補助計畫衍生研發成果推廣資料表
日期:2011/01/14國科會補助計畫
計畫名稱: 應用信號偵側理論評估介面複雜度對視覺搜尋表現之影響 計畫主持人: 廖敏如 計畫編號: 98-2410-H-009-018- 學門領域: 實驗及認知心理學無研發成果推廣資料
98 年度專題研究計畫研究成果彙整表
計畫主持人:廖敏如 計畫編號: 98-2410-H-009-018-計畫名稱:應用信號偵側理論評估介面複雜度對視覺搜尋表現之影響 量化 成果項目 實際已達成 數(被接受 或已發表) 預期總達成 數(含實際已 達成數) 本計畫實 際貢獻百 分比 單位 備 註 ( 質 化 說 明:如 數 個 計 畫 共 同 成 果、成 果 列 為 該 期 刊 之 封 面 故 事 ... 等) 期刊論文 0 0 100% 研究報告/技術報告 0 0 100% 研討會論文 1 0 100% 篇 論文著作 專書 0 0 100% 申請中件數 0 0 100% 專利 已獲得件數 0 0 100% 件 件數 0 0 100% 件 技術移轉 權利金 0 0 100% 千元 碩士生 1 0 100% 博士生 0 0 100% 博士後研究員 0 0 100% 國內 參與計畫人力 (本國籍) 專任助理 0 0 100% 人次 期刊論文 0 0 100% 研究報告/技術報告 0 0 100% 研討會論文 0 0 100% 篇 論文著作 專書 0 0 100% 章/本 申請中件數 0 0 100% 專利 已獲得件數 0 0 100% 件 件數 0 0 100% 件 技術移轉 權利金 0 0 100% 千元 碩士生 0 0 100% 博士生 0 0 100% 博士後研究員 0 0 100% 國外 參與計畫人力 (外國籍) 專任助理 0 0 100% 人次其他成果