Adsorption–Desorption Rate of Nonpolar Volatile Organic
Compounds onto Activated Carbon Exemplified
by C
6
H
6
and CCl
4
C. L. Chuang
1; P. C. Chiang
2; E. E. Chang
3; and C. P. Huang
4Abstract: This investigation was to evaluate the performance of a thermodynamic model using nonlinear driving force in conjunction with the Langmuir model exemplified by the adsorption of benzene and carbon tetrachloride onto activated carbon in mono- and binary-adsorbate systems. Results show that model-fitted adsorption and desorption rate constants could well predict the adsorption isotherms and breakthrough curves under various conditions. This numerical model can provide adsorption and desorption rate constants. The kinetic parameters are of the same order of magnitude as reported in several studies. Under high reaction temperatures, both the adsorption and desorption rate constants increased while equilibrium constants decreased. A dimensionless valuable C0/K can be used to describe the relationship between adsorbate and adsorbent, and predict the service cycle during the adsorption process. For adsorption in binary mixtures, a high inlet concentration or a low temperature, the weak adsorbate, C6H6, will have a high breakthrough concentration when the strong adsorbate, CCl4, began to break through.
DOI: 10.1061/共ASCE兲1090-025X共2003兲7:3共148兲
CE Database subject headings:Activated carbon; Adsorption; Desorption; Kinetics.
Introduction
Activated carbon has been used extensively as an adsorbate for the removal of hazardous air pollutants. Major parameters affect-ing the adsorption process include the surface properties of the activated carbon, the characteristics and concentration of volatile organic compounds共VOCs兲, temperature, and humidity. King and Do共1996兲 used the Fourier transfer infrared technique to evaluate the effect of temperature on the adsorption capability of ethane, propane, and n-butane on activated carbon. They reported that the equilibrium time at high temperatures was shorter than that at low temperatures. Wood 共1992兲 observed good correlation between molar polarization of adsorbent and adsorption capacity using the Dubinin/Radushkevich model. Other researchers共Jonas and Reh-mann 1972; Vahdat et al. 1995兲 considered the activated carbon bed adsorption process as a first-order reaction and found the Wheeler equation to be successful for application to several or-ganic gases.
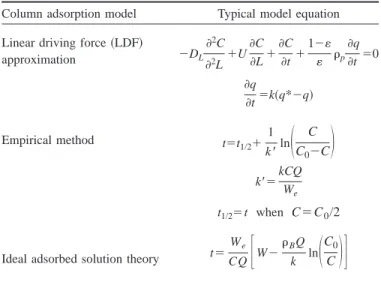
Most adsorption studies were conducted at a specific tempera-ture. Major adsorption models used include the linear driving force 共LDF兲 approximation 共Crittenden and Weber 1978; Malek et al. 1995; Malek and Farooq 1996, 1997; Vahdat 1997兲, the empirical method 共Yoon and Nelson 1984兲; and the thermody-namic equilibrium approach 共Myers and Prausnitz 1965兲 共Table 1兲. The LDF method considers the adsorption process as an irre-versible reaction, and the reaction rate is governed by the differ-ence between the temporal and the equilibrium concentrations of the gas adsorbate. The LDF method is based on an isothermal plug-flow system with a linear equilibrium adsorption isotherm 共Malek et al. 1995; Malek and Farooq 1996, 1997兲. Yoon and Nelson共1984兲 developed an empirical model to predict the break-through curve of activated carbon beds. Based on the thermody-namic characteristic of each solute at equilibrium, an ideal ad-sorbed solution theory was developed by Myers and Prausnitz 共1965兲. The adsorption equilibrium of the gas mixture can be predicted from the individual single-gas isotherm using the Toch equation 共Myers and Valenzuela 1986兲 and/or the Dubinin/ Radushkevich equation共Dubinin 1989兲. The desorption behavior of carbon films was also observed based on the Arrhenius equa-tion and thermal desorpequa-tion spectroscopy共Pigram et al. 1994兲.
There are problems with the above methods. For example, the thermodynamic method considers the adsorption process only under equilibrium conditions. The LDF method accounts for the adsorption step only. The empirical method lacks theoretical va-lidity. In essence, the adsorption is not truly equilibrium; both adsorption and desorption occur at the same time. The objectives of this investigation were to evaluate the performance of the ther-modynamic model using nonlinear driving force exemplified by the adsorption of benzene and carbon tetrachloride onto activated carbon in mono- and binary-adsorbate systems, and to predict the adsorption isotherm and adsorption breakthrough curves under different operational conditions, such as temperature and gas con-centration, as a means to determine the system service time. 1PhD Candidate, Graduate Institute of Environmental Engineering,
National Taiwan Univ., 71 Chou-Shan Rd., Taipei, Taiwan. E-mail: clcគ[email protected]
2Professor, Graduate Institute of Environmental Engineering, National Taiwan Univ., 71 Chou-Shan Rd., Taipei, Taiwan. E-mail: [email protected]
3Professor, Dept. of Biochemistry, Taipei Medical Univ., 250 Wu-Hsing St., Taipei, Taiwan. E-mail: [email protected]
4Professor, Dept. of Civil and Environmental Engineering, Univ. of Delaware, Newark, DE 19716. E-mail: [email protected]
Note. Discussion open until December 1, 2003. Separate discussions must be submitted for individual papers. To extend the closing date by one month, a written request must be filed with the ASCE Managing Editor. The manuscript for this paper was submitted for review and pos-sible publication on May 20, 2002; approved on March 21, 2003. This paper is part of the Practice Periodical of Hazardous, Toxic, and Radio-active Waste Management, Vol. 7, No. 3, July 1, 2003. ©ASCE, ISSN 1090-025X/2003/3-148 –155/$18.00.
Experimental Method Materials
The VOCs selected were benzene (C6H6) and carbon tetrachlo-ride (CCl4), and the activated carbon studied was Sorbonorit 3
共Norit, the Netherlands兲. The activated carbon sample was of pel-let form with a diameter of 3 mm and a density of 880 kg/m3. The activated carbon was ground and sieved to size between 0.35 and 0.50 mm共35–45 mesh兲 to prevent the wall effects. Then it was heated to 573 K in a N2atmosphere共purity 99.99%兲 over 24 h to desorb contaminants. The treated activated carbon was stored in a N2-filling chamber共300 K兲 before experiments.
Volatile organic compounds were generated by passing a stream of water and hydrocarbon-free N2 gas over a series of diffusion tubes containing the pure liquid. The VOC concentra-tions were controlled by the number of diffusion tubes and tem-perature. The carrier gas flow rate was controlled at 1.2 L/min 共298 K兲 by a mass flow meter 共Instrument Inc., Sierra兲. The tem-perature of the VOC vapor was controlled by a thermostat共283– 363 K兲 before entering the reaction column 共Fig. 1兲. The concen-trations of C6H6 and CCl4 studied were 8 –150 and 6 –300 mmol/m3, respectively.
Adsorption in Activated Carbon Bed
For mono-VOC adsorption experiments, about 600 mg of treated activated carbon was packed in a small glass column共height⫽9
mm and cross-section area⫽1.76 cm2兲, whereas for bi-VOC ex-periments, the amount of treated activated carbon used was about 4,000 mg共height⫽60 mm and cross-section area⫽1.76 cm2兲. The column temperature was maintained at the range from 283 to 363 K for 3 h before testing. For single-component experiments, the outlet gas was continuously monitored with a portable photoion-ization air monitor 共Perkinelmer, Photovac Model 2020兲. The measurements were calibrated by gas chromatography共GC兲 共HP 5890A; column: Supel Co., VOCOL™, No. 9354-04A兲 with a flame ionization detector共FID兲. For two-component experiments, the outlet gas was collected about 1 mL every 15 min and injected into the GC/FID for the analysis of residual organics. The detec-tion limits of C6H6 and CCl4 were 100 and 30 ppm V, respec-tively.
Mathematical Model
Numerical Model Development
The following dynamic equation was used to describe the tempo-ral mass balance of containment in question:
C t ⫺DL 2C 2L ⫹u C L ⫹ 1⫺ p q t ⫽0 (1)
where DL, C, L, u, , , and q⫽dispersion coefficient 共m2/s兲; concentration of VOC in the gas phase共mol/m3兲; length of acti-vated carbon bed 共m兲; gas velocity 共m/s兲; bed void fraction; a density of activated carbon共g/m3兲; and adsorption capacity 共g/g兲, respectively. By assuming the process as a nonequilibrium surface reaction and since the column is relatively short, the diffusion term can be negligible, the surface reaction rate is equal to the adsorption rate minus the desorption rate, i.e.
t ⫽ka共1⫺兲C⫺kd (2)
where (q/q0)⫽degree of surface coverage of VOC on activated carbon surface; ka⫽adsorption rate constant 共m3/共s mol兲兲; and kd⫽desorption rate constant 共L/s兲. Eq. 共1兲 can be rewritten as
C t ⫽⫺U C L ⫺ t S (3)
where S (g/m3)⫽conversion factor between solid and gas phase can be further expressed by the following relation:
S⫽ q0W
LA⫺W/ (4)
It is known that the flow rate, Q (m3/s), has the following form:
Q⫽UA
冉
1⫺ W
LA
冊
(5)where W⫽weight of activated carbon 共g兲; A⫽cross-sectional area of the adsorption bed共m2兲; and q0⫽maximum adsorptive capac-ity at the monolayer level共g/g兲.
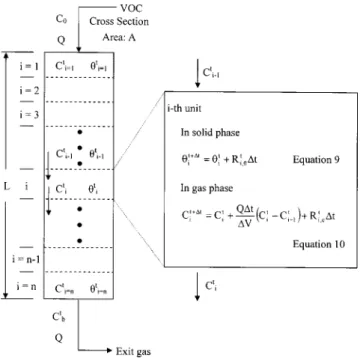
Considering the activated carbon bed as an entity of n series (n⫽50) of constant volume units, i.e., the physicochemical con-ditions within each unit are identical, and the adsorption/ desorption process follows the Langmuir model. Let ⌬t (s) and ⌬V (m3) be the reaction time and the gas volume in each unit. At
Table 1. Adsorption Models
Column adsorption model Typical model equation Linear driving force共LDF兲
approximation ⫺DL 2C 2L⫹U C L ⫹ C t ⫹ 1⫺ p q t ⫽0 q t ⫽k共q*⫺q兲 Empirical method t⫽t 1/2⫹ 1 k⬘ln
冉
C C0⫺C冊
k⬘⫽kCQ We t1/2⫽t when C⫽C0/2Ideal adsorbed solution theory t⫽
We CQ
冋
W⫺ BQ k ln冉
C0 C冊
册
the ith unit and experimental time, t, the concentration change in the solid phase and the gas phase can be determined by a finite difference method.
In solid phase from Eq.共2兲 one has i t⫹⌬t⫽ i t⫹关k a共1⫺i t兲C i t⫺k di t兴⌬t (6)
In the gas phase from Eq.共3兲, it yields Cit⫹⌬t⫽Cit⫹Q⌬t ⌬V 共Ci t⫺C i⫺1 t 兲⫹关⫺k a共1⫺i t兲C i t⫹k di t兴S⌬t (7) Accordingly,⌬V can be expressed by the following equation:
⌬V⫽ LA⫺W
n (8)
In the case when both VOCs are present, it is assumed that both prefer the same adsorption sites, and that a competitive ad-sorption process takes place.
In the solid phase, Eq.共6兲 becomes i t⫹⌬t,Z⫽ i t,Z⫹
冋
k a冉
1⫺兺
Z i t,Z冊
C i t,Z⫺k di t,Z册
⌬t (9)In the gas phase, Eq.共7兲 becomes Ci t⫹⌬t,Z⫽C i t,Z⫹Q⌬t ⌬V 共Ci t,Z⫺C i⫺1 t,Z 兲⫹
冋
⫺k a冉
1⫺兺
Z i t,Z冊
Ci t,Z ⫹kdi t,Z册
S⌬t (10)where Z⫽Zth adsorbate. Fig. 2 is the conceptual presentation of the modeling approach.
Calculation
By definition, the equilibrium adsorption mass, We, and the equi-librium adsorption capacity, q, can be calculated by the following
equation:
q⫽
冕
0⬁
共C0⫺Cb兲Q dt/W⫽We/W (11)
where C0 and Cb⫽inlet and outlet organic vapor concentrations, respectively; and We⫽equilibrium adsorption mass. With q ob-tained, the parameters of Langmuir (q0,KL), Freundlich (KF,n), and Redlich–Peterson (KR,B,m) adsorption isotherms can be computed using the SYSTAT software package.
In numerical modeling, a series of knowns共, A, C0, W, L, Q, and T兲 and estimated parameters (kaand kd) were input into Eqs. 共6兲 and 共7兲 followed by iterative computations. The breakthrough curves were then resulted. The best fit was verified evaluating by the root mean square error method,␦, i.e.
␦⫽C1 0
冑
1 Nn兺
⫽1 N 共Cb⫺C⬘兲2 (12)where Cb, C⬘, and N⫽observed breakthrough concentration, cal-culated breakthrough concentration, and measured number in each test, respectively.
Results and Discussion
Determination of Reaction Parameters „ka, kd, Ea, and Ed…
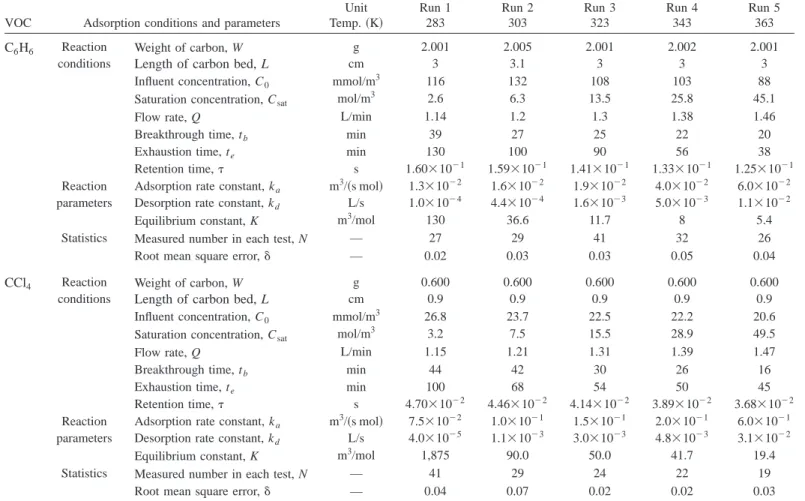
Table 2 shows the experimental conditions and results of a single contaminant column adsorption process, where retention time, , is defined as (LA⫺W/)/Q. The breakthrough time (tb at Cb ⫽0.01 C0) and the exhaustion time (te at Cb⫽0.99 C0) deceased significantly as temperature increased. Clearly, the model devel-oped for the present study can reasonably predict the effluent concentration共␦⫽0.02–0.07兲. Although both kaand kdincreased with temperature, the equilibrium adsorption constant (K ⫽ka/kd) actually decreased. For example, the desorption rate constant of C6H6 increased from 1.0⫻10⫺4to 1.1⫻10⫺2L/s as the temperature increased from 283 to 363 K; the increase in the desorption rate constant was greater than that of the adsorption rate constant 关1.3⫻10⫺2– 6.0⫻10⫺2m3/(s mol)兴. The equilib-rium constant, however, decreased by 2 orders of magnitude 共130–5.4 m3/mol兲 when the temperature increased from 283 to 363 K. Results also show that the equilibrium adsorption constant of CCl4was greater than that of C6H6.
Based on the Arrhenius equation, the adsorption activation en-ergy (Ea), desorption activation energy (Ed), adsorption fre-quency coefficient (aa), and desorption frequency coefficient (ad) can be calculated from the corresponding ka and kd values 共Fig. 3兲. For C6H6, the Eaand Edwere determined to be 4.0 and 12.2 kcal/mol, respectively; the corresponding aa and ad values were 13 m3/共s mol兲 and 2.6⫻105L/s, individually. For CCl4, the Ea and Ed values were 4.8 and 15.3 kcal/mol, respectively; the respective aa and ad values were 340 m3/共s mol兲 and 4.6 ⫻107L/s. Consequently, the heat of adsorption of C
6H6and CCl4 can be determined; the values are⫺8.2 and ⫺10.4 kcal/mol, re-spectively, for C6H6and CCl4. In comparison, C6H6has a larger adsorption rate constant, desorption rate constant, equilibrium ad-sorption constant, adad-sorption activation energy, and dead-sorption activation energy but a lower heat of adsorption and adsorption capacity than that of CCl4.
Adsorption Isotherm
In this study, both C6H6 and CCl4 are nonpolar molecules; i.e., dipole moments are zero. Table 3 summarizes the results of the equilibrium adsorption capacity under various C6H6 and CCl4 concentrations. As expected, the equilibrium capacity increased
with the VOC concentration. The C6H6 or CCl4 saturation con-centration (Csat) at a given temperature was calculated from its vapor pressure, and the adsorption capacity was plotted versus the ‘‘relative concentration’’ (C0/Csat) as shown in Fig. 4. All three models 共Langmuir, Freundlich, and Redlich–Peterson兲 can rea-sonably describe the experimental data (R2⫽0.89– 0.99). Table 4 summarizes the model parameters. The results indicate that CCl4 has both high maximum adsorptive capacity and Langmuir ad-sorption constant (KL⫽ka/kd), which implies that CCl4 is a stronger adsorbate than C6H6 toward activated carbon. For the sake of convenience, the Langmuir model was chosen in subse-quent numerical model analysis of the adsorption/desorption pro-cess.
Many researchers have reported that the adsorbed VOC mol-ecules behave as a liquid phase. In this study, both C6H6and CCl4 are nonpolar molecules with a liquid density of 0.885 and 1.584 g/cm3, respectively.
In principle, both the breakthrough (tb) and exhaustion (te) time of the activated carbon decreased as the influent concentra-tion (C0) and/or the reciprocal adsorption constant共K兲 increases. These phenomena were clearly demonstrated in Fig. 5, which shows that tb and te decrease exponentially with increasing C0/K. Meanwhile, the breakthrough time of C6H6共or CCl4) will approach the exhaustion time when the C0/K reaches 1.6
⫻10⫺2 共or 4.0⫻10⫺3). That is at exhaustion condition, influent
concentration (C0) increases while the reaction constant共K兲 de-creases and vice versa. Therefore, the dimensionless quantity C0/K not only reflects the relationship between adsorbent (C0)
Table 2. Adsorption Conditions, Parameters, and Statistics
VOC Adsorption conditions and parameters
Unit Temp.共K兲 Run 1 283 Run 2 303 Run 3 323 Run 4 343 Run 5 363 C6H6 Reaction conditions Weight of carbon, W
Length of carbon bed, L
g cm 2.001 3 2.005 3.1 2.001 3 2.002 3 2.001 3
Influent concentration, C0 mmol/m3 116 132 108 103 88
Saturation concentration, Csat mol/m3 2.6 6.3 13.5 25.8 45.1
Flow rate, Q L/min 1.14 1.2 1.3 1.38 1.46
Breakthrough time, tb min 39 27 25 22 20
Exhaustion time, te min 130 100 90 56 38
Retention time, s 1.60⫻10⫺1 1.59⫻10⫺1 1.41⫻10⫺1 1.33⫻10⫺1 1.25⫻10⫺1 Reaction
parameters
Adsorption rate constant, ka Desorption rate constant, kd
m3/共s mol兲 L/s 1.3⫻10⫺2 1.0⫻10⫺4 1.6⫻10⫺2 4.4⫻10⫺4 1.9⫻10⫺2 1.6⫻10⫺3 4.0⫻10⫺2 5.0⫻10⫺3 6.0⫻10⫺2 1.1⫻10⫺2
Equilibrium constant, K m3/mol 130 36.6 11.7 8 5.4
Statistics Measured number in each test, N — 27 29 41 32 26
Root mean square error,␦ — 0.02 0.03 0.03 0.05 0.04
CCl4 Reaction conditions
Weight of carbon, W
Length of carbon bed, L
g cm 0.600 0.9 0.600 0.9 0.600 0.9 0.600 0.9 0.600 0.9
Influent concentration, C0 mmol/m3 26.8 23.7 22.5 22.2 20.6
Saturation concentration, Csat mol/m3 3.2 7.5 15.5 28.9 49.5
Flow rate, Q L/min 1.15 1.21 1.31 1.39 1.47
Breakthrough time, tb min 44 42 30 26 16
Exhaustion time, te min 100 68 54 50 45
Retention time, s 4.70⫻10⫺2 4.46⫻10⫺2 4.14⫻10⫺2 3.89⫻10⫺2 3.68⫻10⫺2 Reaction
parameters
Adsorption rate constant, ka Desorption rate constant, kd
m3/共s mol兲 L/s 7.5⫻10⫺2 4.0⫻10⫺5 1.0⫻10⫺1 1.1⫻10⫺3 1.5⫻10⫺1 3.0⫻10⫺3 2.0⫻10⫺1 4.8⫻10⫺3 6.0⫻10⫺1 3.1⫻10⫺2
Equilibrium constant, K m3/mol 1,875 90.0 50.0 41.7 19.4
Statistics Measured number in each test, N — 41 29 24 22 19
Root mean square error,␦ — 0.04 0.07 0.02 0.02 0.03
Note: Experimental conditions: density⫽880 kg/m3, bed cross-section area⫽1.76 cm2and q0460 mg/g for C6H6, and 600 mg/g for CCl4at 303 K.
Fig. 3. Relationship between rate constants (ka and kd) and
and adsorbate (1/K), but also provides a guideline for predicting the service time during the adsorption cycle.
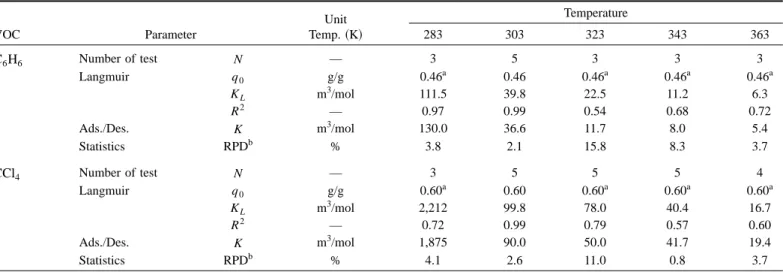
Table 5 and Fig. 6 compare the equilibrium adsorption con-stants obtained from the Langmuir adsorption isotherm and model calculations. Results show that the average relative percentage difference 共RPD兲 value is about 6%, which indicates that the model predicates well the adsorption and desorption rate con-stants.
Vahdat共1997兲 reported Langmuir constants between 27 VOCs and 11 activated carbons and suggested that both the VOCs and activated carbon can affect the Langmuir constants (q0 and KL). For benzene, the average q0 is 0.353 g/g; the average KLis 60.1 m3/mol; the maximum K
L is 120.2 m3/mol; and the minimum KL is 34.5 m3/mol at 298 K. For carbon tetrachloride, the average q0 is 0.738 g/g; the average KL is 61.3 m3/mol; the maximum KL is 163.7 m3/mol; and the minimum KL is 43.3 m3/mol in the tem-perature range of 296 –298 K. In a previous study, Chiang et al. 共2001兲 reported a q0of 0.43 and 0.62 g/g for benzene and carbon tetrachloride, individually, and a KL of 29 and 90 m3/mol for benzene and carbon tetrachloride, respectively, at 300 K for the same activated carbon sample 共Fig. 6兲. Our results of Langmuir constants were of the same order of magnitude as those reported by Vahdat共1997兲 and Chiang et al. 共2001兲.
Effect of Temperature and Concentration
Fig. 7 illustrates the effect of temperature on the adsorption of VOCs. Results indicate that the adsorption of C6H6was not tem-perature dependent, especially in the low VOC concentration range. As relative concentration increased, the effect of tempera-ture on VOC adsorption diminished.
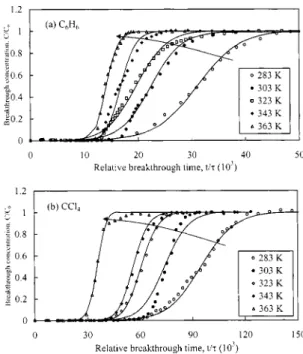
Fig. 8 shows predicted single-contaminant breakthrough curve as a function of temperature. For the single contaminant system, the model predicts well the adsorption breakthrough curves of both C6H6and CCl4. At high reaction temperatures, the adsorp-tion capacity decreased due in part to small equilibrium constants and an early breakthrough time. The breakthrough curves were steeper at high temperatures than at low temperatures, due in part to the effects of kaand kd. Furthermore, CCl4has a longer rela-tive breakthrough time, due to low inlet CCl4 concentrations.
Fig. 9 shows the predicted breakthrough curves of the binary contaminant system at four temperatures. The inlet concentrations of CCl4 at 303, 323, 343, and 363 K were 1.26⫻10⫺2, 1.45 ⫻10⫺2, 1.54⫻10⫺2, and 3.07⫻10⫺2mol/m3, respectively;
Table 3. Adsorption Capacity of C6H6and CCl4onto Activated Carbon
VOC Conditions and result Unit Run 1 Run 2 Run 3 Run 4 Run 5
C6H6 Concentration, C0 mmol/m3 8.1 19.5 45.1 77.7 131.6
Activated carbon weight, W g 2.002 2.005 2.002 2.011 2.005
Equilibrium adsorption weight, We mmol 2.82 5.26 7.31 9.32 9.79
Equilibrium adsorption capacity, q mg/g 110 205 285 362 381
CCl4 Concentration, C0 mmol/m3 6.1 12.8 23.7 91.7 291.1
Activated carbon weight, W g 0.601 0.600 0.600 1.000 2.000
Equilibrium adsorption weight, We mmol 0.86 1.40 1.60 3.50 7.66
Equilibrium adsorption capacity, q mg/g 220 360 410 539 590
Note: Experimental condition: T⫽303 K and Q⫽1.2 L/min.
Fig. 4. Adsorption isotherms of C6H6and CCl4at 303 K
Table 4. Pertinent Parameters of Various Adsorption Isotherm Equations
VOC Isotherm Parameter Unit Value
C6H6 Langmuir q0 g/g 0.46 (N⫽5) q⫽q0KLC 1⫹KLC KL m3/mol 39.8 R2 — 0.99 Freundlich KF g/g 0.88 q⫽KFCn n — 0.38 R2 — 0.97 Redlich–Peterson KR mol/m3 0.44 q⫽ KRC B⫹Cm B — 0.03 m — 1.03 R2 — 0.99 CCl4 Langmuir q0 g/g 0.60 (N⫽5) KL m3/mol 99.8 R2 — 0.99 Freundlich KF g/g 0.80 n — 0.20 R2 — 0.89 Redlich–Peterson KR mol/m3 0.62 B — 0.01 m — 0.98 R2 — 0.99
whereas the inlet concentrations of C6H6 were 6.38⫻10⫺2, 6.86
⫻10⫺2, 7.84⫻10⫺2, and 1.64⫻10⫺1mol/m3, individually. In general, the predicted results agree well with what were observed. Again, high temperatures exhibited a steeper breakthrough curve and an earlier breakthrough time. At high temperatures, the ad-sorption and dead-sorption rate constants were large, whereas the equilibrium constants were small. Both high adsorption and de-sorption rate constants were typically related to steeper break-through curves, whereas low equilibrium constants cause low ad-sorption density and early breakthrough time.
Fig. 10 shows the predicted results at three concentration level of VOC, i.e., high (关C6H6兴0⫽309 mmol/m3, 关CCl4兴0
⫽90 mmol/m3); medium (关C
6H6兴0⫽164 mmol/m3, 关CCl4兴0
⫽31 mmol/m3); and low (关C
6H6兴0⫽84 mmol/m3, 关CCl4兴0
⫽16 mmol/m3) concentrations. At the high 共or medium兲 inlet concentration, the effluent concentration ratio (C/C0) of the weak adsorbate (C6H6) presents a high C/C0 value 1.20共versus 1.06 for CCl4) when the breakthrough time approaches 30 min共versus 55 min for CCl4). At a high inlet concentration, the strong adsor-bate competed with the weak adsoradsor-bate, and caused the desorp-tion rate of the weak adsorbate to be higher than the adsorpdesorp-tion rate. It caused the outlet concentration to be higher than the inlet concentration (C0). However, the effluent concentration ratio of C6H6did not exhibit a value higher than 1.0 at the low concen-tration level. The total adsorption capacity of C6H6and CCl4was found to decrease as the inlet concentration decreased.
It was thus concluded that, at high temperature and/or high inlet concentration, there was significant adsorptive breakthrough. For both high-inlet concentration 共Fig. 10兲 and low-temperature conditions 共Fig. 9兲, the weak adsorbate, C6H6, exhibited a high adsorption density at the beginning of the experiment.
Fig. 5. Relationship of inlet concentration with equilibrium constant and breakthrough time or equilibrium time (W⫽2.0 and 0.6 g for C6H6and CCl4, respectively兲
Table 5. Relationships of Equilibrium Constants of Both Langmuir and Adsorption/Desorption Models
VOC Parameter Unit Temp.共K兲 Temperature 283 303 323 343 363 C6H6 Number of test N — 3 5 3 3 3 Langmuir q0 g/g 0.46a 0.46 0.46a 0.46a 0.46a KL m3/mol 111.5 39.8 22.5 11.2 6.3 R2 — 0.97 0.99 0.54 0.68 0.72 Ads./Des. K m3/mol 130.0 36.6 11.7 8.0 5.4 Statistics RPDb % 3.8 2.1 15.8 8.3 3.7 CCl4 Number of test N — 3 5 5 5 4 Langmuir q0 g/g 0.60a 0.60 0.60a 0.60a 0.60a KL m3/mol 2,212 99.8 78.0 40.4 16.7 R2 — 0.72 0.99 0.79 0.57 0.60 Ads./Des. K m3/mol 1,875 90.0 50.0 41.7 19.4 Statistics RPDb % 4.1 2.6 11.0 0.8 3.7
aFixed at the same value of 303 K. bRPD⫽兩K
L⫺K兩/2(KL⫹K).
Fig. 6. Relationship of equilibrium constants of Langmuir and adsorption/desorption models
Binary contaminant breakthrough shows a competitive adsorp-tion. For example, at 303 K, with CCl4 and C6H6 inlet concen-trations of 1.26⫻10⫺2and 6.38⫻10⫺2mol/m3, the experimental adsorption capacities are about 1.8 and 2.0 mol/kg, respectively. For a single contaminant adsorption, the adsorption of CCl4 and C6H6are 2.9 and 4.2 mol/kg, respectively. As expected, at binary
contaminant adsorption, the adsorption capacities are smaller than that of a single contaminant adsorption.
Conclusion
The activated carbon adsorption process was affected by several factors, such as temperature, adsorbent and adsorbate characteris-tics, and VOC concentration. In this study, a numerical model was developed. Results show that model-fitted adsorption and desorp-tion rate constants could predict well the adsorpdesorp-tion isotherms and breakthrough curves under various conditions. Both experimental and model-predicted data indicate that under high reaction tem-peratures, both the adsorption and desorption rate constants in-crease, whereas equilibrium adsorption constants decreased. The adsorption capacity was also affected by temperature. For binary contaminants adsorption, a high inlet concentration or a low tem-perature will cause a high breakthrough concentration of weak adsorbate (C6H6) when contaminant (CCl4), a strong adsorbate, began to break through.
Fig. 7. Prediction of adsorption isotherms under different concentra-tion and temperature condiconcentra-tions 共points are experimental data and lines are model predicted兲
Fig. 8. Prediction of volatile organic compound breakthrough as function of temperature 共points are experimental data and lines are model predicted, influent concentrations of C6H6and CCl4are 88 –
132 and 20–27 mmol/m3, respectively兲
Fig. 9. Prediction of binary adsorption breakthrough curves under different temperature conditions共solid points are experimental CCl4
data, air-corn points are experimental C6H6data, solid lines are
pre-dicted CCl4 value, and broken lines are predicted C6H6 value, W
⫽4.0 g)
Fig. 10. Prediction of binary adsorption breakthrough curves under different concentration conditions共363 K, W⫽4.0 g, solid points are experimental CCl4data, air-corn points are experimental C6H6data,
关T兴 and 关B兴 are concentration 共mol/m3兲 of carbon tetrachloride and
References
Chiang, Y. C., Chiang, P. C., and Chang, E. E.共2001兲. ‘‘Effects of surface characteristics of activated carbons on VOC adsorption.’’ J. Environ.
Eng., 127, 54 – 62.
Crittenden, J. C., and Weber, W. J.共1978兲. ‘‘Predictive model for design of fixed-bed adsorbers: single-component model verification.’’ J.
En-viron. Eng., 104, 433– 443.
Dubinin, M. M.共1989兲. ‘‘Fundamentals of the theory of adsorption in micropores of carbon adsorbents: characteristics of their adsorption properties and microporous structures.’’ Carbon, 27, 457– 467. Jonas, L. A., and Rehmann, J. A.共1972兲. ‘‘The kinetics of adsorption of
organo-phosphorus vapors from air mixtures by activated carbon.’’
Carbon, 10, 657– 663.
King, B., and Do, D. D.共1996兲. ‘‘Measurement of multicomponent ad-sorption kinetics of gases in activated carbon by a batch adsorber FT-IR technique.’’ Chem. Eng. Sci., 51, 423– 439.
Malek, A., and Farooq, S.共1996兲. ‘‘Comparison of isotherm models for hydrocarbon adsorption on activated carbon.’’ AIChE J., 42, 3191– 3201.
Malek, A., and Farooq, S.共1997兲. ‘‘Kinetics of hydrocarbon adsorption on activated carbon and silica gel.’’ AIChE J., 43, 761–776. Malek, A., Farooq, S., Rathor, M. N., and Hidajat, K.共1995兲. ‘‘Effect of
velocity variation due to adsorption-desorption on equilibrium data from breakthrough experiments.’’ Chem. Eng. Sci., 50, 737–740. Myers, A. L., and Prausnitz, J. M.共1965兲. ‘‘Thermodynamics of
mixed-gas adsorption.’’ AIChE J., 11, 121–126.
Myers, A. L., and Valenzuela, D. P. 共1986兲. ‘‘Computer algorithm and graphical method for calculating adsorption equilibria of gas mix-tures.’’ J. Chem. Eng. Jpn., 19, 392–396.
Pigram, P. J., Lamb, R. N., Hibbert, D. B., and Collins, R. E.共1994兲. ‘‘Modeling of the desorption behavior of microporous amorphous hy-drogenated carbon films.’’ Langmuir, 10, 142–147.
Vahdat, N. 共1997兲. ‘‘Theoretical study of the performance of activated carbon: in the presence of binary vapor mixtures.’’ Carbon, 35, 1545– 1557.
Vahdat, N., Swearengen, P. M., Johnson, J. S., Priante, S., Mathews, K., and Neihart, A.共1995兲. ‘‘Adsorption capacity and thermal desorption efficiency of selected adsorbents.’’ Am. Ind. Hyg. Assoc. J., 56, 32– 38.
Wood, G. O. 共1992兲. ‘‘Activated carbon adsorption capacities for va-pors.’’ Carbon, 30, 593–599.
Yoon, Y. H., and Nelson, J. H. 共1984兲. ‘‘Application of gas adsorption kinetics: I. A theoretical model for respirator cartridge service life.’’