Reaction Kinetics and Mechanisms between La
0.65Sr
0.3MnO
3and
8 mol% Yttria-Stabilized Zirconia
Chih-Chung T. Yang and Wen-Cheng J. Wei*
,† Institute of Materials Science and Engineering, National Taiwan University, Taipei, Taiwan 10617, Republic of ChinaAndreas Roosen
Department of Materials Science, Glass and Ceramics, University of Erlangen-Nuremberg, D-91054 Erlangen, GermanyThe reaction kinetics and mechanisms between 8 mol% yttria-stabilized zirconia (YSZ) and 30 mol% Sr-doped lanthanum manganite (La0.65Sr0.30MnO3, LSM) with A-site deficiency for the application of planar solid oxide fuel cells (SOFCs) were investigated. The LSM/YSZ green tapes were cofired from 1200° to 1400°C for 1 to 48 h and then annealed at 1000°C for up to 1000 h. The results showed that the diffusion of manga-nese cations first caused the amorphization of YSZ, and then the formation of small La2Zr2O7(LZ) or SrZrO3(SZ) crystals if treated for a longer time at 1400°C. The ambipolar diffusion of the Mn–O pair, transported through the migration of oxygen vacancy, plays an important role in the formation of secondary phases. The diffusion of LSM to YSZ and substitu-tion of Mn for Zr both result in the enhanced concentrasubstitu-tion of oxygen vacancy, leading to the formation of a void-free zone (VFZ). No additional reaction products in annealed LSM/YSZ specimens, treated at 1000°C for 1000 h, were detected. The interfacial reactions, detailed reaction kinetics, and mecha-nisms are reported.
I. Introduction
Y
TTRIA-STABILIZED zirconia (8 mol% Y2O3, YSZ) andstrontium-doped lanthanum manganite (La1⫺xSrxMnO3,
LSM) are the most commonly used solid electrolyte and cathode materials, respectively, for solid oxide fuel cells (SOFCs). From the viewpoint of long-term stability of the LSM/YSZ interface, the formation of secondary phases is the most important issue con-cerning the processing and operating temperatures. Previous re-search1– 6
reported the formation of secondary phases when the YSZ solid electrolyte came into contact with the LSM cathode material. La2Zr2O7 (LZ) and SrZrO3 (SZ) are two reaction
products for the combination of LSM/YSZ with a low Sr substi-tution (x⬍ 0.3). However, only SZ becomes the dominant reaction product in the case of a higher Sr content (x⬎ 0.3). The electrical conductivity of both zirconates is far lower than that of YSZ, leading to the degradation in energy conversion efficiency of SOFCs.7,8
In addition, it was reported that no chemical reactions occurred for LSM with Sr substitution in the range of 0.2ⱕ Sr ⱕ 0.4 after annealing at 1400°C for 200 h.9,10
However, the micro-structure, interdiffusion of ions, and kinetics of all interfacial
reactions have not yet been characterized in detail with respect to cofiring and annealing conditions.
To investigate the formation of secondary phases between YSZ and LSM, a simplified model system, consisting of a YSZ solid electrolyte fabricated by tape casting and then coated with the cathode material La0.65Sr0.30MnO3(LSM) by screen-printing, was
demonstrated in the present work. After cofiring, the sintered LSM/YSZ specimens were annealed at temperatures between 1000° and 1400°C for different soaking periods. The formation of secondary phases, microstructure, and reaction kinetics are inves-tigated with regard to processing conditions.
II. Experimental Procedure
YSZ powder (8 mol% Y2O3, TZ-8Y, Tosoh Corp., Tokyo,
Japan) with a specific surface area of 17 m2
/g was used to prepare the YSZ slurries. A toluene/ethanol mixture was used as the solvent for the YSZ slurry preparation. YSZ slurries were cast by using a tape caster with two doctor blades on a PET carrier tape (Hostaphan, Hoechst AG, Frankfurt, Germany). A-site deficient La0.65Sr0.3MnO3 powder (LSM, Research Center Juelich,
Ger-many), with a specific surface area of 6 m2
/g, was used for the preparation of paste materials. The LSM powder combined with the vehicle in the ratio of 60 to 40 mass% was homogenized by a three-roller grinding mill (Exakt 50, Koenen GmbH, Ottobrunn, Germany) for 30 min. After the homogenization, the LSM paste was screen-printed on YSZ green tapes, and then the LSM/YSZ green tapes were laminated by thermocompression at a pressure of 20 MPa and held at 70°C for 10 min. The LSM/YSZ sandwiched laminates were then cofired between 1000° and 1400°C for 1 h in an air furnace. Cofiring conditions, such as 1400°C/48 h, were also used to accelerate the reaction kinetics between LSM and YSZ. The sintered LSM/YSZ specimens were then annealed at 1000°C for up to 1000 h.
The formation of secondary phases was determined by X-ray diffraction (PW 1830, Philips Instrument Corp., Eindhoven, The Netherlands). The shrinkage of the specimen was investi-gated by thermomechanical analysis (TMA) (Setsys TMA16/ 18, Setram Corp., France). The microstructures of LSM/YSZ specimens were examined by scanning electron microscopy (SEM) (XL30, Philips Instrument Corp., The Netherlands), transmission electron microscopy (TEM) (100 CXII, JEOL Corp., Japan), and analytical electron microscopy (AEM) (Tec-nai 300 FE-TEM, Philips Instrument Corp., The Netherlands) equipped with energy-dispersive spectrometry (EDS) (DX4, EDAX Corp., Richardson, TX). Concerning the pore density measurement, four micrographs were taken for each data point. A total of 32 micrographs, each containing an area of 20⫻ 30 m2
, were used to evaluate the pore distribution. The error of porosity measurement was 0.1%. To prevent the generation of artifacts during EDS analysis and to ensure a high degree of accuracy (⫾0.05 at.%), the LSM/YSZ specimen was tilted to R. A. Cutler—contributing editor
Manuscript No. 186614. Received October 17, 2002; approved December 8, 2003. This work received financial support under Contract No. NSC 90-2216-E-002-028 and DAAD PPP Project No. 89021272.
*Member, American Ceramic Society.
†Author to whom correspondence should be addressed: 1 Roosevelt Rd. Section 4,
Taipei, Taiwan, 106, Republic of China. e-mail: [email protected].
1110
the edge-on condition and faced the EDS detector prior to EDS measurement, so that the width of reaction layers was precisely observed and analyzed. The EDS microanalysis of all cations was always performed along the line normal to the interface of LSM/YSZ and parallel to the direction of thickness fringe to keep the thickness factor constant. In addition, careful electron microscopy (EM) operation greatly reduced the spurious effects (such as fluorescence, absorption and beam broadening), which assured precise and reliable composition measurement.
III. Results and Discussion (1) Interfacial Reactions
Figure 1 shows SEM microstructures of the LSM/YSZ specimens, which were cofired at 1400°C for 1 to 48 h. The images show good bonding between LSM and YSZ. The interfaces between LSM and YSZ are sharp when cofired at 1400°C for 1 to 10 h, as shown in Figs. 1(a) and (b). However, two reaction layers, consisting of SZ and LZ in the range of 1– 6 m thickness, are found after cofiring for 48 h. The morpho-logic changes at the triple phase (pore/LSM/YSZ) boundary with increasing holding time are significant. Obviously, LSM/ YSZ specimens cofired at 1400°C for 10 h and longer show a decrease in pore number and growth in pore size at the triple phase boundary owing to the formation of a secondary phase and sintering of the LSM phase. It is believed that Ostwald
ripening may control the pore coarsening, leading to the significant reduction of pores at the triple phase boundary.
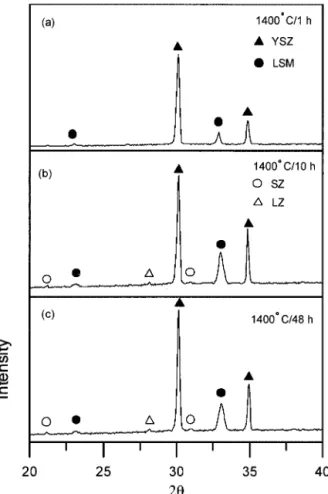
Figure 2 shows the XRD spectra of LSM/YSZ specimens, which were cofired at 1400°C for 1 h to 48 h. The results indicate that no detectable secondary phases can be found after cofiring at 1400°C for 1 h (Fig. 2(a)). However, extremely minor SZ and LZ phases are found after cofiring at 1400°C for 10 h or longer, as shown in Figs. 2(b) and (c). The formation of SZ and LZ is consistent with those reported in the literature.1– 4
Stochniol et al.9
reported that 20 to 40 mol% Sr-doped LaMnO3
with A-site deficiency shows no reaction products even after sintering at 1400°C for 200 h if the specimens were properly prepared. In this study, small amounts of SZ and LZ can still be found just after cofiring at 1400°C for 10 h. The formation of secondary phases confirmed by XRD and AEM with better resolution down to the nano-sized scale will be discussed below.
Figure 3 shows a set of TEM micrographs, a diffraction pattern, and EDS microanalysis of the LSM/YSZ specimen, cofired at 1400°C for 1 h. Figure 3(a) shows tiny LSM crystals in the size range of 30 –50 nm and the formation of a secondary phase. Figure 3(b) shows the magnified interface between LSM and YSZ, as the square indicated in Fig. 3(a). The image demonstrates the corrugated diffusion zone with a thickness of 60 –70 nm, mainly consisting of cubic YSZ partially substituted with Mn, La, and Sr. Also, the vermicular structure in the diffusion zone, probably indicating the amorphization of cubic fluorite YSZ, is found. Some of the nano-sized crystals, either SZ or LZ of 10 nm in size, are identified in the diffusion zone. The diffraction pattern of this diffusion zone, as shown in Fig. 3(c), is also composed of an amorphous ring, which is contrib-uted from the amorphous phase. The YSZ phase just neighbor-ing to this amorphous zone shows good crystallinity, as the pattern indexed in Fig. 3(c). Moreover, the concentration profile
Fig. 1. SEM microstructures of LSM/YSZ specimens, cofired at 1400°C for (a) 1, (b) 10, and (c) 48 h. Reaction products are found after cofiring at 1400°C for 48 h.
Fig. 2. XRD spectra of LSM/YSZ specimens, cofired at 1400°C for (a) 1, (b) 10, and (c) 48 h.
of a LSM/YSZ specimen as a function of diffusion depth is shown in Fig. 3(d). The concentration of Y and Zr in the amorphous diffusion zone decreases rapidly. Based on this observation, it is concluded that the formation of the diffusion zone is due to the diffusion of Mn, La, and Sr to YSZ and basically proceeds from LSM to YSZ unidirectionally. The thickness of the amorphous ZrO2 diffusion zone is only in the
range of 60 –70 nm.
(2) Reaction Mechanism and Kinetics
Assuming that the diffusion coefficient of each species remains constant at specified temperature and no volume change is in-volved in the diffusion zone, then the concentration of each cation can be expressed as
C共 x,t兲 ⫽ C0erfc关共x/2
冑
Dt兲兴 (1)where C(x,t) is the concentration at a given distance x and annealing time t, erfc is the complementary error function, and D is the diffusion coefficient. The diffusion coefficients of La, Sr, Mn, Y, and Zr at 1400°C for 1 h at a given diffusion distance of 100 nm are 5.8⫻ 10⫺19, 1.9⫻ 10⫺19, 1.5⫻ 10⫺18, 2.1⫻ 10⫺19, and 3.0⫻ 10⫺19m2
/s, respectively. Taimatsu et al.1
reported that the diffusion coefficient of the Mn cation in YSZ at 1400°C is in the range of 10⫺17to 10⫺18m2/s. This result is consistent with that reported in the literature.
Figure 4(a) shows the relationship between the thickness of the secondary phases and cofiring time of LSM/YSZ specimens, which were cofired from 1000° to 1400°C for up to 120 h. The diffusion coefficients (D) and reaction constant (k) as a function of the temperature of LSM/YSZ specimens are shown in Fig. 4(b). It
is assumed that the growth of reaction product obeys a parabolic law and can be expressed as follows:
x⫽ kt1/ 2 (2)
where x is the thickness of the reaction product, k is the reaction constant which is a function of temperature, and t is the reaction time. It is noted that the best-fitting lines in Fig. 4(a) do not intersect the origin. It implies the formation of the reaction layer undergoes an incubation period. Tiny (ca.⬍10 nm) crystals appear and are observed (Fig. 3(a)) after the incubation period of one hour. The formation and growth of the crystals are thermally activated processes.
By combining the Arrhenius equation with parabolic law, the factors controlling the formation of reaction can be resolved. Figure 4(b) shows that the Mn cation has the fastest diffusion coefficient among La, Sr, Mn, Y, and Zr species. Also, the Mn cation’s activation energy for the diffusion is 157 kJ/mol, which is close to that of the reaction constant k (147 kJ/mol). In other words, the formation of a reaction layer between LSM and YSZ is controlled by the diffusion of Mn. As discussed previously, the diffusion coefficient of Mn cation is 1.5⫻ 10⫺18m2/s. In addition, Kingery et al.11
and Simpson et al.12
reported that the diffusion coefficient of the oxygen ion in cubic CaO-stabilized ZrO2(CSZ)
is on the order of 10⫺10m2
/s. Since the local charge neutrality must be maintained during the Mn diffusion to YSZ, the negatively charged species such as the oxygen ion must migrate together with cations. Moreover, it has been proved that the negatively charged oxygen ion dominates the conduction of stabilized ZrO2, implying
the transference number of oxygen ion is almost unity at 1400°C in air.11–13Accordingly, the diffusion of Mn cation is controlled not only by that oxygen ion, but also by the ambipolar diffusion of a Mn–O pair, due to its relatively slow diffusion coefficient. Fig. 3. (a) TEM bright field image, (b) vermicular structure, (c) diffraction pattern, and (d) EDS microanalysis of the interface in LSM/YSZ specimens, which were cofired at 1400°C for 1 h. Note that g1⫽ [220], g2⫽ [511], g3⫽ [311], and zone axis is [114].
Previously we reported that the activation energy of oxygen ion for conduction in YSZ is 93 kJ/mol above the transition temper-ature of 550°C,14
which is lower than that of the Mn cation for diffusion (157 kJ/mol). However, Waller et al.15
reported that a high activation energy of 708 kJ/mol for Mn diffusion in 7.5 mol% polycrystalline YSZ was obtained. No explanation for this high activation energy or detailed reaction mechanisms were provided in their YSZ/manganese oxide diffusion couple. Because the transport of oxygen ion is through the movement of oxygen vacancy (VO
••
), the migration of oxygen vacancy should definitely affect the diffusion of the Mn cation in terms of ambipolar diffusion. In addition, Ioroi et al.16
reported that the activation energy of the oxygen ion diffusion in La0.85Sr0.15MnO3was 140
kJ/mol and its chemical diffusion coefficient of oxygen ion was about 5 ⫻ 10⫺9 m2
/s. Therefore, it can be derived that the diffusion coefficient of oxygen ion in either YSZ or LSM is on the order of 10⫺10m2
/s. This result is in general agreement with those reported in the literature.17–19
Moreover, the addition of Sr to LaMnO3 (LM) introduces the
point defect of Sr⬘Lain the LSM phase, which can be compensated
by either an oxygen vacancy ((VO••) or electron hole (h •
). Both charge compensation mechanisms result in changes in oxidation states of Mn. The coexistence of trivalent and tetravalent Mn ions, owing to the combination of trivalent Mn ion with h•
, takes place under the oxidizing conditions. Also, the highly stoichiometric
YSZ is relatively difficult to be reduced, and therefore the aliovalent solutes are generally compensated in charge. Since Mn2O3forms a solid solution with ZrO2within the solid solubility,
the possible defect reactions of trivalent and tetravalent Mn ions for the substitution of Zr ion are as follows:
2Mn2O3O¡ ZrO2 4Mn⬘Zr⫹ 6OO⫻⫹ 2VO • • (3) 2Mn2O3O¡ ZrO2 4Mn•••⫹ 6O O ⫻⫹ 3V Zr⬘⬘⬘⬘ (4) 4Mn2O3O¡ ZrO2 6Mn⬘Zr⫹ 12OO⫻⫹ 2Mni• • • (5) 2MnO2O¡ ZrO2 2MnZr⫻⫹ 4OO⫻ (6) MnO2O¡ ZrO2 Mni• • • •⫹ 2OO⫻⫹ VZr⬘⬘⬘⬘ (7)
Equations (3) to (5) show the replacement of Zr by trivalent Mn ions can be substitutionally, interstitially, or self-compensated, respectively. Equations (6) and (7) show the possible substitutional and interstitial charge compensation of Zr replaced by tetravalent Mn ions. Note that Mn ions are located in the B-site with coordination number (CN) ⫽ 6 in the perovskite structure. The radius of Mn3⫹is 0.58 Å, and that of Mn4⫹is 0.53 Å. Also the
radius of Zr4⫹is 0.84 Å for the CN⫽ 8 in fluorite structure. Since
the oxygen vacancy dominates the charge compensation in the case of stabilized ZrO2system, it is believed that the substitution
of Mn3⫹ and Mn4⫹for Zr4⫹within the solid solubility is also
charge compensated by the oxygen vacancy in the YSZ system.13
The defect chemistry of Mn ions in YSZ may be dominated by Eq. (3). The Brouwer approximation is given as follows:
关VO• •兴 ⫽
1 2关Y⬘Zr兴 ⫹
1
2关Mn⬘Zr兴 (8)
The substitution of Mn for Zr not only increases the concentra-tion of oxygen vacancies in YSZ, but also leads to the grain growth of YSZ. Later, the grain growth with the elimination of pores will be discussed. It is believed that the increase of vacancy concen-tration leads to the amorphization of YSZ, and enhances the diffusion of Zr toward LSM.
A reaction mechanism for the formation of secondary phases involving several steps is proposed: (1) Diffusion of cations (mainly Mn) from LSM leads to the amorphization of cubic fluorite structure of YSZ, owing to the fact that the Mn cation diffuses faster among five cationic species and is able to form a solid solution with YSZ. (2) LSM becomes rich in La and Sr due to the depletion of Mn, and tends to react with ZrO2as the ZrO2
diffuses from the amorphous layer, leading to the formation of LZ and SZ. (3) Transition of secondary phases from LZ to SZ takes place as the amount of SrO becomes richer behind the reaction front, giving a thin SZ layer neighboring the YSZ side. (4) Growth of a secondary phase due to the unidirectional diffusion of La, Sr, and Mn cations, and the counterdiffusion of ZrO2.
(3) Void-Free Zone (VFZ)
Two possible mechanisms may operate in the formation of VFZ. One is the Kirkendall effect, which involves the interdiffu-sion of cations and vacancies; the other is the effect of Mn substitution for Zr, resulting in the formation of VO••, as illustrated
in Eq. (3). Since the diffusion of cations from LSM to YSZ is identified, there’s a net mass transfer from LSM to YSZ. As each cation in the LSM makes a jump, the vacancy in the YSZ side moves in the opposite direction, leading to an unequal mass flow in the diffusing species, resulting in an equivalent flow of vacancy in the reverse direction and in the net flow of cations. Accordingly, a net flow of vacancies takes place from YSZ to LSM.
The second possibility for the formation of a VFZ is due to the Mn migration to YSZ. A concentration gradient of VO•• is built
Fig. 4. (a) Relationship between reaction thickness and cofiring time, and (b) diffusion coefficient of cations and reaction constant as a function of temperature for LSM/YSZ specimens. The specimens were cofired from 1000° to 1400°C for up to 1000 h.
across the interface due to the increased concentration of VO•• in
YSZ, resulting from the substitution of Mn for Zr. This driving force makes the residual pores in the interior of YSZ act as the vacancy sources and move toward the LSM, while those in LSM acting as the vacancy sources sink during the pore migration. Figure 5 shows the quantitative analysis of the porosity in the YSZ neighbor to the LSM. The formation of VFZ is a function of the annealing temperature and period. Note that the shape of the pores caused by pull-out during grinding is usually irregular while those due to incomplete sintering are spherical. Moreover, pore coars-ening at the triple phase boundary may lead to the decrease in catalytic sites, where electrochemical reaction takes place; small pores and high porosity are desired.
Figure 6 shows the TMA curves of bulky LSM and YSZ specimens sintered at 1400°C for 1 h. The result indicates the densification of LSM starts to take place at about 1000°C while that of YSZ occurs at about 1100°C. After holding at 1400°C for 1 h, the shrinkage of LSM and YSZ is 23.2% and 21.7%, respectively. The results indicate that the lowest temperature for the mass and vacancy diffusions is 1000°C. Two possible mech-anisms for the formation of a VFZ operate at 1400°C, and may be active as low as 1100°C in YSZ.
It is also noted that the porosity next to the exterior surface is lower than that in the interior of a LSM/YSZ sandwiched structure, suggesting a higher degree of final densification takes place on the exterior surface than on the interior. Moreover, the grain sizes of YSZ near the LSM are larger than those in the YSZ matrix. The exaggerated grain growth of YSZ could be due to both the lack of a barrier to grain boundary movement (elimination of pores) and the enhancement by the diffusion of cations, especially Mn ions.
(4) Long-Term Stability Test at 1000°C
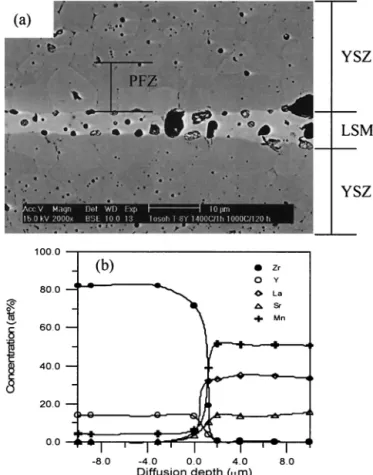
The current operating temperature of the Ni/YSZ/LSM SOFC system is⬍850°C.2
The test of long-term stability of the LSM/YSZ at 1000°C was attempted to accelerate the possible reaction at the interface. Figure 7 shows the SEM micrograph and semiquantitative EDS results of the LSM/YSZ sandwiched specimen, which was cofired at 1400°C for 1 h and annealed at 1000°C for 120 h. The micrograph shows similar microstruc-tural features, such as a void-free zone (VFZ) and pore or grain coarsening. The EDS result (Fig. 7(b)) has confirmed that the diffusion of Mn to YSZ takes longer distance, while the diffusion of La and Sr is relatively short.
Kleveland et al.4
reported that the diffusion of Mn leads to the grain growth of YSZ. Also, Kim et al.20
reported that the
solid solubility of Mn2O3in 8 mol% yttria-stabilized zirconia is
around 12 mol% at 1400°C. The grain size of YSZ increases with an increase in Mn2O3content within the solubility limit in
YSZ.20
While exceeding the solubility limit, the grain size of YSZ decreases because Mn2O3appears as a second phase and
hinders the grain growth of YSZ. In the present research, the diffusion of Mn to YSZ is assured and forms a solid solution with YSZ because no precipitation of Mn2O3 is found. The
substitution of Mn into YSZ enhances the grain growth of YSZ. Moreover, the grain growth of YSZ due to the temperature effect at 1000°C could be ignored, because the grain growth of YSZ should remain sluggish at temperatures lower than 1100°C, as shown in Fig. 6.
Fig. 5. Porosity distribution of LSM/YSZ specimens, measured perpen-dicular to LSM cathode. The specimens were cofired at 1400°C for 24, 36, and 48 h.
Fig. 6. TMA results of bulky LSM and YSZ specimens, sintered at 1400°C for 1 h.
Fig. 7. (a) SEM image and (b) the semiquantitative EDS analysis of the LSM/YSZ specimen, cofired at 1400°C for 1 h and annealed at 1000°C for 120 h.
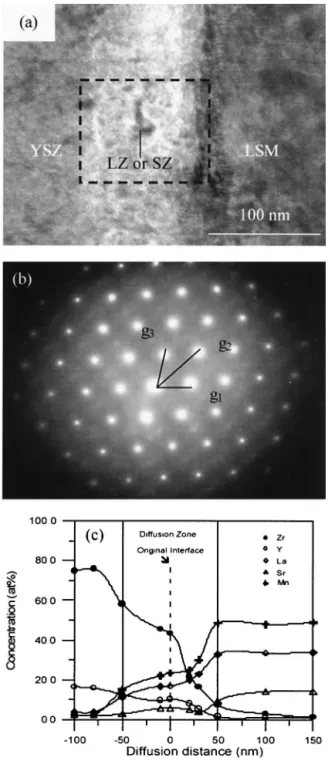
Figure 8 shows the TEM micrograph, diffraction pattern, and concentration profile of a LSM/YSZ specimen which was cofired at 1400°C for 1 h, and then annealed at 1000°C for 1000 h. The TEM image shows that a crystalline diffusion layer of 100 nm is formed between YSZ and LSM, as shown in Fig. 8(a). The thickness of the layer is slightly greater than the one (60 –70 nm) shown in Fig. 3(b). The diffraction pattern of this diffusion layer, as indicated by the dotted square, is shown in Fig. 8(b). The result shows good crystallinity of this diffusion layer. The EDS microanalysis, as shown in Fig. 8(c), shows the presence of La, Sr, and Mn in YSZ. Basically, the structure of this crystalline diffusion layer consists of the fluorite structure. The initially amorphous diffusion zone after cofiring at 1400°C for 1 h, as shown in Fig. 3, crystallizes after annealing at 1000°C for 1000 h. In addition to the original nuclei of LZ and SZ, as indicated by the arrow, no additional secondary phases
are found. Therefore, it is believed that the recrystallization of this diffusion zone may inhibit the formation of additional secondary phases (SZ and LZ) due to its slow diffusion in the crystalline solid phase.
IV. Conclusions
The conclusions of this work are as follows:
(1) Interdiffusion indeed occurs at the interface between LSM and YSZ after cofiring at 1400°C even as short as 1 h. The diffusion of La, Sr and Mn caused the amorphization of YSZ, and the thickness of this amorphous diffusion zone is only about 70 nm. The diffusion of La, Sr, and Mn toward YSZ is pronounced when compared with Zr and Y toward LSM.
(2) Two reaction products, identified as SZ and LZ, are formed, and the reaction thickness increases with an increase in the cofiring temperatures and soaking time. The number of pores at the three-phase boundary is greatly reduced because of the formation of secondary phases and the sintering effect at 1400°C.
(3) A reaction mechanism of the formation of LZ and SZ involving a series of steps is proposed. The results show that the ambipolar diffusion of a Mn–O pair plays an important role in the formation of secondary phases. The activation energy of Mn diffusion in YSZ is 157 kJ/mol. This means the diffusion of the Mn–O pair may be strongly dependent on the migration of oxygen vacancy.
(4) A void-free zone (VFZ) in the range of tens of microme-ters is formed. The movement of pores from YSZ leads to the formation of a VFZ and could be enhanced and dominated by two mechanisms, the Kirkendall effect and vacancy formation by Mn substitution for Zr.
(5) No additional reaction products can be found after the long-term stability test at 1000°C for up to 1000 h. The initially amorphous diffusion zone transforms to crystalline phases after annealing, which may prevent the further nucleation and growth of LZ and SZ.
Acknowledgments
The authors appreciate the technical support from staff members of the University of Erlangen-Nuremberg, Glass and Ceramics, Germany.
References
1H. Taimatsu, K. Wada, and H. Kaneko, “Mechanism of Reaction between
Lanthanum Manganite and Yttria-Stabilized Zirconia,” J. Am. Ceram. Soc., 75 [2] 401–405 (1992).
2N. Q. Minh, “Ceramic Fuel Cells,” J. Am. Ceram. Soc., 76 [3] 563– 88 (1993). 3K. Wiik, C. R. Schmidt, S. Faaland, S. Shamsili, M. A. Einarsrud, and T.
Grande, “Reactions between Strontium-Substituted Lanthanum Manganite and Yttria-Stabilized Zirconia: I, Powder Samples,” J. Am. Ceram. Soc., 82 [3] 721–28 (1999).
4K. Kleveland, M. A. Einarsrud, C. S. Schmidt, S. Shamsili, S. Faaland, K. Wiik,
and T. Grande, “Reactions between Strontium-Substituted Lanthanum Manganite and Yttria-Stabilized Zirconia: II, Diffusion Couples,” J. Am. Ceram. Soc., 82 [3] 729 –34 (1999).
5S. Faaland, M. A. Einarsrud, K. Wiik, and T. Grande, “Reactions Between
La1⫺xCaxMnO3and CaO-Stabilized ZrO2: Part I. Powder Mixtures,” J. Mater. Sci., 34, 957– 66 (1999).
6S. Faaland, M. A. Einarsrud, K. Wiik, and T. Grande, “Reactions Between
La1⫺xCaxMnO3and CaO-Stabilized ZrO2: Part II. Diffusion Couples,” J. Mater. Sci., 34, 5811–19 (1999).
7Y. C. Hsiao and J. R. Selman, “The Degradation of SOFC Electrodes,” Solid State
Ionics, 98, 33–38 (1997).
8H. Y. Lee and S. M. Oh, “Origin of Cathodic Degradation and New Phase
Formation at the La0.9Sr0.1MnO3/YSZ Interface,” Solid State Ionics, 90, 133– 40
(1996).
9G. Stochniol, E. Syskakis, and A. Naoumidis, “Chemical Compatibility between
Strontium-Doped Lanthanum Manganite and Yttria-Stabilized Zirconia,” J. Am.
Ceram. Soc., 78 [4] 929 –32 (1995).
10O. Yamamoto, Y. Takeda, N. Imanishi, and Y. Sakaki, “Electrochemical
Properties of La1⫺xCaxMnO3⫺zas Cathode in SOFC”; pp. 205–12 in Proceedings of
the Third International Symposium on Solid Oxide Fuel Cells. Edited by S. C. Singhal
and H. Iwahara. The Electrochemical Society, Inc., Pennington, NJ, 1993.
11W. D. Kingery, J. Pappis, M. E. Doty, and D. C. Hill, “Oxygen Ion Mobility in
Cubic Zr0.85Ca0.15O1.85,” J. Am. Ceram. Soc., 42 [8] 393–98 (1959).
Fig. 8. LSM/YSZ specimen, which was cofired at 1400°C for 1 h and then annealed at 1000°C for 1000 h, showing (a) TEM micrograph, (b) diffraction pattern, and (c) concentration profile. Note that g1⫽ [111],
12L. A. Simpson and R. E. Carter, “Oxygen Exchange and Diffusion in
Calcia-Stabilized Zirconia,” J. Am. Ceram. Soc., 49 [3] 139 – 44 (1966).
13Y.-M. Chiang, D. P. Birnie III, and W. D. Kingery, “Defects in Ceramics”; pp.
101– 84 in Physical Ceramics: Principles for Ceramic Science and Engineering. Wiley, Hoboken, NJ, 1997.
14C. C. T. Yang and W. J. Wei, “Electrical Conductivity and Microstructure of
La0.65Sr0.3MnO3– 8 mol% Yttria-Stabilized Zirconia,” Mater. Chem. Phys. 81,
134 – 42 (2003).
15D. Waller, J. D. Sirman, and J. A. Kilner, “Manganese Diffusion in Single Crystal
and Polycrystalline Yttria-Stabilized Zirconia,” Proc.—Electrochem. Soc., 97 [18] 1140 – 49 (1997).
16T. Ioroi, T. Hara, Y. Uchimoto, Z. Ogumi, and Z. I. Takehara, “Preparation of
Perovskite-Type La1⫺xSrxMnO3Films by Vapor-Phase Processes and Their
Electro-chemical Properties,” J. Electrochem. Soc., 145 [6] 1999 –2004 (1998).
17S. P. S. Badwal, S. P. Jiang, J. Love, J. Nowotny, M. Rekas, and E. R. Vance,
“Chemical Diffusion in Perovskite Cathodes of Solid Oxide Fuel Cells: The Sr-Doped LaMn1⫺xMxO3 (M ⫽ Co, Fe) Systems,” Ceram. Int., 27, 419 –29
(2001).
18S. P. S. Badwal, S. P. Jiang, J. Love, J. Nowotny, M. Rekas, and E. R. Vance,
“A Manometric Method for the Determination of Chemical Diffusion in Perovskite-Type Cathode Materials of the Solid Oxide Fuel Cell,” Ceram. Int., 27, 431– 41 (2001).
19P. S. Manning, J. D. Sirman, R. A. D. Souza, and J. A. Kilner, “The Kinetics of
Oxygen Transport in 9.5 mol% Single Crystal Yttria-Stabilized Zirconia,” Solid State
Ionics, 100, 1–10 (1997).
20J. H. Kim and G. M. Choi, “Mixed Ionic and Electronic Conductivity of