KUN-HU CHEN, CHIA-HUEI WU and GRACE YAO
APPLICABILITY OF THE WHOQOL-BREF ON EARLY ADOLESCENCE
(Accepted 24 June 2005)
ABSTRACT. The WHOQOL-BREF is one of the cross-cultural and widely used measures for assessing health-related quality of life (HRQOL). Previous studies of the HRQOL using the WHOQOL-BREF mainly focused on adult; however, there has been less work carried out on assessing the HRQOL on early adolescence. The goal of this study was to examine the applicability of the WHOQOL-BREF Taiwan version in early adolescent sample. A total of 365 junior high school students par-ticipated in this study. Participants completed the WHOQOL-BREF Taiwan version and five visual-analogue items on HRQOL evaluation. The results supported the originally designed four-factor model, and also indicated good item discrimination, internal reliability, factorial validity (by using confirmatory factor analysis) and construct validity (e.g., predictive validity, discriminant and convergent validity) after deleting two physical health items (i.e., ‘‘To what extent do you feel that your pain hinders you in doing what you need to do’’; ‘‘Do you need medical treatment to cope with your daily life?’’) and one social relationships item (i.e., ‘‘Are you satisfied with your sex life?’’). Overall, this study provides the applicability of the WHOQOL-BREF Taiwan version in early adolescence. In addition, the WHOQOL-WHOQOL-BREF Taiwan version may be of use to health professionals in the assessment and com-parison of different age groups from early adolescence to adulthood.
KEY WORDS: health-related quality of life, WHOQOL-BREF, early adolescence
INTRODUCTION
During the past two decades, health-related quality of life (HRQOL) has become an important issue in medical and psychological research. Not only did many studies assess patients’ HRQOL in clinical trials, but also did they attempt to investigate the determinants of HRQOL. The WHOQOL-BREF, the short version of the WHOQOL-100, is one of the cross-cultural and widely used measures for assessing HRQOL. Previous studies that adopted the WHOQOL-BREF
mainly focus on the adult or aging population, particularly over 18 years old (WHOQOL Group, 1998a, b; Skevington, 2002). However, the literature shows that there has been less work con-ducted in examining the HRQOL in early adolescence.
Adolescence, a transitional stage between dependent childhood and independent adulthood, is often regarded as a stage with heightened risk for future positive development (Adams et al., 1994). Prior studies suggested that adolescence is a particularly vulnerable period in terms of adjustment (Irwin, 1987; Adams et al., 1990). Accordingly, understanding and monitoring adolescents’ HRQOL may facilitate researchers and clinical practitioners to help adoles-cents with acute and/or chronic dysfunctions following a stress event or treatment, long-term survivors with emerging problems, and individuals who are at risk for developing psychological difficulties (Mulhern et al., 1989; Eiser, 1995; Eiser and Morse, 2001). In addi-tion, the HRQOL is cumulative in the sense that problems in early childhood and adolescence surf up in adulthood, and thus focusing on adolescents’ HRQOL at early adolescence may be an effective way in reducing vulnerability in development (Jirojanakul et al., 2003).
This study proposed to use the WHOQOL-BREF Taiwan version to assess adolescents’ HRQOL. Although there are several HRQOL measurements available for the adolescents (e.g., Quality of Life Profile-Adolescent version) (Raphael et al., 1996), the WHOQOL-BREF has some advantages for assessing adolescents’ HRQOL. First, the WHOQOL-BREF is a well-established cross-cultural HRQOL measurement. Second, the WHOQOL-BREF was devel-oped for generic use. In other words, the advantage of using the WHOQOL-BREF is that it allows comparisons to be done between different cultures and across different age groups.
However, prior studies on the WHOQOL-BREF development were almost based on adults or adult patients (WHOQOL Group, 1998a; Yao et al., 2002), only few studies did investigations for young people by using the WHOQOL-BREF. There are some studies that presented the HRQOL data on young people using the WHOQOL-BREF (Skevington et al., 2004), but there is still a lack of discussion about its applicability or validation in the early adolescent age group. Perhaps early adolescence would reflect similar HRQOL domains as in adult-hood, but some facets (items) may not represent early adolescent characteristics (e.g., sex life, pain and discomfort). To extend the
applicability of the WHOQOL-BREF, this study attempted to exam-ine its psychometric properties in early adolescent sample in Taiwan.
METHOD Participants
A total of 365 junior high school students from two schools in Taiwan participated in this study (mean age = 13.41, SD = 0.42, age range from 12.58 to 14.78). In consideration of avoid possible sampling bias, this study selected one school from metropolitan area and the other one from the county area in Taiwan. The former is located in the Taipei metropolitan area, and the latter located in the Taichung County. Among this sample, 183 participants were males (50.1%), and 181 participants were females (49.6%). One participant did not report his/her sex and 11 participants did not report his/her age. All participants completed the following measures.
Instrument
WHOQOL-BREF Taiwan version. The World Health Organization (WHO, 1993, 1995) defines ‘‘quality of life’’ as individuals’ perception of their position in life in the context of the culture and value systems in which they live and in relation to their goals, expectations, stan-dards and concerns. It is a broad-ranging concept affected in a complex way by the person’s physical health, psychological state, level of independence, social relationships, personal beliefs, and relationship to salient features of the environment. Based on this definition, the WHOQOL group initiated a cross-cultural project to develop the WHOQOL questionnaire (WHOQOL-100) for generic use in 1991, and completed the filed tests in 1995. Later, the WHO-QOL Group simplified the standard WHOWHO-QOL-100, which is too long for practical purposes such as clinical evaluation or epidemio-logic surveys, into a short form termed the WHOQOL-BREF. The WHOQOL-BREF contains four domains: physical health, psycho-logical, social relationships, and environmental.
In this study, The WHOQOL-BREF Taiwan version was used. It was developed from the WHOQOL-BREF, containing four domains
related to quality of life (physical health, psychological, social rela-tionships, and environmental) as well as one facet measuring overall quality of life and general health. It contains 28 items, comprised of 26 standard items of the WHOQOL-BREF and two (culturally rel-evant) national items. The 26 standard items were consisted of one item from each of the 24 facets of the WHOQOL-100 and two items from the overall quality of life and general health facet. In the WHOQOL-BREF Taiwan version, the two national items are ‘‘Do you feel respected by others?’’, which was included in the social relationships domain and ‘‘Are you usually able to get the things you like to eat?’’, which was included in the environment domain.
In Yao et al. study (2002), exploratory and confirmatory factor analyses of the WHOQOL-BREF Taiwan version revealed a four-factor model (physical health, psychological, social relationships, and environmental factors). The internal consistency (Cronbach’s alpha) coefficients ranged from 0.70 to 0.77 for the four domains (0.73 to 0.83 in this study). The test–retest reliability coefficients with interval 2–4 weeks ranged from 0.41 to 0.79 at item/facet level and 0.76 to 0.80 at domain level (all p < 0.01). Content validity coefficients were in the range of 0.53–0.78 for item-domain correlations and 0.51–0.64 for inter-domain correlations (all p < 0.01). In this study, the four domain scores (physical health, psychological, social relationships, and environmental domains) were computed by the standard scoring algorithms of the WHOQOL-BREF Taiwan version. Scores were ranged from 4 to 20. In addition, the two items measuring overall quality of life and general health were averaged to represent overall health-related quality of life.
Visual-analogue HRQOL items (HRQOL VAS). Five visual-analogue items were used to evaluate the participants’ satisfaction on physical health, psychological, social relationships, environmental and the overall health-related QOL (e.g., ‘‘In general, how satisfied are you with your physical health status?’’ ‘‘In general, how satis-fied are you with your psychological status?’’ ‘‘In general, how satisfied are you with your social relationships status?’’ and so on). These items were used as criterion variables in the development of WHOQOL-BREF Taiwan version (WHOQOL-Taiwan Group, 2001). For each item, participants indicate their satisfaction and specify the value on a 10 cm visual-analogue scale. The score of each item ranged from 0 (worst) to 100 (best).
RESULTS Descriptive Analysis
Table I presents descriptive statistics of each item in the WHOQOL-BREF and five visual-analogue HRQOL items. According to the results, the item ‘‘Are you satisfied with your sex life?’’ had high percentage of respondents with missing values (only 151 (41%) par-ticipants answered the question; other items did not have missing values). It may imply that the item is not suitable for adolescents to evaluate their HRQOL. Thus, the item was deleted in following analyses. In addition, except that the item ‘‘Do you need medical treatment to cope with your daily life?’’ exhibited a ceiling effect with the current sample (54.5% participants selected the category of ‘‘do not need’’ on this item), results of floor effect (indexing as the pro-portion for the worst category on response scale) and ceiling effect (indexing as the proportion for the best category on response scale) analysis of each item were acceptable.
Item Analysis
Table II shows relevant information on item analysis, including cor-rected item-total correlation within each domain (the correlation be-tween one item and the domain total scores that computed by summing other items in the same domain), internal consistency (Cronbach’s a) of each domain, and item discrimination with domain scores as the cri-terion (in practice, we use domain score to divide highest 30% and lowest 30% participants into high/low groups, and to see if these two groups have a significant difference on an item score. If this comparison is significant, the item discrimination was hold.). The two items mea-suring the overall quality of life and general health were not analyzed. On corrected item-total correlation within each domain, except two items that measuring ‘‘pain and discomfort’’ and ‘‘dependence on medicinal substances and medical aids’’ in the physical health domain had poor correlations (0.14 and 0.16), the rest of the items of the WHOQOL-BREF had acceptable correlations (0.33–0.61) with its corrected domain scores.
On internal consistency (Cronbach’s a), the coefficient a of physical health domain was 0.67 with 7 items. However, according to the
TABLE I Descriptive Statistics (N =365) WHOQOL-BREF Mean Std. Skewness Kurtosis Floor effect (%) Ceiling effect (%) General health In general, How would you rate your quality of life? 3.35 0.74 0.12 0.62 1.1 6.3 In general, How satisfied are you with your health? 3.38 0.99 ) 0.31 ) 0.33 3.6 11.5 Physical Health To what extent do you feel that your pain hinders you in doing what you need to do? a 3.22 1.02 ) 0.34 ) 0.54 5.2 7.4 Do you need medical treatment to cope with your daily life? a 4.29 0.92 ) 1.14 0.51 0.5 54.5 Do you have enough energy for your daily life? 3.03 0.97 ) 0.02 ) 0.32 5.5 6.0 How is your ability to get around? 3.76 1.09 ) 0.55 ) 0.51 2.7 30.7 How satisfied are you with the sleep you get? 2.96 1.12 0.01 ) 0.76 10.1 8.8 Are you satisfied with your ability to perform your daily 3.45 0.91 ) 0.13 ) 0.27 1.6 12.9 Are you satisfied with your work ability? 3.22 0.96 ) 0.07 ) 0.10 4.1 9.9 Psychological Do you enjoy your life? 3.10 1.01 0.06 ) 0.54 4.4 9.0 Do you feel your life has meaning? 3.43 1.19 ) 0.22 ) 0.97 5.2 23.6 How good is your ability to concentrate? 3.21 1.04 ) 0.10 ) 0.41 5.5 11.8 Can you satisfied with your self? 3.25 0.99 0.09 ) 0.41 3.0 12.9 Are you satisfied with yourself? 3.27 1.08 ) 0.10 ) 0.49 5.8 15.3 Do you offten have negative feelings ? a 2.75 1.00 ) 0.06 ) 0.46 13.2 3.3
Social Relationships Are you statisfied with your personal relationships? 3.33 1.06 ) 0.27 ) 0.39 5.8 14.2 Are you satisfied with your sex life? c 3.04 1.22 ) 0.14 ) 0.59 6.8 6.0 Are you satisfied with the support you get from your friends? 3.73 0.99 ) 0.68 0.32 3.6 22.5 Do you feel respected by others? b 3.04 0.91 ) 0.05 0.11 5.2 5.5 Environmental How safe do you feel in your daily life? 3.17 1.06 ) 0.30 ) 0.46 7.7 8.5 Do you live in a healthy environment? 3.02 1.06 ) 0.22 ) 0.36 10.7 7.1 Do you have enough money for whatever you need? 3.03 1.15 0.00 ) 0.70 10.1 11.8 Is it convenient for you get the daily information you need? 3.41 1.02 ) 0.11 ) 0.54 2.7 16.4 Do you have the opportunity to take leisure time? 3.58 1.06 ) 0.23 ) 0.96 1.1 22.5 Are you satisfied with your living conditions? 3.51 1.04 ) 0.47 ) 0.22 4.4 16.7 Are you satisfied with how convenient it is for you to get medical 3.61 0.88 ) 0.29 0.19 1.9 15.6 Are you satisfied with the transportation you use? 3.65 0.95 ) 0.36 ) 0.16 1.9 19.7 Are you usually able to get the things you like to eat? b 3.32 0.84 0.01 ) 0.17 1.1 7.7 VAS Items Physical Health 69.28 22.58 ) 0.69 0.01 )) Psychological 67.08 24.40 ) 0.81 0.13 )) Social Relations 66.98 21.51 ) 0.79 0.60 )) Environmental 72.79 21.68 ) 1.07 0.76 )) Health-related Quality of Life 71.71 20.28 ) 0.89 0.98 )) Note . a Reversed item scores have been recorded; b National items; c only 151 participants answered this item.
TABLE II Item Analysis Facet Corrected item-total correlation Alpha if item deleted Item Discriminant with domain score (df of t-test) PHY df = 184 (98 vs. 88) Pain and discomfort 0.14 0.70 – 6.33 ** Dependence on medicinal substances and medical aids 0.16 0.69 – 7.51 ** Energy and fatigue 0.47 0.61 0.71 12.64 ** Mobility 0.39 0.64 0.74 11.98 ** Sleep and rest 0.49 0.60 0.69 15.60 ** Activities of daily living 0.61 0.58 0.67 15.93 ** Work capacity 0.47 0.61 0.71 12.38 ** Internal consistency alpha 0.67 0.75 PSY df = 168 (92 vs. 78) Positive feelings 0.41 0.73 – 12.08 ** Religion/spirituality/personal beliefs 0.61 0.68 – 24.18 ** Thinking, learning, memory and concentration 0.35 0.75 – 10.59 ** Bodily image and appearance 0.56 0.69 – 14.13 ** Self-esteem 0.64 0.67 – 18.56 ** Negative feelings 0.36 0.74 – 10.63 ** Internal consistency alpha 0.75 SOC df = 169 (72 vs. 99) Personal relationships 0.54 0.53 – 21.79 ** Social support 0.46 0.63 – 15.65 ** Respected by others a 0.49 0.59 – 16.92 ** Internal consistency alpha 0.68
ENV df = 162 (88 vs. 76) Freedom, physical safety and security 0.51 0.77 – 11.74 ** Physical environment 0.33 0.79 – 8.52 ** Financial resources 0.54 0.76 – 18.78 ** Opportunities for acquiring new information and skills 0.58 0.76 – 15.80 ** Participation in and opportunities for recreation/leisure 0.34 0.79 – 10.12 ** Home environment 0.58 0.76 – 15.77 ** Health and social care: accessibility and quality 0.56 0.76 – 12.55 ** Transport 0.56 0.76 – 13.45 ** Food a 0.36 0.79 – 8.67 ** Internal consistency alpha 0.79 Note : Items are presented by facet name. PHY : physical health domain; PSY : psychological domain; SOC ; social relationships domain; ENV : environmental domain. ** p < 0.01. a National items.
information on ‘‘Alpha if item deleted’’, the coefficient a of physical health domain could increase if the two items measuring ‘‘pain and discomfort’’ and ‘‘ dependence on medicinal substances and medical aids’’ were deleted. Indeed, deleting the two items, the coefficient a of physical health domain reached to 0.75 with 5 items. Meanwhile, the internal consistency coefficients of psychological domain (0.75), social relationships domain (0.68), and environmental domain (0.79) were acceptable, although the value of social relation domain was some-what lower.
Finally, on item discrimination, domain score was used as the criterion to select higher and lower 25–30% of the participants for defining high and low score groups within each domain. Since the distributions of each domain score were not the same, the sizes of high or low score groups of each domain would be different. Regarding to the physical health domain, there were 98 subjects in low score group and 88 subjects in high score group. The means of each item in the physical health domain were compared between the two groups using independent t-test. With 184 df, the results of t-test revealed that the seven items of the physical health domain could discriminate the differences between the two groups. This same pro-cedure was applied to other domains as well. Table II reveals that all items had good property of item discrimination.
Confirmatory Factor Analysis
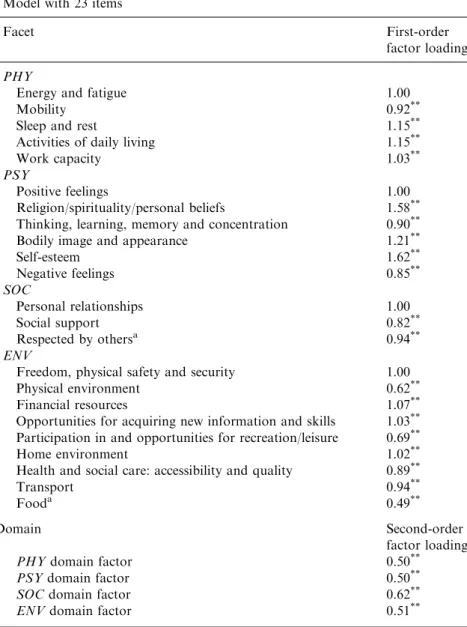
In order to examine the factor validity of the WHOQOL-BREF Taiwan version among early adolescent population, confirmatory factor analysis (CFA) was used to examine the hierarchical factor model of the WHOQOL-BREF Taiwan version (Yao et al., 2002) using LISREL 8 (Joreskog and Sorbom, 1993). Excluding two general items measuring overall QOL and general health, the item measuring satisfaction on sex life, and the two items measuring ‘‘pain and dis-comfort’’ and ‘‘dependence on medicinal substances and medical aids,’’ there were 23 items in this model, in which 5 items for physical domain, 6 items for psychological domain, 3 items for social domain, and 9 items for environmental domain. In this hierarchical model, a common QOL factor influenced four domain factors, which were indicated by its items. Besides, the unique variances of each variable were uncorrelated. To estimate parameters, factor variance of the
common QOL factor was set to be one, and one item loading was set to be one within each first-order factor. This model was an over-identification model with 226 df (276 data points with 50 parameters). Maximum likelihood method was used for model estimation.
The CFA results were presented in the second column of Table III. In this model, all items had substantial factor loadings. Meanwhile, except for Chi-square test (v2 (226) = 573.44, p < 0.05), fit indices reveled that this revised hierarchical model was acceptable (NFI = 0.93; NNFI = 0.95; CFI = 0.96; IFI = 0.96; RFI= 0.92; CN = 177.70; RMR = 0.062; standardized RMR = 0.059; RMSEA= 0.066; 90% C.I. for RMSEA = 0.060; 0.073), suggesting that the model is acceptable.
Predictive Validity on the Overall Health and the Overall HRQOL VAS Scores
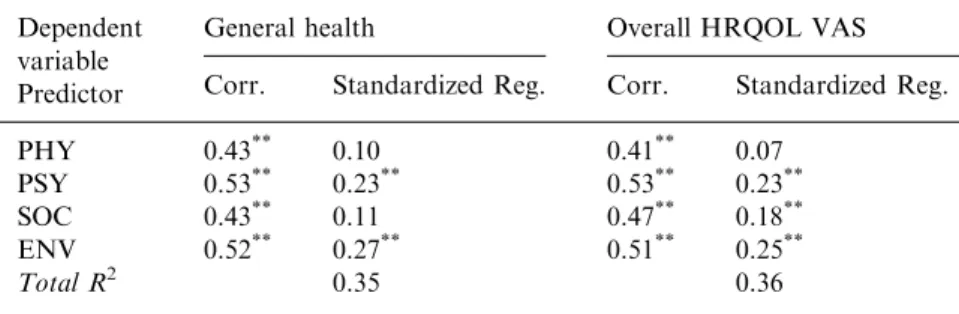
Predictive validity of the left 23 items (5 items for physical domain, 6 items for psychological domain, 3 items for social domain, and 9 items for environmental domain) was investigated in predicting the overall HRQOL score (computing from averaging the two general items measuring overall QOL and general health in WHOQOL-BREF) and the overall HRQOL VAS score. First, the left 23 items were used to compute four domain scores using standard scoring method for WHOQOL-BREF. These domain scores ranged from 4 to 20. Then, the four domain scores were correlated with overall HRQOL score (from WHOQOL-BREF) and the overall HRQOL VAS score. The results, presented in Table IV, indicated that the correlations between the four domain scores and the overall HRQOL (from WHOQOL-BREF) were 0.43 (physical health domain), 0.53 (psychological do-main), 0.43 (social relationships dodo-main), and 0.52 (environmental domain). The correlations between the four domain scores and the overall HRQOL VAS score were 0.41 (physical health domain), 0.53 (psychological domain), 0.47 (social relationships domain), and 0.51 (environmental domain). All of them were significant (p < 0.01).
Furthermore, the overall HRQOL (from WHOQOL-BREF) and the overall HRQOL VAS scores were regressed on the four domain scores, respectively. Regression analysis results are presented in Table IV. For the overall HRQOL (from WHOQOL-BREF), only psychological and environmental domains had significant positive
TABLE III
Unstandardized Estimation of Confirmatory Factor Analysis with Two Models
Model with 23 items
Facet First-order
factor loading PHY
Energy and fatigue 1.00
Mobility 0.92**
Sleep and rest 1.15**
Activities of daily living 1.15**
Work capacity 1.03**
PSY
Positive feelings 1.00
Religion/spirituality/personal beliefs 1.58**
Thinking, learning, memory and concentration 0.90**
Bodily image and appearance 1.21**
Self-esteem 1.62** Negative feelings 0.85** SOC Personal relationships 1.00 Social support 0.82** Respected by othersa 0.94** ENV
Freedom, physical safety and security 1.00
Physical environment 0.62**
Financial resources 1.07**
Opportunities for acquiring new information and skills 1.03**
Participation in and opportunities for recreation/leisure 0.69**
Home environment 1.02**
Health and social care: accessibility and quality 0.89**
Transport 0.94**
Fooda 0.49**
Domain Second-order
factor loading
PHYdomain factor 0.50**
PSYdomain factor 0.50**
SOCdomain factor 0.62**
ENVdomain factor 0.51**
Fit index for 23-item model: v2(226) = 573.44, p < 0.05; NFI= 0.93; NNFI = 0.95;
CFI = 0.96; IFI = 0.96; RFI= 0.92; CN = 177.70; RMR = 0.062; standardized RMR = 0.059; RMSEA= 0.066.
Note: Items are presented by facet name. PHY: physical health domain; PSY: psychological domain; SOC; social relationships domain; ENV: environmental
domain;**
p< 0.01.
a
effect. For the overall HRQOL VAS score, physical, psychological and environmental domains had significant positive effect. Obviously, not all domains had significant predicting effect on the global mea-sures. This finding may result from the high correlation between the four domains (0.44–0.63). However, the VIF and TOLERANCE information of the two regression model showed that the collinearity problem is not serious. The VIF and TOLERANCE for the four domain scores in the two regression model were lower than 2.25 and higher than 0.44, respectively. This information suggested that the collinearity problem may exist but not be serious. Thus, the regres-sion results were acceptable. The multiple determination coefficients (R2) of the two regression models were 0.35 and 0.36, respectively. Generally, from correlation results and multiple determination coefficients (R2) of regression models, it is acceptable to state that the four domain scores that computed from the left 23 items have good predictive validity on the overall HRQOL (from WHOQOL-BREF) and the overall HRQOL VAS scores.
Discriminant and Convergent Validity with VAS Items and Domain Scores
A correlation matrix of the four domain scores and four corre-sponding visual-analogue items was performed to examine the dis-criminant and convergent validity. According to the structure of the WHOQOL-BREF, it is expected that any domain score would have higher correlation with its corresponding VAS item than VAS items
TABLE IV
Regression Analysis with Standardized Coefficients
Dependent variable Predictor
General health Overall HRQOL VAS
Corr. Standardized Reg. Corr. Standardized Reg.
PHY 0.43** 0.10 0.41** 0.07
PSY 0.53** 0.23** 0.53** 0.23**
SOC 0.43** 0.11 0.47** 0.18**
ENV 0.52** 0.27** 0.51** 0.25**
Total R2 0.35 0.36
Note: PHY: physical health domain; PSY: psychological domain; SOC: social
for other domains. That is, physical health domain score should have higher correlation with physical VAS item than psychological, social relationships and environmental VAS items.
The correlation matrix is presented in Table V. In order to examine if the diagonal correlations were significantly higher than the off-diagonal correlations, the correlations was compared using the model comparison approach in structural equation models (SEM; see Cheung and Chan, 2004). In original model, the eight scores were regarded as eight exogenous factors indicated by each score with factor loadings as 1, so that the factor correlations were the corre-lations among the eight scores. Then, the diagonal correlation of a domain was constrained as any one of off-diagonal correlation of that domain, and the Chi-square test for this constrained model was then the test in examining if the diagonal correlation was significantly different from the off-diagonal correlations.
Specifically, in the Table V, the diagonal correlation for PHY domain was 0.40, and the off-diagonal correlations for PSY domain were 0.33, 0.34, 0.42, 0.47, 0.35, and 0.43. Therefore, we constrained the diagonal correlations as 0.33, 0.34, 0.42, 0.47, 0.35, and 0.43, once at a time. And then, the Chi-square difference test was conducted to see if the unconstrained and constrained correlations models are significantly different. If so, it suggests that the diagonal correlation of a domain is different from the off-diagonal correlation of that domain and implies that the domain has discriminant validity from other domains. According to this procedure, the Chi-square values of Chi-square difference tests for PHY domain were 2.56, 1.93, 0.14, 2.40, 1.38, and 0.37 for each off-diagonal correlations mentioned
TABLE V
Correlations among Four Domain Scores and Four Visual-Analogue HRQOL Items
Visual-analogue HRQOL items
Domain scores PHY PSY SOC ENV
PHY 0.40** 0.42** 0.34** 0.33**
PSY 0.47** 0.59** 0.47** 0.38**
SOC 0.35** 0.54** 0.67** 0.34**
ENV 0.43** 0.43** 0.39**
0.60**
Note: PHY: physical health domain; PSY: psychological domain; SOC: social
above. The entire test was not significant (df = 1, all p value > 0.05). This result suggested that the off-diagonal correlation of PHY domain was NOT different from the off-diagonal correlation of PHY domain and implied that PHY domain did not has discriminant validity from other domains.
Similarly, the PSY, SOC and ENV domains were examined by the same procedure. Regarding the PSY domains, expect for the corre-lation value of 0.54 (SOC domain score & PSY VAS score), all Chi-square difference tests for PSY domain were significant ( p < 0.01). Therefore, we may conclude that the PSY domain has discriminant validity from other domains, although its diagonal correlation is not higher than the correlation of SOC domain score and PSY VAS score. Further, all Chi-square difference tests for SOC and ENV domains were significant (p < 0.01). Therefore, it can be concluded that the SOC and ENV domain have discriminant validity from other domains. Generally, according to the results of correlation compar-isons, it can be concluded that the four QOL domains has acceptable discriminant and convergent validity, although scores of physical domains were not exhibit satisfied evidence of its discriminant va-lidity in the Multitrait-Multimethod matrix.
In addition, discriminant and convergent validity was also applied at the item level. The 23 items were correlated with the four domain scores to see if an item has higher correlation with its domain score than other domain scores. The correlation analyses are performed with each item removed from the domain score. The results revealed that most items had higher correlation with its domain score than with other domain scores (see Table VI). However, 8 items measuring ‘‘Energy and fatigue’’, ‘‘Mobility’’, ‘‘Work capacity’’, ‘‘Positive feel-ings’’, ‘‘Thinking, learning, memory and concentration’’, ‘‘Respected by others’’, ‘‘Freedom, physical safety and security’’, ‘‘Participation in and opportunities for recreation/leisure’’ did not have clear pattern on discriminant validity. These items have higher or the same cor-relations coefficients with other domain scores.
DISCUSSION
The purpose of this study was to examine the applicability of the WHOQOL-BREF Taiwan version in an early adolescent sample.
Based on the results of item analysis, confirmatory factor analysis, regression analysis and discriminant and convergent validity anal-ysis, the revised WHOQOL-BREF Taiwan version could be applied to early adolescent population. Although the discriminant and convergent validity of the four QOL domains were not so excellent in the current sample, however, according to the entire results of this study, it is appropriate to use this revised version to assessing early adolescent health-related quality of life. The revised version deleted two physical health items and one social relationships item that were in the original version. These two physical health items
TABLE VI
Corrected Item Correlations with Four Domain Scores
Facet PHY PSY SOC ENV
PHY
Energy and fatigue 0.47 0.51 0.34 0.41
Mobility 0.39 0.38 0.31 0.39
Sleep and rest 0.49 0.39 0.34 0.37
Activities of daily living 0.61 0.51 0.42 0.47
Work capacity 0.47 0.47 0.39 0.41
PSY
Positive feelings 0.34 0.41 0.39 0.45
Religion/Spirituality/Personal beliefs 0.47 0.61 0.45 0.46
Thinking, learning, memory and concentration 0.41 0.35 0.31 0.37
Bodily image and appearance 0.41 0.56 0.42 0.39
Self-esteem 0.54 0.64 0.60 0.47 Negative feelings 0.34 0.36 0.32 0.29 SOC Personal relationships 0.30 0.50 0.54 0.36 Social support 0.35 0.41 0.46 0.38 Respected by othersa 0.40 0.57 0.49 0.58 ENV
Freedom, physical safety and security 0.42 0.54 0.39 0.51
Physical environment 0.28 0.23 0.18 0.33
Financial resources 0.35 0.39 0.30 0.54
Opportunities for acquiring new information and skills 0.38 0.45 0.37 0.58
Participation in and opportunities for recreation/leisure 0.41 0.39 0.24 0.34
Home environment 0.34 0.38 0.41 0.58
Health and social care: accessibility and quality 0.29 0.39 0.39 0.56
Transport 0.31 0.37 0.37 0.56
Fooda 0.13 0.19 0.19 0.36
Note: Item-corrected correlations on hypothetical domain were displayed in bold.
a
were ‘‘To what extent do you feel that your pain hinders you in doing what you need to do?’’ and ‘‘Do you need medical treatment to cope with your daily life?’’. The social relationships item was ‘‘Are you satisfied with your sex life?’’ Due to that the content of these items was not suitable for early adolescent population or that the meaning of items could not be reflected by participants, it is not surprising that the psychometric properties of these three items were unsatisfied for assessing adolescent’s HRQOL. Thus, after deleting the three items, the revised WHOQOL-BREF Taiwan version with 25-item (23 domain items and 2 general items) was left to use in assessing adolescents’ HRQOL.
Although the revised WHOQOL-BREF Taiwan version remains slightly longer than some other forms of the HRQOL assessment (e.g., the SF-12; the 16D) (Apajasalo et al., 1996; Ware et al., 1996); however, it encompasses a larger number of domains that are essential for the assessment of quality of life. Particularly, the social relationships and environmental domains are not always taken into account in other assessments (WHOQOL Group, 1998a). Further-more, only a few existing generic quality of life measures contain the environmental factors as a domain of HRQOL. Many researchers suggested that environmental context plays an important factor in adolescent’s health (Erikson, 1953; Grotevant, 1987), such as Selig-man and Csikszentmihalyi (2000) who had indicated that positive environment could facilitate subjective well-being. In addition, the results showed that the environmental domain is considerably significant in predicting the overall HRQOL score (from WHOQOL-BREF) and the overall HRQOL VAS score. Therefore, the envi-ronmental domain should be taken into account in understanding adolescences’ HRQOL.
This study also extends the applicability of the WHOQOL-BREF Taiwan version. Previous studies using the WHOQOL-BREF mainly focused on adult cross-cultural comparisons (WHOQOL Group, 1998a; Skevington, 2002). However, no work has been done on cross-aged comparisons or the trace of the dynamic change on quality of life by aging. The contribution of this study extends the applicability of the WHOQOL-BREF to young people. Accordingly, the research populations ranging from early adolescents to adults (including older people) are available now for the measurement of the WHOQOL-BREF at the same time. In addition, future work might seek to
compare the health-related quality of life in different age groups. This work could help us catch the dynamic change of quality of life in the human developmental stages.
There are, however, some limitations in this study. First, the sample of this study may not include adolescents who suffer a serious illness that prevented them from going to school. Thus, the repre-sentatives of the study sample were somewhat limited. Second, the study did not investigate the relations between the WHOQOL-BREF Taiwan version and other related measures, particularly for adoles-cents’ health or quality of life (e.g., Quality of Life Profile-Adolescent version; Adolescent Illness Impact Measure) (Raphael et al., 1996; Spieth and Harris, 1996). Nevertheless, the WHOQOL-BREF Tai-wan version is already a well-developed measurement, and has good reliability and validity in the past studies (Fang et al., 2002; Lin et al., 2002; Yao et al., 2002). Therefore, the limitation would not influence the applicability of the WHOQOL-BREF Taiwan version in early adolescent group.
In summary, this study has some implications for HRQOL. First, we examine the applicability of the WHOQOL-BREF Taiwan ver-sion on assessing early adolescents’ HRQOL. Second, the study also suggests that psychological and environmental domains may play an important role in adolescents’ HRQOL. Hence enhancing psycho-logical health and creating positive environment would benefit ado-lescents’ HRQOL. Third, it is important that we learn more about dynamic change of HRQOL in different age groups, and the work of cross-age comparison will help us to build such understanding. For these purposes, the empirical evidence of life-span HRQOL then can be provided to the health service system in order to establish a more integrated health caring policy.
REFERENCE
Adams, G.R., L.D. Bennion, D.K. Openshaw, C.R. Bingham: 1990, ‘Windows of vulnerability: Identifying critical age, gender, and racial differences predictive of risk for violent deaths in childhood and adolescence’, Journal of Primary Pre-vention 10, pp. 223–240.
Adams, G.R., T.P. Gullotta, C. Markstrom-Adams: 1994, ‘Adolescent Life
Apajasalo, M., C. Sintonen, C. Holmberg, J. Sinkkonen, et al., : 1996, ‘Quality of life in early adolescence: A sixteen-dimensional health-related measure (16D)’, Quality of Life Research 5, pp. 205–211.
Cheung, M.W.L., W. Chan: 2004, ‘Testing dependent correlation coefficients via structural equation modeling’, Organizational Research Methods 7, pp. 206–223. Eiser, C.: 1995, ‘Growing Up with a Chronic Disease’ (Jessica Kingsley Publishers,
London).
Eiser, C., R. Morse: 2001, ‘Can parents rate their child’s health-related quality of life? Results of a systematic review’, Quality of Life Research 10, pp. 347–357. Erikson, E.H.: 1953, ‘Childhood and Society’ (W. W. Norton and Company, New
York).
Fang, C.T., P.C. Hsiung, C.F. Yu, M.Y. Chen, J.D. Wang: 2002, ‘Validation of the World Health Organization quality of life instrument in patients with HIV infection’, Quality of Life Research 11, pp. 753–762.
Grotevant, H.D.: 1987, ‘Identity process: Integrating social psychological and developmental approach’, Journal of Adolescent Research 12, pp. 354–357. Irwin, C.E.: 1987, ‘Adolescent social behavior and health’, in W. Damon (ed.), New
Directions for Child Development 37(Jossy-Bass, San Francisco), pp. 1–12. Jirojanakul, P., S.M. Skevington, J. Hudson: 2003, ‘Predicting young children’s
quality of life’, Social Science & Medicine 57, pp. 1277–1288.
Joreskog, K.G. and D. Sorbom: 1993, ‘LISREL 8: Structural Equation Modeling with the SIMPLIS Command Language. Chicago, IL, US; Hillsdale, NJ, England: Scientific Software International’, Inc.; Lawrence Erlbaum Associates, Inc. Lin, M.R., W. Huang, C. Huang, H.F. Hwang, L.W. Tsai, Y.N. Chiu: 2002, ‘The
impact of the Chi-Chi earthquake on quality of life among elderly survivors in Taiwan: A before and after study’, Quality of Life Research 11, pp. 379–388. Mulhern, R.K., M.E. Horowitz, J. Ochs, A.G. Friedman, F.D. Armstrong, D.
Copeland, L.E. Kun: 1989, ‘Assessment of quality of life among pediatric patients with cancer’, Psychological Assessment 1, pp. 130–138.
Raphael, D., E. Rukholm, I. Brown, P. Hill-Bailey, E. Donato: 1996, ‘The quality of life profile-adolescent version: Background, description, and initial validation’, Journal of Adolescent Health 19, pp. 366–375.
Seligman, M.E.P., M. Csikszentmihalyi: 2000, ‘Positive psychology: An introduc-tion’, American Psychologist 55, pp. 5–14.
Skevington, S.M.: 2002, ‘Advancing cross-cultural research on quality of life: Observations drawn from the WHOQOL development’, Quality of Life Research 11, pp. 135–144.
Skevington, S.M., M. Lotfy, K.A. O’Connell: 2004, ‘The World Health Organiza-tion’s WHOQOL-BREF quality of life assessment: Psychometric properties and results of the international field trial’, Quality of Life Research 13, pp. 299–310.
Spieth, L.E., C.V. Harris: 1996, ‘Assessment of health-related quality of life in
children and adolescents: An integrative review’, Journal of Pediatric Psychology 21, pp. 175–193.
Ware, J.E., M. Kosinski, S.D. Keller: 1996, ‘A 12-item short-form health survey’, Medical Care 34, pp. 220–228.
World Health Organization: 1993, ‘WHOHR-QOL study protocol’. Geneva: WHO (MNH/PSF/93.9).
World Health Organization: 1995, ‘Resources for new WHOHR-QOL centers’. Geneva: WHO (MNH/PSF/95.3).
WHOQOL Group: 1998a, ‘Development of the World Health Organization WHOQOL-BREF quality of life assessment’, Psychological Medicine 28, pp. 551– 558.
WHOQOL Group: 1998b, ‘The World Health Organization Quality of Life assess-ment (WHOQOL): Developassess-ment and general psychometric properties’, Social Science and Medicine 46, pp. 1569–1585.
WHOQOL-Taiwan Group: 2001, ‘Development and manual of the World Health Organization WHOQOL-Taiwan quality of life assessment’.
Yao, G., C.H. Chung, C.F. Yu, J.D. Wang: 2002, ‘Development and verification of validity and reliability of the WHOQOL-BREF Taiwan version’, Journal of the Formosan Medical Association 101, pp. 342–351.
Grace Yao Department of Psychology
National Taiwan University #1 Roosevelt Road, Section 4 Taipei 10617
Taiwan