Contents lists available atScienceDirect
Journal of Chromatography A
j o u r n a l h o m e p a g e :w w w . e l s e v i e r . c o m / l o c a t e / c h r o m aIssues pertaining to the analysis of buprenorphine and its metabolites by gas
chromatography–mass spectrometry
Yu-Shan Wang
a, Dong-Liang Lin
b,∗, Shu-Ching Yang
a, Meng-Yan Wu
a, Ray H. Liu
a,∗∗,
Lien-Wen Su
c, Pai-Sheng Cheng
d, Chiareiy Liu
d, Ming-Ren Fuh
eaDepartment of Medical Technology, Fooyin University, 151 Ching-Hsueh Road, Ta-Liao Hsiang, Kaohsiung Hsien 831, Taiwan bInstitute of Forensic Medicine, Ministry of Justice, No. 16, Lane 175, Tong-Hwa Street, Taipei 106, Taiwan
cPsychiatric Medicine, Clinical Service and Hospitalization for Drug/Alcohol Addicts, Taipei City Hospital Songde Branch, 309 Songde Road, Taipei 110, Taiwan dNational Bureau of Controlled Drugs, Department of Health, 6 Lin-Shin S. Road, Taipei 100, Taiwan
eDepartment of Chemistry, Soochow University, 70 LinShih Road, Shih-Lin, Taipei 111, Taiwan
a r t i c l e i n f o
Article history: Received 5 May 2009
Received in revised form 4 December 2009 Accepted 8 January 2010
Available online 18 January 2010 Keywords:
Buprenorphine Norbuprenorphine Glucuronide Immunoassay
Gas chromatography–mass spectrometry Liquid chromatography–tandem mass spectrometry
a b s t r a c t
“Substitution therapy” and the use of buprenorphine (B) as an agent for treating heroin addiction con-tinue to gain acceptance and have recently been implemented in Taiwan. Mature and widely utilized gas chromatography–mass spectrometry (GC–MS) technology can complement the low cost and highly sensitive immunoassay (IA) approach to facilitate the implementation of analytical tasks supporting com-pliance monitoring and pharmacokinetic/pharmacogenetic studies. Issues critical to GC–MS analysis of B and norbuprenorphine (NB) (free and as glucuronides), including extraction, hydrolysis, derivatiza-tion, and quantitation approaches were studied, followed by comparing the resulting data against those derived from IA and two types of liquid chromatography–tandem mass spectrometry (LC–MS/MS) meth-ods. Commercial solid-phase extraction devices, highly effective for recovering all metabolites, may not be suitable for the analysis of free B and NB; acetyl-derivatization products exhibit the most favorable chromatographic, ion intensity, and cross-contribution characteristics for GC–MS analysis. Evaluation of IA, GC–MS, and LC–MS/MS data obtained in three laboratories has proven the 2-aliquot GC–MS protocol effective for the determination of free B and NB and their glucuronides.
© 2010 Elsevier B.V. All rights reserved. 1. Introduction
Exhibiting both partial agonist activity at the !-opiate recep-tor and antagonist activity at the "-opiate receprecep-tor, buprenor-phine (B) (2S)2[(−)(5R,6R,7R,14S)9#cyclopropylmethyl4,5epoxy6,14ethano 3hydroxy6methoxymorphinan7 yl ]3, 3 -dimethylbutan-2-ol/CAS 52485-79-7, has long been prescribed for pain relief and anesthetic induction[1]. In 1966, B (under the trade name of Subutex® for sublingual use) was adopted in France as
a substitution agent for managing opiate-dependent individuals. In the US, Subutex® and Suboxone® (B/naloxone1 combination
product) were certified in 2002 for use in opioid detoxification
∗ Corresponding author. Tel.: +886 2 2738 6649; fax: +886 2 2736 0875. ∗∗ Corresponding author. Tel.: +886 9 3636 3732; fax: +886 7 782 7162.
E-mail addresses:mt124@mail.fy.edu.tw,mt124@fy.edu.tw,rayliu@uab.edu
(R.H. Liu).
1Naloxone is included in the Suboxone®formulation to prevent diversion of B
for illicit intravenous use. With antagonist activity at the !-opiate receptor but poor sublingual bioavailability, naloxone has little effect on the agonist activity of B when taken by the prescribed route. However, if the sublingual B/naloxone tablets are crushed and injected, the effect of naloxone predominates can result in the opioid
withdrawal syndrome[3].
and opioid substitution treatments[2]. Substitution therapy and the use of B as an agent for “treating” heroin addiction continue to gain acceptance and have been implemented in Taiwan in 2006. Yet significant numbers of B-related fatalities have been reported in France[4,5]and elsewhere[6].
Analysis of B and its metabolites in various biological matrices is an important component of pharmacokinetic/pharmacogenetic studies, compliance monitoring, and the implementation of deter-rence testing strategy associated with the B-treatment policy. Since B is rapidly metabolized[7]to form pharmacologically active metabolite, norbuprenorphine (NB) (5#,6$,14$,18R)18[(1S)1hydroxy1, 2, 2trimethylpropyl]6methoxy18,19dihydro 4, 5 -epoxy-6,14-ethenomorphinan-3-ol/CAS 78715-23-8, while both B and NB readily form glucuronide conjugates, buprenorphine glucuronide (BG) and norbuprenorphine glucuronide (NBG), ana-lytical studies should address all issues critical to the analysis of these four compounds.
With advances in instrumentation, there have been a substantial number of studies applying the latest liquid chromatography–tandem mass spectrometry (LC–MS/MS) tech-nologies to the analysis of B and NB [8–20] and BG and NBG [15–30]. While these approaches hold certain merits (including simultaneous determinations of B, NB, BG, and NBG without 0021-9673/$ – see front matter © 2010 Elsevier B.V. All rights reserved.
Y.-S. Wang et al. / J. Chromatogr. A 1217 (2010) 1688–1694 1689 prior derivatization and, reportedly, low limits of detection
and quantitation), there are still considerable concerns, such as instrumentation cost, robustness, level of required operational skill, and perhaps precision and accuracy in quantitation. Many professionals are still skeptical in applying these technologies to regulatory and/or high-volume testing environment, such as workplace drug testing programs.
Interestingly, studies addressing issues critical to the anal-ysis of B and its metabolites by the mature and now widely available gas chromatography–mass spectrometry (GC–MS) instru-mentation are relatively rare[22–26]. Thus, we have conducted a thorough study on various derivatization approaches and con-cluded acetyl-derivatization to be the best option for the analysis of B and NB by GC–MS[27]. We have also completed an immunoas-say (IA) study on parameters critical to its serving as the preliminary test methodology[28]in the 2-step test strategy, designed for a high-volume test environment. This current report further exam-ines other issues critical to the utilization of the GC–MS technology to monitoring metabolites derived from B-treatment. Issues stud-ied included: (a) effects of sample extraction approaches on the analysis of free B and NB; (b) deriving the concentrations of B, NB, BG, and NBG through a 2-step analytical protocol—without and with the hydrolysis step; and (c) correlating the GC–MS analyte concentrations to findings derived from preliminary test (IA) and LC–MS/MS methodologies.
Thorough understanding of these analytical methods (pre-liminary and confirmatory tests) and sample preparation and quantitation approaches (extraction, hydrolysis, derivatization, and deriving the concentrations of B, NB, BG, and NBG from a 2-step test protocol) are essential to the development of a robust analytical protocol that can (a) be widely applied to pharmacokinetic/pharmacodynamic studies; and (b) meet the requirements of testing programs adapting similar rules man-dated by the US Federal Guidelines for monitoring the exposure of the following drugs in the workplace: marijuana, cocaine, heroin, amphetamine/methamphetamine, and phencyclidine[29]. 2. Experimental
2.1. Chemical and reagents
Reference materials to be used for preparing the standard solu-tions of the analytes and the ISs, including B, NB, BG, NBG, B-d4, and
NB-d3(in 0.1 mg/ml methanol solution), were purchased from
Cer-illiant Corporation (Austin, TX, US). Pre-formulated liquid–liquid extraction kit (Toxi-Tubes A) and solid-phase extraction cartridge (Bond Elut C18SPE, 200 mg, 40 Å) were obtained from Varian
(Wal-nut Creek, CA, US). $-Glucuronidases (Helix pomatia) were obtained from Sigma Aldrich Fine Chemicals (Saint Louis, MO, US). The derivatization reagent, acetic anhydride (AA), was purchased from Finechem (Wellington, Auckland, New Zealand). Other solvents and reagents are analytical or HPLC grade and were obtained from the following sources: ethyl acetate: Ferak (Berlin, Germany); acetic acid, potassium phosphate dibasic (K2HPO4), and phosphoric acid
(H3PO4): Sigma Aldrich Fine Chemicals (Saint Louis, MO, US).
2.2. Extraction and derivatization procedure
Extraction methods studied included: (a) liquid–liquid extrac-tion with a solvent system prepared in-house and with commer-cially pre-formulated Toxi-Tubes A (containing sodium carbonate and bicarbonate, pH 9.0, in a mixture of dichloromethane, dichloroethane, n-heptane and ethyl acetate); and (b) solid-phase extraction with Bond Elut C18. For the former liquid–liquid
extrac-tion approach, 1-ml urine was added to the IS and 1 ml 0.1-M ammonium carbonate buffer (pH 10). The mixture was then
extracted twice with 3-ml dichloromethane/isopropanol (9:1) mix-ture by mixing for 20 min, followed by centrifugation at 2500 rpm for 15 min. The extracts were combined and dried before proceed-ing to the derivatization step. The manufacturer’s instructions were followed for the Toxi-Tubes A liquid–liquid extraction method. Specifically, 1-ml urine sample was added to a Toxi-Tubes A tube and the content was brought up to 5 ml with double-distilled water. After a 10-min mechanical shaking, the mixture was centrifuged at 2500 rpm for 10 min. The organic layer was transferred into a clean 16 mm × 100 mm glass tube and dried under a slow stream of nitrogen at 50◦C. For the Bond Elut C18solid-phase extraction
approach, 3-ml ammonium carbonate buffer was added to the sample (1 ml) and the mixture was gently vortexed, then passed through (1–2 ml/min) the SPE cartridge that had been conditioned with 3 ml methanol and 3 ml ammonium carbonate buffer. The loaded SPE cartridge was then washed with 3 ml water and dried for 5 min under low vacuum (35 kPa), followed by eluting the analytes with three consecutive 1-ml aliquots of methanol. The combined eluent was evaporated to dryness with nitrogen at 50◦C.
For acetyl-derivatization, the dried residue was re-dissolved in 100 !l AA, vortex mixed, capped, and incubated at 80◦C for
20 min. The reaction mixture was evaporated to dryness at 65◦C
in a heating block under a slow stream of nitrogen. The residue was re-dissolved in ethyl acetate (typically 100 !l) and 1 !l was typically used for GC–MS analysis.
For the collection of standard spectra and the evaluation of ion intensity cross-contribution (CC) data, 10 !l standard solutions of the analyte and IS were placed in individual 16 mm × 100 mm glass tubes and evaporated to dryness under a stream of nitrogen at 50◦C. The same derivatization procedure described above was then
followed.
2.3. Hydrolysis procedure
One-ml urine specimen (or BG and NBG standards) was put into a 15-ml centrifuge tube, followed by the addition of 1 ml 1.0-M acetate buffer and 1000 Fishman units of $-glucuronidase (100 !l 10,000-Fishman units/ml). The samples were capped and incubated at 60◦C for 4 h, which has been proven effective in the exploratory
stage of this study[30]. 2.4. GC–MS analysis
2.4.1. Instrumentation and operational parameters
An Agilent 6890N gas chromatograph/5975[5973N] mass selective detector system operating at 70 eV with ion source temperature set at 230◦C was used for this study. The gas
chro-matograph was equipped with a 12[30]-m HP-5 (Wilmington, DE, US) capillary column crosslinked 5% phenyl methyl siloxane with 200[250]-!m I.D. and 0.33[0.25]-!m film thicknesses. The injector temperature and GC–MS interface temperature were maintained at 280◦C. The sample was introduced into the gas chromatograph
in splitless mode and the helium carrier gas flow rate was set at 1.2 ml/min. The initial oven temperature was held at 200◦C for
1[0.5] min, then raised to 300◦C at 30[40]◦C/min, and held for
5[15] min. Data/information shown inside brackets ([]) were used in the GC–MS analysis conducted in another laboratory for com-parative studies (see Section3.2.1for details).
2.4.2. Collection and evaluation of mass spectra and ion-pair intensity cross-contribution data
Typically, full-scan mass spectra of the analytes of interest were obtained by injecting individual derivatization products into the GC–MS system. Full-scan mass spectra were collected starting at m/z 50 and ended at a mass higher than the molecular weights of the derivatized products, rounded to the next 50, i.e., 350, 400,
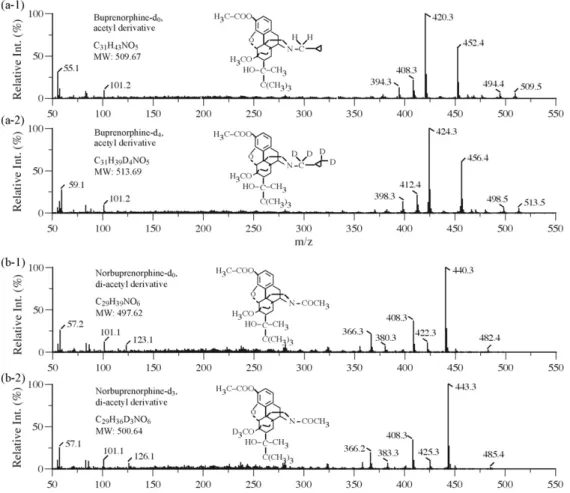
Fig. 1. Mass spectra of acetyl derivative of buprenorphine (a-1) and buprenorphine-d4(a-2); and di-acetyl derivative of norbuprenorphine (b-1) and norbuprenorphine-d4
(b-2).
450, etc. A separate run was repeated for each isotopic analog of each analyte. Retention time and mass spectrometric data derived from these runs were used to characterize the analytes and their isotopic analogs. Full-scan mass spectrometric data were stored as digital files that were then converted into mass spectra of a more desirable format for systematic presentation. This conversion was carried out using the DelraGraph software (DeltaPoint: Seattle, WA, US) run on an Apple iMac G5 computer (Cupertino, CA, US). Shown inFig. 1are full-scan mass spectra and structural information of acetyl-derivatized B and NB along with their deuterated analogs, B-d4and NB-d3.
Full-scan mass spectrometric data were reviewed to select ions that may potentially be used to identify the analytes and their ISs in quantitative GC–MS protocols. The derivatization products were again injected into the GC–MS system under selected ion mon-itoring (SIM) mode, using ions selected from the full-scan mass spectrometric data. General criteria adapted for SIM ion selection were: (a) the ion’s relative intensity in the full-scan mass spectrum was ≥10%; and (b) the full-scan intensity data indicated <10% CC. Ions with lower intensity would have been included if there were less than three pairs of ions that met the above criteria. The result-ing SIM data were then used to derive more accurate CC data for the pairs of ions that may potentially be used to designate the ana-lyte/IS pair. Details of the methodology have been described in our earlier publications[31,32].
2.5. LC–MS/MS (triple quadrupole configuration) analysis
The LC–MS/MS system consists of an Agilent 6410 triple quadrupole mass spectrometer (Santa Clara, CA, US) fitted with
an electrospray interface and an Agilent 1200 rapid resolution LC system (Santa Clara, CA, US). Chromatographic separation was achieved using an Agilent Zorbax SB-Aq (100 mm × 2.1 mm I.D., 1.8-!m particle) analytical column operated at 50◦C. The mobile phase
consisted of 0.1% formic acid (v/v) in water (A) and methanol (B), operated at a flow rate of 0.32 ml/min. The initial gradient compo-sition (90% A/10% B) was held for 1.5 min, then decreased to 0% A in 8.5 min and held for 2 min. For re-equilibration, the initial gra-dient composition was restored by increasing solvent A to 90% in 1 min, held for 2 min, and allowed to equilibrate for 5 min. A 5-!l aliquot of the samples was injected. The electrospray source was operated at 350◦C with an ionization voltage of 4000 V. Gas source
(nitrogen) was via an Agilent oxygen analyzer. The nebulizer gas pressure and the drying gas flow rate were set at 40 psi and 10 l/min, respectively. Mass spectrometric analysis was performed in positive-ion mode with 200 ms dwell time, applying multiple reac-tion monitoring (MRM) using appropriate collision energy for each precursor ion. Transitions and other mass spectrometric parame-ters adopted for the analysis of B, BG, NB, and NBG are summarized inTable 1.
3. Results and discussion
The premise of this study is the establishment of a robust GC–MS methodology for the quantitations of free and conjugated forms of B and NB. Thus, issues studied are mainly on the development and validation of various analytical steps and the application of the established methodology to the analysis of test specimens. The contents of these studies are discussed in the following sec-tions.
Y.-S. Wang et al. / J. Chromatogr. A 1217 (2010) 1688–1694 1691 Table 1
Transitions and MS–MS parameters for LC–MSMS (triple quadrupole) analysis of buprenorphine (B), buprenorphine glucuronide (BG), norbuprenorphine (NB) and norbuprenorphine glucuronide (NBG).
Compound Precursor ion Product ion Frag. votage (V) Collision energy (V)
B 468.4 414.4 240 35 BG 644.5 468.4 240 40 B-d4 472.5 400.4 240 45 NB 414.4 340.4 240 35 NBG 590.5 414.4 240 40 NB-d3 417.4 399.3 240 40
3.1. Method development and validation
Method development and validation studies included (a) effec-tive calibrations for the quantitation of B and NB, with and without the incorporation of the hydrolysis step; (b) evaluation of hydrol-ysis completeness and extraction recoveries; and (c) determining the analyte concentrations (B, NB, BG, and NBG) in test specimens using a 2-aliquot approach.
3.1.1. Quantitation approach and the effect of the hydrolysis step on the quantitation of B and NB
Internal standard method utilizing the isotopically labeled analog of the analyte as the IS is now considered the most effec-tive approach for quantitaeffec-tive determination of drugs (and their metabolites) in biological specimens[33]. With this approach, one of the most important concerns is the intensity CC between the ions designating the analyte and the IS, that may affect the quality of the quantitation data[34]. Since2H-labeled (but not13C-labeled)
analogs of B and NB are both available, these deuterated analogs were adopted as the ISs, respectively, for the quantitation of these two analytes.
Our earlier work[27]concluded that, among the alkylation, acy-lation, and silylation approaches studied, acetylation of B and NB achieved the best over-all results when all of the following factors
are considered together: derivatization yields, ionization efficiency, chromatographic characteristics, and CC between ions designating the analyte and the IS. Based on the full-scan mass spectra data of the acetyl-derivatized analytes and ISs shown inFig. 1, the intensi-ties of ion-pairs with potential for designating these two analytes and their ISs were monitored under SIM mode. Resulting CC data for the ion-pairs designating the B/B-d4 and NB/NB-d3 systems,
along with these ions’ relative intensities in their respective full-scan mass spectra, were determined based on a method reported earlier[35] and summarized inTable 2. These data indicate the three ion-pairs that are most suited for designating the B/B-d4and
NB/NB-d3systems are m/z 420/424, 452/456, 408/412 and 440/443,
422/425, 441/444, respectively.
Having selected the most suitable ion-pairs to designate B and NB and their respective ISs, two sets of standard solutions were analyzed with and without the incorporation of the hydrolysis step, each in duplicates. The resulting analytical parameters are shown in Table 3, indicating the effect of the hydrolysis step on the achievable LOD and LOQ. Our earlier study[27]has indicated that more favor-able limits of detection (LOD) and quantitation (LOQ), especially for NB, can be achieved using B-d4as the IS for NB and narrower
cali-bration ranges to avoid biased toward the higher concentration end in establishing the calibration line by linear regression. However, since the hydrolysis step is needed only for the analysis of total B and NB, which are normally present at high concentration levels, no further refinements were pursued.
The quantitation approach hereby developed has been applied to the analysis of 3 standard solutions (containing 30, 300, 500 ng/ml of B; 30, 300, 600 ng/ml of NB) in 3 days. The means and CV derived from these analyses were found satisfactory: 35.4, 1.85%; 279, 4.79%; 511, 1.62% for B and 32.7, 6.79%; 285, 12.8%; 584, 1.96% for NB.
When the GC–MS method described above and the triple quadrupole LC–MS/MS method were used in another laboratory (see details in Section3.2.1) for comparative studies, narrower cal-Table 2
Relative intensity and cross-contribution data of ions with potential for designating the analyte and the adapted internal standard.
Derivatization group Analyte Internal standard
Ion (m/z) Rel. int. Analog’s cont. Ion (m/z) Rel. int. Analog’s cont. Buprenorphine/buprenorphine-d4 Acetyl 452 51.6 0.76 456 61.1 0.13 420 100 0.77 424 100 0.50 408 18.8 1.38 412 21.7 0.85 394 15.3 2.04 398 17.1 1.01 Norbuprenorphine/norbuprenorphine-d3 [Acetyl]2 422 10.6 2.66 425 9.53 1.84 440 100 1.20 443 100 0.68 441 24.7 1.79 444 30.2 0.23
Relative intensities are based on full-scan data, while analog’s contributions (cross-contribution) are derived from selected ion monitoring data.
Table 3
Analytical parameters derived from linear calibration of buprenorphine (B) and norbuprenorphine (NB) (all concentrations are in ng/ml).
Hydrolysis Buprenorphine Norbuprenorphine
Conc. r2 LOD LOQ Conc. r2 LOD LOQ
Yes 0–1000 0.9984 20 30 0–1500 0.9993 20 50
0.9997 20 30 0.9995 20 20
No 0–500 0.9990 4 10 0–1000 0.9998 2 20
0.9987 4 10 0.9972 2 20
Protocols with and without the hydrolysis step were intended for the analysis of total and free B and NB, respectively. LOD is defined as the lowest concentration at which the two independent ion intensity ratios of the three ions monitored are within ±20% of that observed in the calibration standard with the same concentration as the IS. LOQ is defined as the lowest concentration that meets the LOD requirement and the observed concentration is also within ±20% of the expected value[33]. The exact concentrations of B and NB in these standards in the protocols with and without the hydrolysis step are: “0, 20, 30, 80, 150, 300, 600, 1000 ng/ml” and “0, 20, 50, 100, 200, 400, 800, 1500 ng/ml”; and “0, 4, 10, 30, 80, 150, 300, 500 ng/ml” and “0, 2, 20, 60, 150, 300, 600, 1000 ng/ml”, respectively. The highest concentration of the analyte in each calibration study was found within the achievable upper limit of linearity.
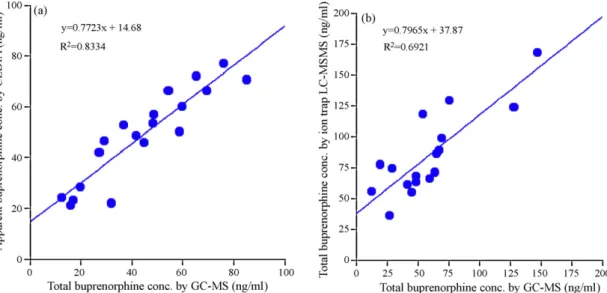
Fig. 2. Correlation of total buprenorphine concentration determined by GC–MS against (a) apparent buprenorphine concentration resulting from CEDIA buprenorphine
assay; and (b) total buprenorphine concentration as determined by ion trap LC–MS/MS. The first GC–MS data shown inTable 5for specimens 10–13, 40, and 53 were used
for plotting (a), while the second data were used in (b). Data for specimens 10 and 20 were excluded in (b). ibration ranges were adopted: 0.5, 1.5, 2.5, 5, 10, 25, 50, 80 ng/ml
for B, NB, BG, and NBG. The GC–MS method achieved more favor-able LOD and LOQ than the calibration described inTable 3: both 1.5 for B and 2.5 ng/ml for NB. Both of the LOD and LOQ achieved by the triple quadrupole LC–MS/MS method were 1.5, 0.5, 0.5, and 0.5 ng/ml for B, BG, NB, and NBG, respectively. All correlation coef-ficients observed from these calibrations were better than 0.999. 3.1.2. Extraction and hydrolysis methods for the determination of free and total buprenorphine and norbuprenorphine
Since B and NB present in biological specimens are in free and conjugateforms, the analyst should first decide whether the analyt-ical task is for the determination of the analytes (a) in free forms; (b) in both free and conjugate forms; or (c) the total concentrations. The predetermined objective will then guide the selection of extraction and hydrolysis methods with the most desirable characteristics.
With deuterated B and NB now readily available to serve as the ISs, the concentrations of free B and NB in a sample can be accu-rately determined even if the adopted extraction method does not achieve 100% recoveries of the analytes. It is very important, how-ever, that the method does not co-extract the conjugates (BG and NBG), especially if a following sample preparation step may result in the hydrolysis of the co-extracted conjugates. Secondly, if the analytical objectives include finding the exact concentrations of BG and NBG in the specimen, an extraction method that can achieve the highest recoveries of these two analytes would be very desir-able, especially if they are to be directly analyzed—as in LC–MS/MS protocols. Thirdly, when finding the total concentrations of B and NB in the specimen is the objective of the analysis, the ability of the adopted hydrolysis method to achieve 100% conversion becomes the most important consideration.
With these concerns in mind, we have designed several series of experiments assessing methods that would be most suitable for the analysis of B and NB in their free forms and the total concen-trations in a specimen. Shown inTable 4are the recovery data (in percentage) of B/NB achieved by three extraction approaches. Two sets of standards containing B/NB and BG/NBG, respectively, were used in this series of study. These data indicate: (a) the liquid–liquid extraction procedure using the solvent system prepared in-house achieved the lowest recoveries of B/NB with no detectable BG/NBG; (b) the Bond Elut C18solid-phase approach was very effective in
extracting both B/NB and BG/NBG; (c) the derivatization procedure following the extraction step must have converted very
signifi-cant proportions of the extracted BG/NBG into B/NB that were then derivatized and determined as B/NB at the GC–MS analysis step; and (d) the Toxi-Tubes A liquid–liquid extraction procedure extracted B/NB effectively, but also co-extracted small amounts of BG/NBG which were finally determined as B/NB.
Under compliance monitoring and workplace testing environ-ment, total concentrations of B and NB serve as the most convenient analytical parameters. To accurately determine the total concentra-tions of B and NB, the adopted hydrolysis step must convert BG and NBG to B and NB completely. An enzymatic hydrolysis approach was reportedly capable of achieving this requirement for both BG and NBG[23,26]and had been verified in our laboratory[30]. We have therefore incorporated this hydrolysis method into our ana-lytical protocol where the hydrolysis step was needed.
3.1.3. Analysis of free and total buprenorphine/norbuprenorphine and buprenorphine glucuronide/norbuprenorphine glucuronide in urine specimen
In addition to free and total B/NB, the concentrations of BG/NBG are often of interest in pharmacokinetic/pharmacogenetic studies. An analytical scheme capable of providing the following three sets of analyte concentrations was established: free B/NB, total B/NB, and BG/NBG. A specimen would be analyzed once if only the total orthe free B/NB concentrations are needed. Specifically, the ana-lytical protocol would and would not include the hydrolysis step. On the other hand, if the concentrations of BG and/or NBG are also of interest, a specimen would have to be analyzed twice, i.e., once without and once with the hydrolysis step. Shown below are the analytical steps and calculation for deriving the concentrations of BG/NBG through a 2-aliquot analytical protocol.
Table 4
Comparison of three extraction methods for their recoveries (%) of buprenorphine (B) and norbuprenorphine (NB) from urine samples containing B/NB and buprenor-phine glucuronide (BG)/norbuprenorbuprenor-phine glucuronide (NBG).
Extraction method B/NB in sample BG/NBG in sample
B NB BG NBG
Bond Elut C18 97.9 95.2 46.2 51.3
Toxi-Tubes A 83.2 99.2 5.47 1.87
Liquid–liquid extraction 68.3 77.7 0.0 0.0 The hydrolysis step was not included in this series of experiments. The high recov-eries of B and NB by the Bond Elut C18method is explained in the text.
Y.-S. Wang et al. / J. Chromatogr. A 1217 (2010) 1688–1694 1693 The concentrations of free and total B/NB and BG/NBG in a
urine sample were determined with the analysis (without and with hydrolysis) of two aliquots and the applications of two correction factors. The first aliquot was processed with the following steps: extraction (Toxi-Tubes A), derivatization, and GC–MS. The resulting concentrations of B and NB were considered “apparent” concentra-tions of free B and NB, designated as [FB&] and [FNB&], respectively. The second aliquot was analyzed with hydrolysis that included the following steps: hydrolysis ($-glucuronidases), extraction (Toxi-Tubes A), derivatization, GC–MS. The resulting concentrations of B and NB were considered total concentrations of B and NB, designed as [TB] and [TNB], respectively.
Using B and BG as the example, their concentrations in the spec-imen are calculated as follows.
[FB] = [FB&] − 0.0547[B&] (1)
[B&] = [TB] − [FB] (2)
where [FB] = the concentration of free B; [FB&] = apparent concen-tration of FB, or the observed concenconcen-tration of free B resulting from the analysis of the first aliquot (without hydrolysis); [B&] = the con-centration of B derived from the BG present in the urine sample (seeTable 4); 0.0547 (or 5.47%) = the percentage of BG (in term of B) in the sample that would be extracted and detected as B using the Toxi-Tubes A extraction protocol; and [TB] = the concentration of B as determined by the analysis of the second aliquot (with hydrolysis).
Eqs.(1) and (2)can be combined:
[FB]=[FB&]−0.0547([TB]−[FB])=[FB&]−0.0547[TB]+0.0547[FB] or
(3)
[FB] = [FB&] − 0.0547[TB]0.945 (4)
Similarly, the concentration of free NB ([FNB]) can be derived using the following equation:
[FNB] =[FNB&] − 0.0187[TNB]0.981 (5)
where the definitions of [FNB], [FNB&], 0.0187, and [TNB] are
equiv-alent to [FB], [FB&], 0.0547, and [TB], as defined above for their B
analogs.
Thus, Eqs.(4) and (5)are used to derive the concentrations of free B and NB ([FB] and [FNB]). The concentrations of BG and NBG ([BG] and [NBG]) can then be calculated using the following two equations:
[BG] =[TB] − [FB]0.726 (6)
[NBG] =[TNB] − [FNB]0.701 (7)
where 0.726 and 0.701 are the ratios of the molecular weights of B/BG and BG/NBG, respectively.
3.2. Applications and comparative studies
The over-all analytical scheme established above was applied to the analysis of approximately 50 urine specimens collected from patients (following the hospital’s IRB protocols) under B-treatment. These same urine specimens have also been analyzed by CEDIA IA as described in our earlier study[28], while 19 of them have also been analyzed at another institution using the ion trap LC–MS/MS methodology[19]. Analytical data for these 19 specimens result-ing from these three methods obtained in two laboratories are shown inTable 5. The total B concentrations of these specimens as determined by GC–MS are plotted against the corresponding data
Table 5
Comparison of total buprenorphine concentrations (ng/ml) as determined by CEDIA immunoassay, GC–MS, and ion trap LC–MSMS.
Specimen CEDIA GC–MS LC–MSMS 1 77.0 75.9 129 3 66.3 69.3 98.7 5 48.6 41.5 61.3 6 58.7 50.2, 502a 537a 15 52.9 36.8, 147 168 18 21.2 15.9, 63.8 71.3 26 22.1 32.0, 128 124 30 45.8 44.8 55.1 33 60.0 59.8 66.2 35 57.1 48.5 63.4 36 24.2 12.6 55.9 38 53.5 48.3 68.3 39 72.1 65.1 86.3 40 85.0 70.7, 707a 783a 44 42.0 27.2 36.2 45 28.4 19.6 77.5 50 46.7 29.0 74.1 51 66.4 54.3 118 53 23.3 16.9, 67.5 88.7
CEDIA reagent exhibits approximately the same degree of responses to B and BG and
much lower responses[28]to other metabolites (NB and NBG). Buprenorphine was
used as the calibrator in the analytical protocol, while the responses generated by these specimens were converted to the equivalent concentrations of B. For GC–MS analysis, specimens were hydrolyzed for quantitative determination of total B with-out dilution. Two GC–MS concentrations are shown in the table for some specimens. The second figures were the results of GC–MS analysis, while the first figures were obtained by dividing the GC–MS concentrations by the respective dilution factors used to prepare these specimens for CEDIA analysis. For example, specimen #15 was diluted by a factor of 4 prior to the CEDIA analysis to obtain an apparent B concentration of 52.9 ng/ml.
aBuprenorphine concentrations in these 2 specimens were significantly higher.
They were excluded from the GC–MS vs. ion trap LC–MS/MS plot (Fig. 2b) to avoid
bias of the regression analysis.
generated by the CEDIA and ion trap LC–MS/MS methodologies as shown inFig. 2a and b, respectively.
3.2.1. Comparison of analytical data obtained in different laboratories using different methods
For the most part, three sets of data (CEDIA, GC–MS, ion trap LC–MS/MS) shown inTable 5are compatible. The concentrations reported by the GC–MS methodology (Lab 1) are generally lower, but very close, to those reported by the CEDIA methodology (Lab 1). This strongly suggests that these two sets of data are more reli-able than those derived from the ion trap LC–MS/MS methodology (Lab 2) for two reasons: (a) standard solution used for calibration for the CEDIA and the GC–MS methods came from two different sources, i.e., CEDIA reagent manufacturer and standard solutions prepared in the authors’ laboratory using reference materials from Cerillant Corporation; and (b) CEDIA reagent is known to respond to B and BG similarly with low CC to other major metabolites (NB and NBG)[28]; thus, what CEDIA reagent detects are basically what are targeted by GC–MS (B and hydrolyzed BG), plus its low level of responses toward other metabolites present in the specimen. This would explain why the CEDIA data are slightly higher.
Data generated by the ion trap LC–MS/MS methodology (Lab 2) are also slightly higher, but compatible in general. This is probably a reflection of a slight variation in the calibration standards used in these two laboratories. However, the concentrations of total B found in 5 of these 19 specimens by the ion trap LC–MS/MS (Lab 2) method are significantly higher; we have thus conducted further comparative studies on the analysis of these 5 specimens in yet a third laboratory (Lab 3) using both GC–MS and triple quadrupole LC–MS/MS instrumentations. The resulting data for these 5 speci-mens are summarized along with the CEDIA, GC–MS and ion trap LC–MS/MS data previously obtained in Lab 1 and Lab 2 (Table 6).
Table 6
Comparison of analytical data (all in ng/ml) obtained from three laboratories using GC–MS and two configurations of LC–MS/MS.
Specimen CEDIA GC–MS LC–MS/MS
Lab 1 Lab 1 Lab 3 Lab 3 Lab 2
Total buprenorphine (B) 1 77.0 75.9 88.4 67.9 129 36 24.2 12.6 18.0 19.2 55.9 45 28.4 19.6 25.2 17.2 77.5 50 46.7 29.0 39.1 31.0 74.1 51 66.4 54.3 53.1 46.0 118 Total norbuprenorphine (NB) 1 – 769 913 832 816 36 – 271 291 315 359 45 – 375 388 349 324 50 – 388 448 387 292 51 – 388 363 360 368
The LC–MS/MS instrumentation used by Lab 2 and Lab 3 are both from Agilent Technologies, but with ion trap and triple quadrupole configurations, respec-tively. Total concentrations of B and NB by the LC–MS/MS methods were calculated using the following formula: total [B] = free [B] + [BG] × [molecular weight of B (467.65)/molecular weight of BG (643.77)]; total [NB] = free [NB] + [NBG] × [molecular weight of NB (413.56)/molecular weight of NBG (589.67)]. Since CEDIA also exhibit low level of cross-reactivities to other metabolites, the observed total B concentrations are “apparent” values. Without using NB as the target analyte in CEDIA, total NB concentration could not be derived.
Data shown inTable 6reveal that four sets of total NB concentra-tions obtained in three laboratories using three different types of instrumentations are practically the same—they all practically fall within ±20% of the means. However, the total B concentrations for these 5 specimens derived from the ion trap LC–MS/MS instrument are significantly higher than the other three sets of data, which are statistically indistinguishable. An application note[36], by the man-ufacturer (Agilent Technologies) of both LC–MS/MS systems used in this study, strongly suggested that the triple quadrupole configu-ration was superior over the ion trap platform in providing accurate quantitation data: “For quantification, the QQQ [triple quadrupole] was the best. . . The ion trap [LC–MS/MS]. . . can be hampered by the presence of coeluting interferences, not making it the best choice for quantification.”
Interestingly, a recent study [37]stated that their “compari-son between the direct detection of [B] and its metabolites with the analysis. . . using the hydrolysis method is reported for the first time. . .” and found that “the direct method gave slightly higher concentrations for [B] metabolites compared to the hydrol-ysis method.” The authors proposed incomplete hydrolhydrol-ysis of the metabolites (present at high concentrations) as the cause of this observed difference. Our data have not shown this difference and wonder if the differences thereby reported were caused by not fac-toring in the molecular weight differences (between B/NB and their respective glucunonides) in concentration calculations.
In conclusion, we believe the GC–MS based approach has pro-vided the accurate analytical data.
4. Conclusions
This study has demonstrated the widely available technology, GC–MS, can be effectively applied to compliance monitoring and pharmarcokinetic/pharmacogenetic studies associated with the use of B as an agent for treating heroin addiction. Studies on issues critical to GC–MS analysis of B and its three metabolites, includ-ing extraction, hydrolysis, derivatization, and IS, concluded: (a)
acetyl-derivatization generates the products with most favorable chromatographic and ion intensity characteristics in GC–MS anal-ysis; (b) commercial solid-phase extraction devices highly effective for recovering all metabolites may not be suitable for the analysis of free B and NB; and (c) a 2-aliquot protocol is an effective GC–MS approach for the analysis of B, NB, BG, and BNG in urine specimens. Acknowledgments
This work is partially supported by (Taiwanese) National Science Council (NSC 96-2113-M-242-002-MY2) and Department of Health National Bureau of Controlled Drugs (DOH95-NNB-1011). References
[1] J. Mycek, R.A. Harvey, P.C. Champe, Lippincott’s Illustrated Reviews: Pharma-cology, 2nd edn., Lippincott Williams & Wilkins, Philadelphia, 2000. [2] L. McNicholas, Clinical Guidelines for the Use of Buprenorphine in the
Treatment of Opioid Addiction, Center for Substance Abuse Treatment, US Department of Health and Human Services, Washington, DC, 2004.
[3] B. Stoller, G.E. Bigelow, S.L. Walsh, E.C. Strain, Psychopharmacology 94 (2001) 230.
[4] P. Kintz, Forensic Sci. Int. 121 (2001) 65. [5] P. Kintz, Clin. Biochem. 35 (2002) 513.
[6] S.H. Lai, Y.J. Yao, D.S.T. Lo, Forensic Sci. Int. 262 (2006) 80.
[7] K. Kobayashi, T. Yamamoto, K. Chiba, M. Tani, N. Shimada, T. Ishizaki, Y. Kuroiwa, Drug Metab. Dispos. 26 (1998) 818.
[8] D.E. Moody, M.H. Slawson, E.C. Strain, J.D. Laycock, A.C. Spanbauer, R.L. Foltz, Anal. Biochem. 306 (2002) 31.
[9] A. Ceccato, R. Klinkenberg, P. Hubert, B. Streel, J. Pharm. Biomed. Anal. 32 (2003) 619.
[10] S.D. McAleer, R.J. Mills, T. Polack, T. Hussain, P.E. Rolan, A.D. Gibbs, Drug Alcohol Depend. 72 (2003) 75.
[11] D. Grimm, E. Paulty, J. Pöschl, O. Linderkamp, G. Skopp, Ther. Drug Monit. 27 (2005) 526.
[12] D. Favretto, G. Frison, S. Vogliardi, S.D. Ferrara, Rapid Commun. Mass Spectrom. 20 (2006) 1257.
[13] E.J. Fox, V.A. Tetlow, K.R. Allen, J. Anal. Toxicol. 30 (2006) 238. [14] D. Thieme, H. Sachs, M. Thevis, J. Mass Spectrom. 43 (2008) 974. [15] A. Polettini, M.A. Huestis, J. Chromatogr. B 754 (2001) 447.
[16] R. Kronstrand, T.G. Selden, M. Josefsson, J. Anal. Toxicol. 27 (2003) 464. [17] C.M. Murphy, M.A. Huestis, J. Mass Spectrom. 40 (2005) 70.
[18] A.I. Al-Asamari, R.A. Anderson, J. Anal. Toxicol. 31 (2007) 394. [19] A.-C. Liu, T.-Y. Lin, L.-W. Su, M.-R. Fuh, Talanta 75 (2008) 198. [20] D.C. Fuller, J. Anal. Toxicol. 32 (2008) 626.
[21] S. Hegstad, H.Z. Khiabani, E.L. Øiestad, T. Berg, A.S. Christophersen, J. Anal. Toxicol. 31 (2007) 214.
[22] S. Gopal, T.-B. Tzeng, A. Cowan, Eur. J. Pharmacol. Biopharmacol. 51 (2001) 147. [23] S. Feng, M.A. ElSohly, D.T. Duckworth, J. Anal. Toxicol. 25 (2001) 589. [24] S. Pirnay, S. Bouchonnet, F. Hervé, D. Libong, N. Milan, P. D’Athis, F. Baud, I.
Ricordel, J. Chromatogr. B 807 (2004) 335.
[25] S. George, C. George, M. Chauhan, Forensic Sci. Int. 143 (2004) 121. [26] M.A. ElSohly, W. Gul, S. Feng, T.P. Murphy, J. Anal. Toxicol. 29 (2005) 570. [27] C.-H. Wu, S.-C. Yang, W.-S. Wang, B.-G. Chen, C.-C. Lin, R.H. Liu, J. Chromatogr.
A 1182 (2008) 93.
[28] M.-Y. Wu, Y.-S. Wang, C.-C. Lin, D.-L. Lin, L.-W. Su, M.-H. Huang, R.H. Liu, Analyst 134 (2009) 1848.
[29] U.S. Department of Health and Human Services, Fed. Reg. 71 (2004) 19692. [30] Y.-S. Wang, Study on Issues Pertaining to the Application of Gas and Liquid
Chromatography–Mass Spectrometry to the Analysis of Buprenorphine and Its Metabolites in Urine (Master’s Thesis). Fooyin University, Kaohsiung Hsien, Taiwan, 2007.
[31] W.-T. Chang, D.-L. Lin, R.H. Liu, Forensic Sci. Int. 121 (2001) 174. [32] R.H. Liu, G.F. Foster, E.J. Cone, S.D. Kumar, J. Forensic Sci. 40 (1995) 983. [33] SOFT/AAFS Forensic Toxicology Laboratory Guidelines (2006 Version) Section
8 (www.soft-tox.org).
[34] R.H. Liu, T.-L. Lin, W.-T. Chang, C. Liu, W.-L. Tsay, J.-H. Li, T.-L. Kuo, Anal. Chem. 74 (2002) 618A.
[35] B.-G. Chen, C.D. Chang, C.-T. Wang, W.-T. Chang, S.-M. Wang, R.H. Liu, J. Am. Soc. Mass Spectrom. 19 (2008) 598.
[36] M. Zumwalt, J. Hughes, G. Kilby, J. Ropero-Miller, P. Stout, H.C. Walls, A Comparison of Several LC/MS Techniquies for Use in Toxicology (Application Note—Toxicology), Agilent Technologies, Inc., Englewood, CO, US, 2009. [37] A.I. Al-Asmari, R.A. Anderson, J. Anal. Toxicol. 28 (2008) 744.