E E E TRANSACTIONS ON FUZZY SYSTEMS, VOL. 3, NO. 3, AUGUST 1995 253
The Transform Image Codec Based on Fuzzy
Control and Human Visual System
Kuei-Ann Wen, Member, ZEEE, Chung-Yen Lu, and Ming-Chang
Tsai
Abstruct-A novel processing scheme for gray level image compression based on the human visual system ( H V S ) and fuzzy control is proposed. The spatial model of the threshold vision that incorporates the masking p r o c ~ takes account of two major sensitivities of the human visual system, namely background illumination levels and spatial frequency sensitivities. The distor- tion measures use common sense fuzzy rules for image quality prediction. The human visual models have been successfdly applied in image compression. By the addition of the visual
model, performance of these system have a visible improvement of subject quality depending on visual perception.
The processed image performs both improved compression ra- tio as well as improved SNR (signal to noise ratio) in compression to the standardized still image compression technique, i.e., the JPEG.
I. INTRODUCTION
S the field of digital image processing advanced due to
A
technical progress in its hardware and in its processing algorithms, there is simultaneously an increase in efforts aimed at developing sophisticated real-time automatic systems capable of emulating human abilities or imitating human thought. Be one of the most obvious concerned of these, the human vision acts not only as an organ of contact with outer world but also as an intermediary of recognition, learning, and amusement.The applications of digital speech and image signals are more and more intensive today than ever before. The transmis- sion of digital image data increases communication accuracy by requires increased bandwidth. The transmission of infor- mation is limited by the information carrying capacity of transmission media and approaches. Numerous strategies have been developed to minimize the bandwidth required by specific applications without significantly changing the characteristics of the transmitted signals. The subjectively pleasing appear- ance of high-definition television pictures creates a demand for systems with the bandwidth capable of delivering high image quality to the reviewers; thus high ratio compression schemes without loss of visual appearance are the subject of continuous research.
In this paper, we proposed a compression system based on JPEG baseline system which is inherently a transform coding system. With human visual model and fuzzy control combined, not only the compression ratio but also the decoding performance can be increased simultaneously.
Manuscript received August 6,1993; revised November 9, 1994. This paper
is sponsored by National Science Council Project NSC-84-2213-1-009-111.
The authors are with the Institute and Department of Electronic Engineering,
National Chiao Tung University, 1001, Ta Shueh Rd., HsinChu, Taiwan, ROC. IEEE Log Number 9410133.
n.
TRANSFORM CODINGTransform coding has been widely used in image data compression [1]-[4]. In a typical transform coding scheme, an input image is divided into nonoverlapping blocks and each block is transformed to produce an array of coefficients. The idea behind transform coding is to decorrelate the image pixels so that redundancy can be removed more efficiently in the transform domain. In this respect, the energy compaction property of the transform used is important. It is well known that the Karkunen-Loeve transform (KLT) is the optimum transform in the mean square error (MSE) sense, subject to the assumption that the image data are spatially wide-sense stationary. The basis functions for the KLT are data-dependent, however, and it is necessary to send them to the decoder. In addition, there are no fast computation algorithms for IUT. As a result, the IUT is rarely used in practice, and other orthogonal transformations that are easier to implement and are based on fixed-basis functions are preferred.
The two-dimensional (2-D) discrete cosine transform of a sequence f(j,
k)
for j,k
= 0 , 1 , .. . ,
N - 1, can be defined as( 2 j
+
1 ) U T (2k+
1)VT x cos[ 2 N ]cos[ 2 N]
(1) for U , ZI = 0 , 1 , .. . ,
N-
1 where 1 C(w) = - for w = 0Jz
= 1 f o r w = l , . . . , N - I and the inverse transform is given byN-1 N-1
u=o v=o
( 2 j
+
1)un (2k+
1 ) V Tx c o s
[
2 N ]cos[ 2 N]
(2)for j,
k
= 0 , 1 , .. .
,
N-
1.Among the many transforms commonly used, the cosine transform has been shown to process a superior energy com- paction property [5]-[8]. A basis DCT transform coder is illustrated in Fig. 1. The input image is first decomposed into disjoint blocks of equal sizes, say N x N pixels. The choice of block size is a trade-off between the compression efficiency and image quality. For typical images, larger block sizes usually result in a better compression since more pixels
Fig. 1. The block diagram of the basic discrete cosine transform coding. are provided for redundancy reduction. The assumption of data stationary no longer holds, however, if the block size becomes too large after degradations. Such things as rings and blocking artifacts are introduced, especially in blocks containing high- contrast edges. Experimental results have shown that a block size of 8 x 8 or 16 x 16 is a good compromise. After the image is blocked, the DCT is applied to each block of image data.
The transformed coefficients are then processed with thresh- old and quantization. The characteristics for threshold and quantization are defined as
2 = sign(X) min{T,
1x1)
Y = NINT(Z/Q)
where NINT stands for the nearest integer.
X
is the input before the threshold, Y is the output of the quantizer, and T , Q are the threshold and quantization step size. To ensure mean intensity continuity for adjacent blocks, the DC com- ponents are usually exempt from the thresholding process and are quantized with a relatively small step size. Finally, the 2-D quantized coefficients are zigzag scanned into a one-dimensional (1 -D) sequence whose nonzero amplitudes and run-length of zeros are entropy coded. Arranging the coefficients in the zigzag pattern results in long run-length codebook designed from their statistics.111. FUZZY CONTROL QUANTIZATION LEVEL
transform image coding now available, Ai represents the AC energy distribution of a subimage, and Bi denotes its quanti- zation amount. After the fuzzy rules decide the quantization level, we can threshold and quantize the DCT coefficients of subimages for compression.
IV. IMAGE QUALITY ASSESSMENT
Image quality assessment is a measure of degradation when an image is distorted from processing. The quality of an image depends on the purpose for which the image is intended. The image may be intended for causal human viewing, as in the case of a TV image, or it may be needed for precise quantitative measurement of some sort. The types and degrees of degradation that would be objectionable or acceptable might be quite different in these two cases.
There are many ways of measuring the fidelity of an image
2(m,n) to its original z ( m , n ) . One class of such methods uses simple measures of the similarity or difference between z and 2. For example, a widely used difference measure is the mean square deviation
cm
cn(z
- 2 ) 2 . Note that this type of measure cannot distinguish between a few large deviations and many small ones. One can, of course, also use measure such as the mean absolute deviationcm
En
Iz - 21, the maximum absolute deviation max (z - 21, or various measures of the correlation between 2 and ?.The image quality measure, actually a measure of quality degradation that has most often been used in digital compres- sion research is the MSE which deals primary with objective quality criteria. The mean square quantization error between an original image z ( m , n ) and its reconstructed image 2 ( m , n) can be written as
The theory of fuzzy sets provides a suitable algorithm
in analyzing complex systems and decision processes when 1 n f - l N - l
MSE = - [ z ( m . n ) - 2(m:n)12. (3) m=O n = O
the pattern indeterminacy is due to inherent variability or M N vagueness rather than randomness. A gray-level image having
multivalue levels of brightness possesses some ambiguity The MSE is a global measure of degradation that treats and uncertainty due to the image character and pixels. It is
justified to apply the concept and logic of fuzzy sets to image processing problems rather than ordinary set theory. An image can be considered as an array of fuzzy singletons each with a membership function denoting the degree of having some brightness levels. Our efforts and modifications are aimed at image compression.
Adaptive cosine transform coding [9] produces high qual- ity images at the rate less than 1 bivpixel. In almost all adaptive transform designs to date, transform is computed first, and transform energy is then measured to determine the quantization levels and code words so that those blocks of coefficients containing large amounts of energy are allocated more quantization levels and code bits formed classes of bit maps, the adaptive system classifies subimages into classes according their AC energy levels and encodes each class with different bit maps.
Transform coding based on fuzzy control uses common sense fuzzy rules for determination of a quantization level decision. Fuzzy rules [lo] encode structured knowledge as fuzzy associations. The fuzzy association (Ai, Bi) represents the linguistic rule “IF
X
IS Ai, THEN Y IS Bi.” In fuzzyall spatial frequencies and brightness levels in the image uniformly, and it does not adequately tract the types of degra- dation caused by image compression processing techniques. We have no idea of what actually the degradation is and how it affects the image’s quality to a certain extent.
Some researchers, [ 111 and [ 121, have attempted to improve upon quality assessment by incorporating elaborate models of the visual processes. Such models have been desired in an attempt to simulate the effects of many of the parameters affect vision, such as orientation, field angle, and Mach bands, but their utility for practical problems is small due to their complexity, inherent unknowns, and need for sometimes detailed a priori knowledge of viewing condition parameter values.
We have known that though the MSE has a good physical and theoretical basis, it often correlates poorly with the subjec- tively judged distortion of the image. Much of the reason for this is due to the fact that the human visual system does not process the image in a point by point fashion but extracts spatial, temporal, and chromatic feature for neural coding. Image quality assessment can be viewed as the search for a metric which will reflect these subject properties of the image.
255
T
i
IChuvlell
Fig. 2. Block diagram of image compression coding scheme.
It has been found, however, that several simplifying as- sumptions for the visual model can still lead to a quality measure that performs better than, for instance, the MSE, which does not incorporate a visual model [ 191, [ 121. Even after incorporating a visual response function in a quality measure, however, a further refinement is in order. To refine more closely and mimic how a human assesses quality [20], a mathematical visual response function is applied as well as a weighting factor incorporated. It puts more emphasis on high- structure subimage areas and less emphasis on low-structure subimage areas. Bringing together the previous concepts and the framework of the MSE difference between the original and processed images, the quality measure in the 2-D discrete spatial frequency domain is given as
E M-1 N-1
K-l wi H2(r)[Fz(u, v) - Fi(U, 4 1 2 (4) i=l u=O u=o
where
B number of subimage blocks.
K normalization factor.
H ( r ) spatial frequency response of H V S .
Fi, Fi discrete cosine transform of unprocessed and processed subimage ith, respectively. wi weighting factor of the ith subimage.
V. THE TRANSFORM IMAGE CODEC BASED ON The block diagram of our image compression coding scheme is illustrated in Fig. 2. Scheme in spatial domain is first transformed to frequency domain by DCT. In the following sections, the operation of the various stages of the transmitter are described. Those in the receiver are basically the reverse of the transmitter.
FUZZY CONTROL AND HlJh4AN VISUAL SYSTEM
A. Cosine Transform
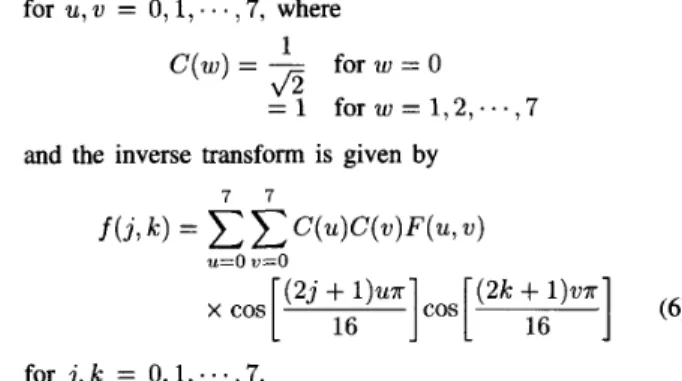
The input image is divided into nonoverlapping blocks of 8 x 8 pixels. The 2-D discrete cosine transform of a sequence
f ( j ,
k)
for j,k
= 0 , 1 , . ,7, can be defined asfor U , v = 0 , 1 , .
. .
,7, where C(W) = - 1 for w = 0for w = 1,2,...,7
\/z
= 1and the inverse transform is given by
7 7
u=o v = o
( 2 j
+
1) ua (2k+
1)vax cos[ 16 ]cos[ 16
]
(6)for j,
k
= 0 , 1 , .. .
,7.B. Human Visual System (HVS) Model
Many researches [ 131-[15] have measured the human threshold contrast to periodic patterns viewed at a range of spatial frequencies of sine waves, square waves, etc. Mathematically applied linear systems concepts to the response of the visual system to an impulse light stimulus, the Fourier transform of the response has proposed in the literature [14], [16]. The generalized human visual system response [17] can be represented by
(7) where w is the radial frequency in cycle per degree of visual angle subtended and a, b, c are constants that determine the shape of the H V S curve. It is found that the best filter function whose peak value falls between 3 and 5 cycle/degree of visual angle subtend at the normal viewing distance of four times the picture height.
To use the cosine transform in image coding, an even extension of original scene has to be created, but this causes the loss of physical significance since the human observer is not viewing this altered scene. Nil1 [17] proposed a function \A( w)
1
to overcome thisH(w) = ( a
+
bw) exp(-cw)4a2w2
IA(w)l= ['+'(In( 4 a 2
?+
(
7
+
1)'))'I
'
(8) for the HVS model. Thus (8) is rewritten asa ( w ) = IA(w)(H(w). (9)
& ( U , v) = a ( w ) (10) A 2-D circularly symmetric HVS function defined by
where w = u2
+
v2 is formed. to giveH ( u , v) is used to weigh the cosine transform coefficients
F ( u , v ) = H ( u , v ) F ( u , v). (11) It simply implies that the high spatial frequencies in the DCT domain play a more important role for image quality than they do in the equivalent
FFT
domain.The coefficients are weighted by the visual response func- tion H(w) with w,,, = 3 cycleddegree which experimentally proved to be optimal for decoding image SNR consideration.
Fig. 3. Fuzzy-set values of fuzzy variables T, B , and C
C. Fuzzy Decision
Transform coding based on fuzzy control uses common sense fuzzy rules for determination of quantization level. Fuzzy rules encode structured knowledge as fuzzy association (Ai, Si) represents the linguistic rule “If
X
is Ai, ThenY
is Bi.”We exploit the HVS property that human sensitivity to noise is less in the very bright and very dark areas (contrast sensitivity). The areas can be more coarsely quantized than the middle luminance range. The human sensitivity to noise is also less in the high-variance region than in the low-variance region.
We computed the total AC power T and the low-frequency AC power L, background luminance
B
and compaction degreeC of a subimage in terms of the DCT coefficients { F ( u , U)} as
7 7
u=o v=o
3 3 - U
The fuzzy variable T assumed only one fuzzy-set values: BG (big). The fuzzy variable B assumed only the three fuzzy-set values: BR (bright), MO (medium), and DA (dark). The fuzzy variable C assumed only the two fuzzy-set values: LG (large)
and SM (small). The membership functions of fuzzy variables T, B, and C are shown in Fig. 3.
We build the fuzzy set decision rules for quantization level (QL).
Rule 1: If T is large, then QL should be small.
Rule 2: If
B
is medium, QL should increase. IfB
is not medium, QL will decrease, and QL will decrease more whenB is light than when B is dark.
Rule 3: If C is large, QL should increase. If C is small, QL should decrease.
Rule 4: If T is small, a small variation of B will be distinguishable, and the affect of B should increase.
Rule 5: If T is large, small variation of C will be distin- guishable, and the affect of C should decrease.
Rule 1 is set owing to that human sensitivity to noise is less in the high-variance region than in low-variance region. Rule 2 is owing to two reasons: one is that human sensitivity to noise is low in the bright and dark areas, two is that the
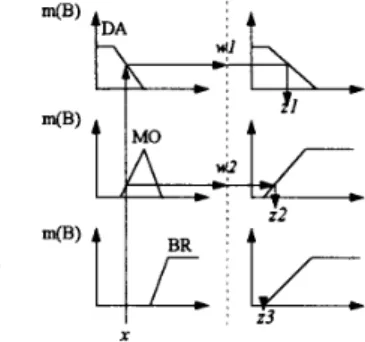
Fig. 4. Fuzzification and defuzzification of T: QT = Z .
X
Fig. 5. Fuzzification and defuzzification of B: Q B = w ’ * ~ . ~ ~ ~ ; ~ ~ ~ 3 * 3 .
X
Fig. 6. Fuzzification and defuzzification of C : Qc =
w .
sensitivity in dark areas is high than in the bright areas. Rule 3 is owing to that more compaction will make the subimages being dependent on fewer coefficients and we should increase the quantization level. Rules
4
and 5 are based on human heuristic.The fuzzy rules are illustrated as shown in Figs. 4, 5, and 6.
Q f i n a l = QT
+
AFB*
QB+
AF,*
Q c (16) whereAFB
is the affect factor ofB
andAFc
is the affect factor of C.where Q(o) means threshold and quantization.
QL is defined from level 1 to level 12, i.e., QL,, is 12 and QLmin is 1. The HVS masks are based on the human
251
visual system response function described in the previous section with a different size scale, and 12 H V S masks are generated. After the multiplication of an HVS mask, the weighted coefficients are quantized and the quantizer is a uniform quantization.
D. Adaptive Block Distortion Equalization
In block coding schemes, the distortion measure on each block indicates the reconstruction quality of each of the image blocks. When two or more adjacent blocks have large differences in distortion measures, the human observer is likely to detect some distortion gradients across the blocks. Such distortion gradients will be perceived as the presence of block edge structures. An approach to reduce the block structure is to reduce this distortion gradient by equalizing the distortion gradient across the adjacent blocks. This can be done by remultiplying with a larger H V S mask coefficients for the block with large distortion. Block distortion gradient can be estimated by the inter-block distortion ratio
G(m,n)
of the (m, n)th block defined aswhere E ( m , n ) and E ( m , n-1) are the perceptual MSE of the current and preceding block, respectively. E ( m , n) is given by
7 7
where Fm,n(u, w) are the weighted transform coefficients of the (m,n)th block.
Fm,,(u,v) are the quantized transform coefficients of the (m, n)th block.
A positive value of G ( m , n) indicates that the distortion in the current block is greater than that of the preceding block and vice versa. We established distortion gradient threshold bound empirically such that the block structures become objectionable when G ( m , n) is out of the bound. To carry out distortion equalization, G ( m , n) between two adjacent blocks is calculated. If G(m,n) falls within the threshold bounds, no equalization will be needed. If G(m, n) is greater than the upper bound, larger HVS mask coefficients are selected to be remultiplied.
E. Zigzag Scan, Normalization Table, and Coding
The quantized transform coefficients are coded according to the zigzag scan. The zigzag scan order of two-dimension 8 x 8 block is shown in Table I. Before the quantization of coefficients, normalization factors Z(u, w) will be used to weigh each coefficient of a fuzzy transformed subimages as listed in Table 11. We use Huffman codes and runlength codes for further compression.
As for the other nonzero coefficients, their magnitudes are coded by an amplitude lookup table, and the addresses of the coefficients are coded using a runlength lookup table. The
TABLE I
ZIGZAG SCAN OF 8 X 8 COSINE TRANSFORM COEFFICIENTS 1 2 6 7 15 16 28 29 3 5 8 14 17 27 30 43 4 9 13 18 26 31 42 44 10 12 19 25 32 41 45 54 11 20 24 33 40 46 53 55 21 23 34 39 47 52 56 61 22 35 38 48 51 57 60 62 36 37 49 50 58 59 63 64 TABLE II NORMALIZATION TA~LE Z( U, U) 16 1 1 10 16 24 40 51 61 12 12 14 19 26 58 60 55 14 13 16 24 40 57 69 56 14 17 22 29 51 87 80 62 18 22 37 56 68 109 103 77 24 35 55 64 81 104 113 92 49 64 78 87 103 121 120 101 72 92 95 98 112 100 103 99 TABLE Ill
MEASURES OF PSNR, MSE, CR UNDER H V S AND FUZZY CONTROL
Image CR PSNR(dB) MSE
Lena 36.25 29.74 68.97
Pepper 36.25 29.45 73.86
amplitude and runlength tables are simply Huffman codes derived from the his_tograms of quantized weighted transform coefficients Round[F,,,(u, w)/Z(u, U)]. As demonstrated by
the histograms, the domination of low amplitudes and short runs of zero-valued coefficients indicates that Huffman tables are relatively insensitive to the type of input images.
VI. PERFORhfANCE EVALUATION
For functionality simulation, we used the compression ratio (CR), MSE, and peak signal-to-noise
(PSNR)
to evaluate reconstructed image quality objectively0
C R =
-
nL,
where 0 denotes the total bits of the original image and C denotes the total bits of the encoded image.
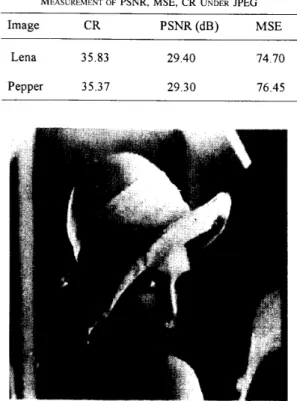
The objective quality measure is shown in Table
m,
and the images are shown in Figs. 7 and 8. In comparison to the P E G baseline system, as listed in TableIV,
we found that both the CR andPSNR
are increased, and the comparison images are shown in Figs. 9 and 10. The comparison is under a very high compression ratio as mentioned above, and better human perceptual quality can be obtained with fuzzy transformed images based on H V S model.TABLE IV
MEASUREMENT OF PSNR, MSE, CR UNDER JPEG
Image CR PSNR(dB) MSE
Lena 35.83 29.40 74.70
Pepper 35.37 29.30 76.45
Fig. 9. Lena (.512 x 312) under JPEG.
Fig. 7. Lena (512 x 51%) under HVS and fuzzy control
Fig. IO. Pepper (512 x 512) under JPEG
knowledge to the processing of images. We have combined HVS, fuzzy control, and image compression and obtained satisfied performance on the decoded images. It promotes the use of HVS and fuzzy control on image sequences, i.e., the video for video transmissions.
Fig. 8. Pepper ( j 1 2 x ,512) under HVS and fuzzy control.
VII. CONCLUSION
We have presented novel processing schemes for gray level image compression based on HVS and fuzzy control. Many of the complexities of human visual behavior have been mathematically modeled in sufficient quantitative detail and comprehensively organized in sufficient qualitative detail to be implemented with digital solutions. The human visual system provides us with a unifying basis for our understanding of the visual process itself as well as for the application of the
REFERENCES
A. G. Tescher, “Transform image coding,” in Advances in E[ectronics
and Elecrron Physics, W. K. Pratt, Ed. New York Academic, 1979, Suppl. 12, Ch. 4, pp. 113-155.
P. A. Wintz, “Transform picture coding,” Proc. IEEE. vol. 60. pp. 809-820, July 1972.
W. K. Pratt. J. Kane. and H. C. Andrews. “Hadamard transform image coding,” Proc. IEEE, vol. 57, pp. 5 8 4 8 , Jan. 1969.
K. N. Ngan, “Adaptive transform coding of video images,” Proc. IEE, vol. 129, pt. F, pp. 2 8 4 0 , Feb. 1982.
N. Ahmed, T. Natarajan. and K. Rao, “Discrete cosine transform,” IEEE
Trans. Computer, vol. c-23, pp. 9G93, Jan. 1974.
M. Hamidi and J. Pearl, “Comparison of cosine and Fourier transform of Markov- 1 signals,” IEEE Trans. Acousr., Speech, Signal Processing, vol. ASSP-24. pp. 428429. Oct. 1976.
[7] A. K. Jain, “A sinusoidal family of unitary transform,” ZEEE Trans.
Patt. Anal. Mach. Intell., vol. PAMI-I, Oct. 1979.
[8] W. K. Pratt, W. H. Chen, and R. Welch, “Slant transform image coding,’’
IEEE Trans. Commun., vol. COM-22, pp. 1075-1093, Aug. 1974. [9] W. H. Chen and C. H. Smith, “Adaptive coding of monochrome and
color images,” ZEEE Trans. Commun., vol. COM-25, pp. 1285-1292, Nov. 1977.
1101 B. Kosko, Neural Networks and F u u y Systems. Englewood Cliffs, N J
Prentice-Hall, 1992.
[ 111 I. Overington, “Toward a complete model of photopic visual threshold performance,” Opt. Eng., vol. 21, pp. 2-13, Jan. 1974.
[12] A. Schnitzler, “Effects of spatial frequency filtering on the performance of the composite photographic-human visual system,” Phorogr. Sci. Eng., vol. 21, pp. 209-215, July-Aug. 1977.
[13] T. G. Stockham, “Image processing in the context of a visual model,”
Proc. IEEE, vol. 60, pp. 828-842, 1972.
[14] J. L. Mannos and D. J. Sakrison, “The effects of a visual model fidelity criterion on the encoding of images,” IEEE Trans. Inform. Theory, vol.
[I51 J. A. Saghri, P. S. Cheatham, and A. Habibi, “Image quality measure based on a human visual system model,” Opt. Eng., vol. 28, pp. 813-818, 1989.
[I61 D. J. Sakrison, “On the role of the observer and a distortion measure in image transmission,” IEEE Trans. Commun., vol. COM-25, pp. [I71 N. B. Nill, “A visual model weighted cosine transform for image compression and quality assessment,” IEEE Trans. Commun., vol. COM- [I81 A. Puri and R. Aravind, “Motion-compensated video coding with adaptive perceptual quantization,” IEEE Trans. Circuits Syst. I & 11, [I91 F. X. J. Lukas and Z. L. Budrikis, “Picture quality prediction based on a visual model,” IEEE Trans. Commun., vol. COM-30, pp. 1679-1692, July 1982.
[20] M. Guglielmo, “An analysis of error behavior in the implementation of 2-D orthogonal transformations,” IEEE Trans. Commun., vol. COM-34, IT-20, pp. 525-536, 1974.
1251-1267, 1974. 33, pp. 551-557, 1985. pp. 351-361, 1991.
pp. 973-975, 1986.
Kuei-Ann Wen (M’90) was bom in Keelung, Tai- wan, Republic of China, in 1961. She received the B.E.E., M.E.E., and Ph.D. degrees from the Department of Electrical Engineering and Institute of Electrical and Computer Engineering at National Cheng Kung University, Taiwan, R.O.C., in 1983, 1985, and 1988, respectively.
She is presently a Professor in the Department of Electronics Engineering, National Chiao Tung University, HsinChu, Taiwan, Republic of China, where she has joined the Center for Telecommuni- cations Research. Her current research interests are in the areas of high-speed digital signal processing, parallel processing and VLSI circuit design, and errorcorrecting coding.
Chung-Yen Lu was born in Taipei, Tawan, R.O.C., in 1969. He received the B.E.E. and M.E.E. degrees from the Department of Electronics Engineering at Natlonal Chiao Tung Umversity.
He is pursuing the Ph.D. degree at the Institute of Electronics Engineering at National Chiao Tung University. His current research interests are m the image and video processing, especially in transform image compression.
Ming-Chang ’&ai was bom in Kaouhsiung, on May 21,1969. He received the B.S. degree from the Department of Applied Mathematics of National Cheng Chi University in June 1991. He received the M.S. degree from the Institute of Electronics Engineering at National Chiao Tung University in June 1993.