Chiao Da Management Review 均1. 34 No.l, 2014 pp.79-116
交易前透明度、委託單失衡與投資人
行為偏誤之關聯性
The
Relationship
be側reenPre-trade Transparency
,
Order
Imbalance
and Investors' Behavioral Biases
林雅玲1 Yaling Lin 義守大學財務金融學系
Department ofFinance, I-Shou University 馬黛 TaiMa
國立中山大學財務管理學系
Department ofFinance, National Sun Yat-sen University
摘要:本文主要以日資料及高頻率逐筆日內資料探討當揭示資訊更多時是 否存在著投資人的行為偏誤以致對市場造成異常影響?實證顯示散戶的委 託失衡日內型態大致呈現倒 U 型,而法人則大致呈現類似 W 型態的波浪狀, 且 W 型態的高峰點在較透明市場有往前移的現象 。 另外,散戶在較透明環 境的盤中從眾強度會增加,且進一步利用追蹤資料模型與分量迴歸模型發 現,散戶與國外法人無論市場是否透明皆有對作的現象,而這情況在透明 市場中會發生在較高分位的委託失衡 。 再者,外資可能因揭示資訊增加更 能掌握盤面變化而顯得對本身的決策更加有自信,因為無論是以價或量的 指標皆發現其在透明市場的交易更為積極,但另方面也由其委託失衡之日 內型態、下單參與率及委託規模發現他們會很精明的在盤中將委託單分散 以避免獨佔資訊在透明市場中迅速外漏 。 關鍵詞:交易前透明度;下單行為;委託單失衡;從眾;過度自信
Abstract This research analyzes the relationship between pre-仕ade
1 Corresponding au也or: Depa的nent of Finance, I-Shou University, Kaohsiung City, Taiwan, E-mail:[email protected]. The research is 臼nded by the National Science Council of the R.O.C., Taiwan. (Project Nurnber: NSC 98-241O-H-214 -018).
80 The Relationship between Pre-trade Transparency,
Order 1mbalance and lnvestors' Behavioral Biases
transparency, order imbalance and investors' behavioral biases. The impact of increasing pre-甘ade 仕ansparency on the varied order behavior is determined for three different types of investors: indívídual ínvestors, domestíc and foreígn ínstitutíonal ínvestors. The empírical results show that the intraday pattem of order imbalance for individual investors exhibits an inverse U-pattem
,
while that for institutional investors displays a quasi W -pattem and the several peak poínts of the W-p甜em move forward in a more 仕ansparent market.Additionally, the measure of herding for individual investors increases as market transparency increases and the current order imbalance of individual investors is significant1y negatívely affected by the previous order imbalance of foreígn ínstitutional investors. As foreign traders produce a larger order ímbalance, índividual ínvestors begín to pay attention. Foreign traders also seem to be more vigorous and confident in a more transparent market. However
,
they also 甘Y to conceal their real motive by using order splitting s仕ategies to avoid information leaks fast according to the in仕aday pa位em of order imbalance and 仕adingactivity.Keywords : Pre-trade 仕ansp缸ency; Order behavior; Order imbalance; Herding; Overconfidence
1.Introduction
A number of studies have exarnined the effect of transparency on market performance, but no agreement has been reached (e.g., Boehmer, Saar and 泊, 2005; Madhav妞, Porter and Weaver, 2005). Few studies have focused on the relationship between market transparency and ínvestors' behavioral biases. However, the order behavior depends on the investors' perception. Schachter
,
Andreassen and Gerin (1986) noted that the stock market is a place where people interact,
stock price represents“
opínions" and any change in opinions is usually associated with the influence of others. As information disc10sure is becoming more and more complete, investors can scrutinize others' tradíng decisions more easily. Investors may have stronger intentions to follow others'Chiao Da Management Review Vol. 34 No.J, 2014 81
S甘ategies, so herding behavior becomes more significant
,
or investors may use information to trade in the opposite direction, because of overconfidence. These behavioral biases are likely to have an abnormal impact on the market and may cause orders to show imbalances (Lee, L凹, Roll, and Subrahmanyam, 2004). Without knowledge of the reactions of different market participants,
it is difficult to evaluate the complicated effects of 仕ansparency enhancement. BothShe企in (2002) and Kuo (2008) incorporated the common concept of behavioral fmance
“
herding" and“
overconfidence" into irrational biases. However, it should be noted that these biases are not necessarily considered to be an error,
but an opposing viewpoint based on the rational hypothesis of economists,
which is characterized by a psychological behavioral reaction. This research mainly concems whether investors' behavioral biases actually exist.
The related literature includes research on market transparency
,
order imbalance and behavioral biases. Firstly,
in terms of market 甘ansparency, many studies primarily focus on how market 仕ansparency influences each aspect of market quality (e.g., liquidity,仕ansaction cost and the process of pricediscovery). Theoretical and empirical studies ofthe impact of 仕ansparencyhave been inconclusive. In terms of theoretical studies, Madhavan (1996) demonstrated that market transparency can increase price volatility and reduce market liquidity in a thin market. Pagano and Röell (1996) studied the price formation process in several stylized trading systems with varying degrees of transparency and observed that, overall, greater 甘ansparency results in lower trading costs for uninformed traders, although not necessarily for all 仕ade sizes. In terms of empirical studies, Madhavan, Porter and Weaver (2005) studied 血e
effect of an increase in the pre-trade 仕ansparency for the Toronto Stock Exchange and found that volatility and execution costs increase, whereas liquidity decreases. Boehmer
,
Saar and Yu (2005) studied the impact of increased order book transparency in the New York Stock Exchange (NYSE) and obtained results that were con仕ary to those obtained for the Canadian market. It was found that greater order flow transparency leads to increased liquidity and reduced trade execution costs. Dong,
Han and Li (2006) also studied the effects of improved 仕ansparency in China's A share markets an82 The Re/ationship between Pre-trade Transparen句,
Order 1mbalance and lnvestors ' Behavioral Biases
found that the market quality improved, as demonstrated by lower volatility,
higher market liquidity and improved informative e宜iciency. Eom, Ok and Park (2007) found that the market quality of the Korea Exchange (KRX) is increasing and is concave in pre-trade transparency, with significant1y diminishing returns above a certain point. Chung and Chuwonganant (2009) studied the effect of pre-trade transparency on market quality, using data before and after the in甘oductionof SuperMontage and found that both bid-ask spreads and return volatility dec1ined significant1y after the implementation of SuperMontage. Lucarelli, Bontempi and Mazzoli (2010) studied pre-trade transparency in the Italian Stock Exchange in 2007 and showed the role of the order flow disc10sure in reducing both the adverse selection component of the bid-ask spread and the
“
lemons discount" asked by individual investors to negotiate on risky or illiquid stocks. Additionally, in the Taiwanese stock market,Ma, Lin and Chen (2008) found that greater pre舟ade transparency intensifies aggressiveness in order placement, reduces ex甘eme order placement by individual investors and changes 甘ader order sizes. However, greater transparency increases volatility, but not liquidity and efficiency. Lin, Ma and Chen (2011) continued to study the effect of 甘ansparency on the information content of the limit order book and its effect on order placement strategies. It
was found that the best quotes for unexecuted orders for individual traders always contain more information than the average quotes 企om steps 2 to 5, but this does not apply to institutional investors. Lin (2014) showed that greater transparency enables larger trades to utilize s仕ategic stealth trading to prevent information 企om quickly leaking by selecting both 仕ade sizes and time intervals.2
Most of these studies of 仕ansparency focus primarily on market performance but do not consider the influence of transparency on the investor order placement strategies, except those of Boehmer et al. (2005), Ma et al. (2008), Lin et al. (2011) and Lin (2014). Even Boe恤er et al. (2005) only considered the cancellation rate and the order size, Ma et al. (2008) stressed the
Chiao Da Management Review 均l. 34 No.l, 2014 83
order aggressiveness, Lin et al. (2011) stressed the information content of limit
order books and Lin (2014) focused mainly on stealth trading strategy. None
c1arify whether investors' behavioral biases exist in the 仕ansparent market and these biases can have an abnormal impact on the market.
Secondly, previous studies considered the ongm and autocorrelation of order imbalance and its influence on stock returns
,
market performance and spread formation. Chordia, Ro11 and Subrahmanyam (2002), Chordia and Subrahmanyam (2004) and Lee,
Liu,
Ro11 and Subrahmanyam (2004) all found that daily order imbalance is significantly positively auto-correlated. Lee et al.(2004) further found that the continuous order imbalance for the foreign institutional investors is more significant than for other types of traders and the order splitting or herding behavior of investors can cause continuous order imbalance. With regard to the influence of order imbalance on stock return,
Brown, Walsh and Yuen (1997) studied the 20 most active shares on the Australian Stock Exchange and proposed a two-way causal relationship between order imbalance and stock return. However, this relationship was not sustained beyond a single day and its validity was less defmite after the current independent variables had been eliminated. In relation to the effect of order imbalance on market performance
,
Huang and Sto11 (1997) used models to demonstrate that in仕aday price variation is caused by order imbalance. Chan and Fong (2000) 如此herfound that part of the Volatility-Volume Relationship is caused by the effect of order imbalance on price variation. Additional旬" Chordia et al. (2002) found that a greater order imbalance results in a larger spread and lower liquidity. Although order imbalance affects liquidity, it cannot predict the next change of liquidity. Handa,
Scwartz and Tiwari (2003) modeled the process of quote setting and price formation in a non-intermediated, order driven market. They found that the location of the bid and offer quotes and the size of the bid-ask spread depend on three things: the difference in the valuation between groups of investors, the proportions of investors in each of the groups and adverse selection.In summary, past research has focused on the autocorrelation of order imbalance and its influence on stock returns, market performance and spread
84 The Relationsh月'p between Pre-trade Transparenc只 Order 1mbalance and lnvestors ' Behavioral Biases
formation. No studies consider the related issues of market 仕ansparency. In
view of this, Liao (2005), Ma, Lin and Liao (2006) and Lin , Ma and Chen (2007) began to study the impact of market transparency on order imbalance, but their main motivation was to deterrnine whether the order imbalances of the different aggressive orders ( such as market orders and limit orders ) in the less and more 仕ansparent market are different. They did not distinguish the directions of order imbalance and discussed the relationship between order imbalance and investors' behavioural biases in detail. Lee et al. (2004) found that order imbalance can be a result of herding. Therefore, this study 臼rther
examines whether this problem is more obvious or reduces with greater information disclosure. Under-confident investors may follow the investrnent strategy of others to maintain a sense of security. However, over-confident investors may overvalue their own judgments when they have a better grasp of the market.
Thirdly, since research into investors' behavioral biases, Kuo (2008) has shown that for
“
irrational bias", herding is noticed early. From a psychological
point of view, herding is based on insecurity and regret aversion. However, overconfidence is also a psychological bias. Overconfidence is defined a condition whereby individuals evaluate their own characteristics and ability to be greater than the actual level. She台in (2002) classified overconfidence intoheuristic 釘iven bias. People exhibit biased behavior mostly because of the outside environmental system or limited intelligence. The former are caused by market mechanisms,仕ansaction costs and information asyrnme仕y and this paper explores the scope of these. The following focuses on the literatures related to herding and overconfidence.
In terms of herding behavior, Banerjee (1992) found that following other people's actions and making the same decisions are herding behaviors. Cote and Sander (1997) defmed herding as individual investors changing their minds and attempting to approach the market public expectations. Nofsinger and Sias (1999) defmed herding as investors having a tendency to rush in the same
仕ading direction during a certain period. She企血 (2002) classified herding as a
Chiao Da Management Review Vol. 34 No.1, 2014 85
generated by non-fundamental factors. Although there are other defmitions, all are derived 企om the two characteristics:
“
trading in the same direction" and“
following the market'\In addition,
Devenow and Welch (1996) c1assified herding into three categories: extemal benefit (i丸 Froot, Sharfstein and Stein, 1992; Hirshleifer,
Subrahmanyam and Titman,
1994),
the reputation and agency problem (i.e.,
Scharfstein and Stein,
1990 Maug and Naik,
1998) and information waterfall stream (i.e.,
Banerjee,
1992 ; Bikhchandani,
Hirshleifer and Welch,
1992).Odean (1998) c1assified overconfident behavior into three categories: overestimating the information preClSlon (i.e.
,
Kyle and Wang,
1997),
overestimating individual abilities andjudgment (i.e., Taylor and Brown, 1988 ; She台血, 2002) and being overoptimistic. Both overotimism and overestimation of an individual's own abilities are positive illusions,
which is different 企om overestimating the precision of information (Biais,
Hilton,
Mazurier and Poug剖, 2005). However,
all cause investors to be excessively concemed about their information and judgment and ignoring other people's perspectives in the market to produce more transactions (Odean, 1998). For these different reasons, overestimating the precision of information results in underestimation of the risk and an increase in the willingness of investors to 仕ade (J affe and Winkler,
1976). Trusting their own judgment excessively allows investors to undertake more courageous transactions
,
and overly optirnistic investors mistakenly make a higher expected utility,
so 仕ansactions increase.In su虹una旬, these related studies focus on the definition, the c1assification
or the reason for behavioral biases, but do not consider the relationship between biased behavior and order imbalance. Lee et al. (2004) determined the market participants as herding or splitting order by discriminating the autocorrelation of daily order imbalance 企om sub-samples
, “
inc1uding same traders" and“
exc1uding same traders". For example, if the autocorrelation of order imbalance 企oma sub-sample“
inc1uding same traders" is larger than that 企oma sub-sample“
exc1uding same traders" but the difference is not significant,
it is determined that the investors' continuous orders result 企om herding. However, this method may require the exact investor account information and the order86 The Relationship between Pre-trade Transparency,
Order 1mbalance and lnvestors ' Behavioral Biases
imbalance is only for market orders (i.e., the net order flow resulting 企om
trades th剖 demand immediacy). Additional旬, these do not consider pre-trade transparency.
Order flow disclosure on the Taiwanese Stock Exchange has gradually increased
,
since January 2,
2003,
which provides a unique opportunity to empirically determine whether investors are more rational when there is greaterp時t叫e 甘ansparenc弘 This study mainly uses the dai!y and intraday data to study this issue. The ratio of order imbalance is used to measure the degree of market abnormality and then the concepts of herding and overconfidence are used to determine the change of order imbalance in a 仕ansparent market. The empirical results show that the intraday pa悅m for order imbalance for individual investors exhibits an inverse U-pattem, while that for institutional investors has a quasi W-pattem and the several peak points of W-pattem move forward in a more 甘ansparent market. In addition
,
the order imbalances for individual investors increase as transparency increases and the degree of herding also increases in the middle trading intervals,
especially for sellers. A panel data model and quantile regression model are used to determine the interaction between individual investors and institutional investors. The previous order imbalances of foreign institutional investors negatively affect the current order imbalances of individual investors, and this satiation occurs especially in the higher quantile,的 the market 仕ansp訂ency is raised. Furthermore, either in terms of price or volume indicators, the foreign institutional investors are more aggressive. This result shows that they can increase confidence because they better understand a market with greater仕ansparency. However
,
they may split their orders in the middle 甘adingintervals to avoid the private information leaks
,
once again proving the intraday pattem for order imbalance.Chiao Da Management Review Vol. 34 No.1, 2014 87
2. Data and Methodology
2.1 Data
The sample comprises the 200 stocks of the most active fmns listed on the Taiwan Stock Exchange 企om September 2002 to June 2003. To compare the influence of the different levels of transparency
,
the sample period covers two stages of increasing transparency,
inc1uding four months for each stage. This study defines September to December of 2002 as the frrst stage, the least transparent stage,
when only the quote and the volume of the best bid/ask are disc10sed (hereafter refe虹edto as the“
pre-transparent period"); March to June of 2003 is defined as the second stage,
the more 仕ansparentperiod during which the top five prices in the book are revealed together with information on the depth at each price (hereafter referred to as the“
post-transparent period"). Because the gap between the frrst stage and the second stage is about six months,so selecting the later consecutive four months is considered reasonable in the frrst stage. We do not choose the former two months are due to the market is still in the adjustrnent period, investors have not yet fully farniliar with the market system
,
hence,
it is less appropriate compared to other periods. Furthermore, if the sample period is too late, for example, over June 2003 (the new system has been implemented for more than six months), this research may be atfected by other interferences, and can not solely focus on the information disc1osure.The intraday data set contains the complete order book and all of the trades
executed 企om September 2002 to June 2003 during the trading session. The records of each order and 仕ade inc1ude information on the price, size, direction,
investor type (institutional or individual), and the time-stamped to the nearest one-hundredth of a second.ln the intraday analysis
,
the trading time is divided into nine half-hour intervals, the first running from 9:01 a.m. to 9:30 a.m. and the last comprising the th甘ty minutes before the c10sing call. If the intraday interval is too short, the observations may be fewer, while if the intraday88 The Relationship between Pre-trade Tran司parency,
Order 1mbalance and lnvestors ' Behavioral Biases
interval is too long, the nature of in仕aday data may be lost, and therefore an interval of 30 minutes should be appropriate.3
2.2
MethodologyThis section frrst utilizes the ratios of order imbalance to measure the market abnormality and then determines whether investors' behavioral biases (such as herding and overconfidence) exist when there is greater 仕ansparency.
2.2.10rder Imbalance
The ratios of order imbalance (hereafter referred to as the
“
OIM") are calculated according to the order quantity submitted by specific investors during each 30-min trading interval. Investors are divided into individual investors, foreign institutional investors and domestic institutional investors. The institutional investors comprise the foreign and domestic institutional investors. The calculating processes are shown below:(1) Without Considering the Direction
Initially, Liao (2005), Ma et α1. (2006) and Lin et α1. (2007) are referenced to measure the OIM.
IOrderBuy-OrderSelll
OIM
= 。γderBuy+OγderSell 、‘,' , •• EA rs-、where
“
OrderBuy" is the buying quantity and “OrderSelf' 的 the selling quantity. The numerator is the absolute value of the difference between the two sides. Aktas, Bodt, Declerck and Oppens (2007) noted 也at the informed trading probability (PIN=_l些一-
), demonstrated by Easley,K.iefc缸
',
O'H缸a
何L+2&
and Paperman (1996b)
,
is an approximate measure of orders imbalanceE(lB-SI)
( -_ ;-=.
~~). When there is information asymme仕y, better-informed 仕aders E(B+S)can manipulate the market price to move it up or down, so the market may
Chiao Da Management Review Vol. 34 No.1, 2014 89
exhibit positive or negative order imbalance. Therefore, although this method can measure the degree of order imbalance
,
it can not measure the imbalances that result 企ombuy orders or sell orders.(2) Considering the Direction
This method removes the absolute value of the numerator 企om equation (1). If the ratio is greater than 0
,
the market is defined as a buying order imbalance,
otherwise it is defined as a selling order imbalance.OrdeγBuy-OγdeγSell
OIM
=OrdeγBuy+OγdeγSell (2)
After calculating the OIM' for various types of investors during each 30-rnin trading interval in different transparent markets, a paired-samples t test is used to deterrnine the differences in order imbalance between the pre﹒仕ansparent
period and the post-transparent period. 2.2.2 Herding
It must also be deterrnined whether the change in order imbalance and investors' behavioral biases are related. When there is greater information disc1ose
,
investors can more c1early observe the trading trends of other traders,
so they may abandon their own judgment and follow the lead of others, which can result in a serious order imbalance.
(1) Herding Strength
The herding strength is defined with reference to Liu (2006), but the method is amended. This indicator is mainly divided into "buyer herding strength" and "seller herding strength"
,
depending on the 仕ading direction. The former is the percentage of buy orders divided by total orders as the market gathers more buyers. The latter is the percentage of sell orders divided by total orders as the market gathers more sellers.“
the market gathers more buyers" is set as an OIM' larger than 0.4, that is, more than 70% of orders in the market are buy orders and less than 30% of orders are sell orders.(2) The Relationship between the Order Imbalance of Individual Investors and Institutional Investors
90 The Relationship between Pre-trade Tran司parency,
Order 1mbalance and lnvestors ' Behavioral Biases
This section discusses the interaction between individual investors and institutional investors in directional order imbalance. It is determined whether individual investors follow institutional investors and which type of institutional investors they are more likely to follow. The dependent variable is the current order imbalance of individual investors and the independent variable is the lagged order imbalance of institutional investors (lag 1). The panel data model and the quantile regression model are used.
a.Panel Data Model
This method is used in order to simultaneously take into account the characteristics of time series and cross sectional analysis. The time series data includes 169 days and 1,521 in仕adayintervals. The cross sectional data includes
200 日rms. Therefore, the daily and in仕aday analyses contain 33
,800 and
304,200 observations, respectively.lndividualit = 戶。+戶'1T+ 戶2Domestici,t一 1+ 戶3T x Domestici,t_1
+戶'4Foreigni,t-1 + 戶sT x Foγeigni,t-1 (3)
In terms of daily analysis (Model 1), “Individualit" is the average OIM' for individual investors on day, t . “T" is the dummy variable for transparency. It
is assigned a value of 1 if the observations are during the “post-甘ansparent period'\ “Domestici.t_1" and “Foreigni.t_1" represent the OIM' on day t-l
for domestic institutional investors and foreign institutional investors, respectively.
“
T x Domestici.t一 1" and“
T x Foreigni.t_1" represents thecross multiplied items of the 仕ansparency dummy variable and the OIM' for institutional investors. These multiplied items determine whether the OIM' for institutional investors significant1y inf1uences that for individual investors when there is greater transparency. “ Rmt一 1" is the market index, and it is the
con仕01 variable. In addition, the panel data model can be divided into a fixed effects model and a random effects model. The Hausman test, proposed by Hausman(1978), is used to determine which model can be used. The fixed effects mode is used if the test statistic, H, is larger than the critical value; otherwise the random effects model is used.
Chiao Da Management Review Vol. 34 No.1, 2014 91
H
= cßfixed - ßrandom) [Var(ßfixed) -Var(ßrandom)r
1
C戶fixed 一
Frmdom)~X2 (4)
In tenns of intraday analysis (Model 2),“Indi叫dua1it" is the average OIM' for individual investors in the interval, t. The remainders of the symbols are similar to those above. Models 1 and 2 inc1ude 刃, 800and 304
,
200 observations,
respectively.
b. Quantile Regression Model
The quantile regression model is used to determine whether there are obvious relationships between the OIM' for institutional investors and that for individual investors when there is a large order imbalance. This method was first proposed by Koenker and Bassett (1978) and it addresses the shortcomings of the ordinary least squares method (OLS), which only considers the median. Quantile regression provides estimates of the linear relationships between regressors and a specified quantile of the dependent variable. Since this approach does not require strong dis仕ibutional assumptions, it offers a robust method of modeling these relationships.
2.2.3 Overconfidence
Investors may increase confidence because they have a better understanding of a market that has greater transparency. Several measures are used to observe this phenomenon.
(1) Inverse Operative Strength
Unlike herding, overconfidence occurs when investors trust their own ability excessively. Therefore, if investors have the courage to buy stocks when most people sell stocks
,
this shows that they sti1l trust their own judgment,
although their views are contra可 to those of the market. As cited in Liu (2006)
,
the inverse operative s仕ength is the percentage of buy orders divided by total orders as the market gathers more sellers.
“The market gathered more sellers"
is set as an OIM' that is smaller than -0.4. That is, more than 70% of orders in the market are sell orders and less than 30% ofthe orders are buy orders.92 The Relationship between Pre-trade Trα nsparency,
Order 1mbalance and lnvestors' Behavioral Biases
Except for the inverse operative s仕ength, many studies have shown that overconfident investors tend to engage in more aggressive trading (e.g., Benos,
1998; Odean
,
1998; Barber and Odean,
2001; Hirshleifer and Luo,
2002). This may manifest itself in several ways, such as increased trading volume, frequent trading, or an order price that is superior to others, in order to fight for the仕ansaction. In view of this
,
other measures,
such as order s仕ength, the percentages of order quantity and order numbers are considered.(2) Order Strength
Unlike Ma et al. (2008), who divided the order aggressiveness into six categories
,
according to order price,
the method of Lee (2005),
which takes into account the price and quanti可 simultaneously, is used in this section.一 ~n
Qft
' J (pÆ-pt-l)
Buy Order Strength = Li~l 三冒× 卅
' ltL ' t - l
~n
Qft
.., (Pt-l-P~)Sell Order Strength = Li~1 可京×
】 ι .L
QfL
Pt-
1Order Strength = (Buy Order Strength
+
Sell Order Strength) /2
(5)
(6)
(7)
where
“
Pt'"
- l " is the transaction price at time t-l ,“Pi~" and “Pi~" are the buyorder price and sell order price at time t
,
respectively,“QE"and “Q~t" are the buy order quantity and sell order quanti可 at time t,
respectively,“
QE"and“Q~l" are the total buy order quantity and the total sell order quanti可 between time t-1 and t
,
respectively and“
n" represents the total order numbers within each matching period. Therefore, this method uses order quantity as a weight to measure the order strength. When investors want to trade more actively,
the order buying price is increased or the order selling price is decreased,
so the larger order strength in equation (7) represents investors becoming more aggressive. Un1ike Lee (2005), the measures used in this study must be standardized, because some stocks have higher prices and the others have lower prices. Therefore, for the items on the right of equ剖ions (5) and (6), the difference between the order price and transaction price is divided by the transaction price at time t-1.Chiao Da Management Review Vol. 34 No.1, 2014 93
(3) The Percentages of Order Quantity and Order Numbers
Similar to the methods of Ma et al. (2008)
,
this study observes investors' order aggressiveness purely according to order quantity and order numbers. The percentage of the order quantity is the order quantity for a specific 可pe of investors (such as foreign institutional investors) divided by the total order quantity for all investors. Similarly,
the percentage of order numbers replaces order quantity with order numbers. Higher percentages of these two measures indicate that the degree of investo時, participation in the market is greater. The average order size is the total order quantity divided by the total order numbers.43. Analysis of Results
The results for order imbalance
,
herding and overconfidence are presented as follows.3.1 Order Imbalance
Panels A and B of Table 1 list the OIM at each 30-min 仕ading interval for different types of investors during the two transparent periods. Before increased transparency (pre-transparent period), the table shows that the OIM for individual investors lies roughly between 19.27%-30.88%, the OIM for institutional investors lies roughly between 51.47%-57.56% and the OIM for domestic and foreign institutional investors lies between 51.57%-59.62% and 55.4%-58.19%, respectively. After increased transparency (post-transparent period), the table shows that the OIM for individual investors lies roughly between 19.65%~32.3%, the OIM for institutional investors lies roughly between 48 .42%~53.54% and the OIM of domestic and foreign institutional investors lies between 50 .3 %~58.96% and 48.59%~55.67%, respectively. On the whole, the volatility of the OIM for individual investors is higher than that
4 Ma et al. (2008) only observed the percentage of the order quanti旬,but bo也 thepercentages
of order quantity and order numbers are observed in this research. Additionally, the samples,
94 The Relationship between Pre-trade Transparency,
Order 1mbalance and lnvestors' Behavioral Biases
for institutional investors. Similarly
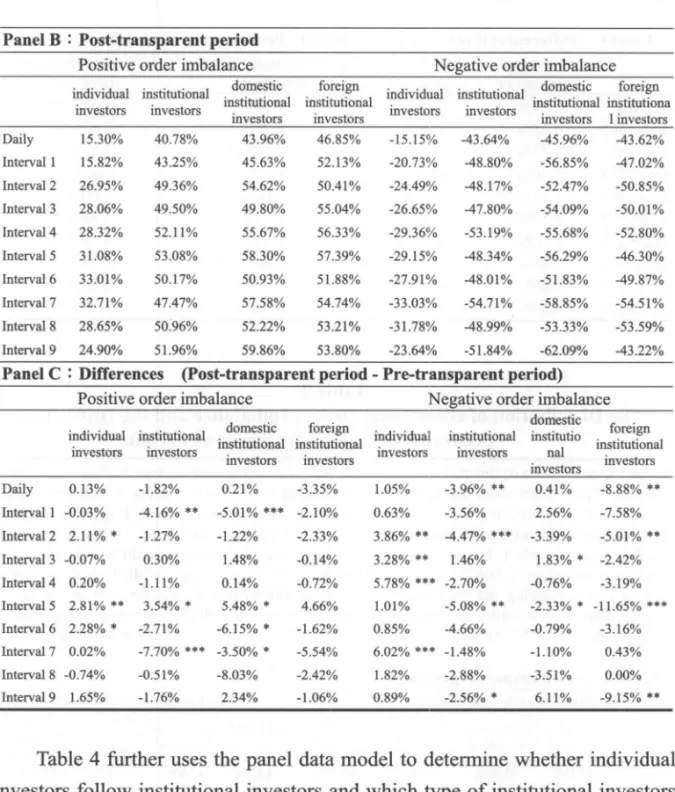
,
Panels A and B of Table 2 list the OIM' (including positive order imbalance and negative order imbalance) at each 30-min trading interval for different 可pes of investors during the two transparent periods. The dis仕ibution of the OIM' is roughly the same as that shown in Table 1, but the volatility of the OIM' for individual investors is higher.Figure 1 and Panels A and B of Table 1 show that the OIM for individual investors exhibits a U -shaped intraday pattem
,
but that for institutional investors is more irregular but has a W-shaped pa悅m. It is inferred that individual investors have not received enough information in Interval 1, so they do not make the same decisions and rush to trade at the same time. As time passes the more information they have, the greater is the order imbalance, especially inInterval 6 (11 :30-12:00) and Interval 7 (12:00-12:30). As for institutional investors
,
the W-shaped pa前em supports the arguments of Foster and Viswanathan (1994, 1996) and Cao and Wi1lard (2000), who stated that informed traders make active 仕ades early to avoid losing their information advantage and then they tend to conceal or delay their trading strategies, in order to prevent other informed traders 台om becoming aware of their monopolized information,的 the common private information is released gradually. At the last minute, they use all of their monopolized information.5 Therefore, if institutional investors are the informed traders, they may engage in active trading at the open and close of trading, which results in a serious order imbalance. In addition,
if they follow stealthy 仕ading s仕ategies to protect information by splitting orders in the middle trading intervals, the order imbalance may also become more serious. This may explain the several peak points of the W-shaped pattem.Figure 1 also shows that the peak points of the W-shaped pattem move forward when there is increased 仕ansparency. For example
,
during thepre﹒仕ansp缸entperiod, the highest point of the OIM for institutional investors is in Interval 7 and the second highest is in Interval 9
,
but the highest point movesChiao Da Management Review Vol. 34 No.l, 2014 95
forward to Interval 4 and the second moves forward to Interval 7 during the post-仕ansparent period. According to Lin (2014), these phenomena may be caused by institutional investors concealing their real motives, in order to avoid inforrnation leaks in a 仕ansparentmarket.
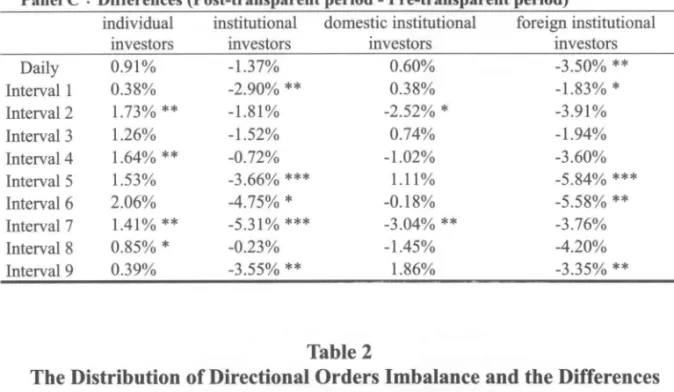
Panel C of Tables 1 and 2 shows the differences in order imbalance and the results of a paired-samples t test for the two transparent periods. In daily analysis, the order imbalances for individual and institutional investors have no significant changes in OIM or OIM'. However, the negative 0品l' for institutional investors decreases
,
especially for foreign institutional investors. In terrns of intraday analysis,
it is found that the OIM' for individual investors increases in a 仕ansparent market,
particularly in Intervals 2,
4,
7 and 8. The positive OIM' for individual investors is most si伊ificantin Interval 5, followed by Intervals 2 and 6. However, the negative OIM' for individual investors increases in the middle intraday intervals, when there is greater transparency,but that for institutional investors decreases
,
especially in the opening and rniddle intraday intervals. The positive OIM' for institutional investors increases in Interval 5 and the negative OIM' for domestic institutional investors also increases in Interval 3. It is thought that this phenomenon may result from order splitting during stealth trading. On the whole,
Figure 1 and Tables 1 and 2 show that the order imbalance for individual investors increases,
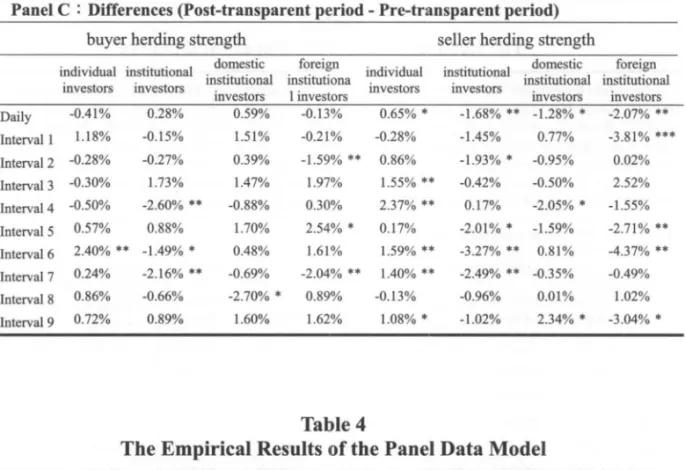
but that for institutional investors decreases.3.2 Herding
Table 3 lists the herding strength and the results of a paired-samples t test forthe two 仕ansparent periods. Table 3 shows that the herding strength of individual investors increases when there is greater 仕ansparency, especially seller herding strength. This phenomenon is consistent with the results shown in Table 2, where the negative OIM' is seen to significantly increase in a transparent market. This may be because individual investors receive a lot of inforrnation in a more transparent market, and they prefer to follow other people's views when they realize that they lack capability. This behavior is relatively safe for the individual investors who are averse to high risk, because they are particularly concemed about losses when most people sell. The herding
96 The Relationship between Pre-trade Transparency, Order 1mbalance and lnvestors ' Behavioral Biases
strength of institutional investors decreases, especially for foreign institutional
mvestors.
Table 1
The Distribution of Orders Imbalance and the Differences between the Various Transparent Periods
Table 1 lists the ratio of orders imbalance (OIM) at each 30-min trading interval for di宜erent
types of investors during the two 仕ansparentperiods. The Panels A and B represent the ratio
that the numerator is the absolute value of the difference between buying quantity and sell
quantity, and 也edenominator is 也etotal order quantity for the specific trading intervals. This
table also lists the di宜erences between the various periods in OIM for the given 仕'ading
intervals. The differences of OIM in Panel C represent the average of OIM on the specific 甘adinginterval during the post-tr祖sparencyperiod, minus 也atduring the pre企組sp訂ency
period. ***/**戶 indicatessignificance at 也e1 %/5%/10% level using a paired-samples t-test.
Panel A : Pre-transparent period
Individual institutional domestic institutional foreign institutional
mvestors mvestors mvestors mvestors
Daily 15.12% 49.06% 45.97% 51.79% Intervall 19.27% 53.67% 53.75% 55.65% Interva12 23.73% 51.85% 54.95% 57.46% Interva13 26.03% 52.03% 51.57% 55.84% Interva14 27.54% 54.26% 55.97% 58.19% Interva15 28.73% 54.28% 55.36% 56.42% Interva16 29.49% 53.17% 52.48% 55.40% Interva17 30.88令台 57.56% 59.62% 57.43% Interva18 29.77% 51.47% 53.75% 56.04% Interva19 23.93% 55.04% 57.10% 56.14%
Panel B : Post-transparent period
Individual institutional domestic institutional foreign institutional
mvestors mvestors mvestors mvestors
Daily 16.04% 47.69% 46.57% 48.29% Intervall 19.65% 50.77% 54.13% 53.82% Interva12 25.46% 50.04% 52.43% 53.55% Interva13 27.28% 50.50% 52.31% 53.90% Interval4 29.18% 53.54% 54.95% 54.59% Interva15 30.26% 50.62% 56.48% 50.59% Interva16 31.55% 48.42% 52.30% 49.82% Interva17 32.30% 52.25% 56.59% 53.67% Interva18 30.62% 51.24% 52.30% 51.84% Interva19 24.32% 51.49% 58.96% 52.79%
Chiao Da Management Review Vol. 34 No.l, 2014 97
Panel C : Differences (Post-transparent period - Pre-transparent period)
individual institutional domestic institutional foreign institutional
mvestors mvestors mvestors mvestors
Daily 0.91% -1.37% 0.60% -3.50% 艸 lntervall 0.38% -2.90% 艸 0.38% -1.83% * lnterva12 1. 73% 抖 -1.81% -2.52% * -3.91% Interval3 1.26% -1.52% 0.74% -1.94% Interval4 1. 64% 艸 -0.72% -1.02% -3.60% Interval5 1.53% -3.66% *** 1.11% -5.84% *** Interval6 2.06% -4.75% * -0.18% -5.58% 料 Interva17 1.41% 抖 -5.31 % *** -3.04% 艸 -3.76% Interval8 0.85% * -0.23% -1.45% -4.20% Interval9 0.39% -3.55% 料 1.86% -3.35% 抖 Table 2
The Distribution of Directional Orders Imbalance and the Differences between the Various Transparent Periods
Table 2 lists the ratio of directional orders imbalance (OIM') at each 30-min trading interval for different types of investors during the two transparent periods. The Panels A and B represent the ratio that the numerator is the difference between buying qu組討tyand sel1 quanti旬, andthe denominator is the total order quantity for the specific 仕adingintervals. The other instructions are the same as Table 1. However, for the consistent interpretation, it should be noted that the difference of negative OIM' is calculated by the average of negative OIM' on the specific 甘ading interval during the pre-仕ansp也rency period, minus 也at during the post-仕ansparency period, thus if 也is value is positive represent the negative OIM' increases with greater transparency. ***/**/* indicates significance at the 1%/5%110仇 levelusing a paired-samples t-test.
Panel A : Pre-transparent period
Positive order imbalance Negative order imbalance domestic foreign
individual institutional. 。
institutional institutional individual institutional domestic foreign tnvestors tnvestors tnvestors tnvestors tnvestors tnvestors institutional tnvestors institutional tnvestors Daily 15.18% 42.60% 43.75% 50.19% -14.10% -47.60% -45.55% -52.50% Intervall 15.85% 47.41 % 50.64% 54.22% -20.10% -52.36% -54.29% -54.60% Interval2 24.84% 50.63% 55.85% 52.74% -20.63% -52.64% -55.85% -55.86% Interval3 28.13% 49.20% 48.32% 55.17% -23.37% -46.34% -52.26% -52.42% Interval4 28.12% 53.22% 55.54% 57.05% -23.58% -55.89% -56.45% -55.99% Interval5 28.27% 49.54% 52.82% 52.73% -28.14% -53.41% -58.62% -57.95% Interval6 30.73% 52.88% 57.08% 53.50% -27.06% -52.67% -52.62% -53.03% lnterval7 32.70% 55.16% 61.08% 60.28% -27.01% -56.19% -59.96% -54.08% Interval8 29.40% 51.47% 60.26% 55.63% -29.97% -51.87% -56.85% -53.59% Interval9 23.25% 53.72% 57.52% 54.85% -22.75% -54.39% -55.97% -52.36%
98
Panel B : Post-transparent period
The Relationship between Pre-trade Transparen旬,
Order 1mbalance and lnvestors' Behavioral Biases
Positive order imbalance Negative order imbalance
individual institutional domestic f~reign individual institutional domestic forei~ institutional institutional ~~ ..~~~, ~'O'''~''V~"' institutional institutiona investors investors ~o...v...., ,
..o...v.."'
investors investorsinvestors investors investors 1 investors Daily 15.30% 40.78% 43.96% 46.85% -15.15% -43.64% -45.96% -43.62% lnterval1 15.82% 43.25% 45.63% 52.13% -20.73% -48.80% -56.85% -47.02% I且terva12 26.95% 49.36% 54.62% 50.41% -24.49% -48.17% -52.47% -50.85% lnterval3 28.06% 49.50% 49.80% 55.04% -26.65% -47.80% -54.09% -50.01 % lnterval4 28.32% 52.11% 55.67% 56.33% -29.36% -53.19% -55.68% -52.80% Interval 5 31.08% 53.08% 58.30% 57.39% -29.15% -48.34% -56.29% -46.30% lnterval6 33.01% 50.17% 50.93% 51.88% -27.91% -48.01% -51.83% -49.87% lnterval7 32.71% 47.47% 57.58% 54.74% -33.03% -54.71% -58.85% -54.51% lnterval 8 28.65% 50.96% 52.22% 53.21% -31.78% -48.99% -53.33% -53.59% Interval9 24.90% 51.96% 59.86% 53.80% -23.64% -51.84% -62.09% -43.22% Panel C : Differences (post-transparent period - Pre-transparent period)
Positive order imbalance Negative order imbalance
domestic
individual institutional domestic foreign. individual institutional ins缸"mfωelgn institu討onal institutio咀al _.._. _...._- --_._._--.. - institutional
mvestors mvest刀的 mvestors mvesωrs nal
mv唾stors investors investors
Investors Dai1y 0.13% -1.82% 0.21% -3.35% 1.05% -3.96% 抖。 41% -8.88% 抖 lnterval1 -0.03% -4.16% ** -5.01% *** -2.10% 0.63% -3.56% 2.56% -7.58% lnterval2 2.11%* -1.27% lnterval 3 -0.07% 0.30% lnterval4 0.20% -1.11 % -1.22% 1.48% 0.14% -2.33% 3.86% ** -4.47% *** -3.39% -5.01% 軸 心.1 4% 3.28% ** 1.46% 1.83% * -2.42% -0.72% 5.78% *** -2.70% -0.76% -3.19% lnterval5 2.81% 抖 3.54%* 5.48% * 4.66% 1.01% -5.08% ** -2.33% * -11.65% *** lnterval6 2.28% * -2.71% -6.15% * -1.62% 0.85% -4.66% -0.79% -3.16% I且terval7 0.02% lnterval8 -0.74% lnterval 9 1.65% -7.70% 抖* -3.50% * -0.51% -8.03% -1.76% 2.34% -5.54% -2.42% -1.06% 6.02% *叫-1. 48% 1.82% -2.88% 0.89% -2.56% * -1.10% -3.51% 6.11% 0.43% 0.00% -9.15% 帥
Table 4 further uses the panel data model to determine whether individual investors follow institutional investors and which 句pe of institutional investors that they are more likely to follow. This table also uses the quantile regression
model to determine whether there are obvious relationships between the OIM' for institutional investors and that for individual investors, when there is a greater order imbalance. It is found that the current order imbalance for individual investors is significantly a宜ected by the previous order imbalance for institutional investors and that the coefficient is negative. That is, individual investors buy stocks when institutional investors sell stocks and vice versa.
Chiao Da Management Review Vol. 34 No.1, 2014 99
Table 3
The Herding Strength for Buyers and SelIers
T Table 3 lists the herding s仕engthand the results of paired-samples t test during the two 甘ansparentperiods
訂e also listed. Herding strength is mainly divided into "buyer berding strength" and "sel1er berding strength", depending on the trading direction. The former is 伽 percentageof buy orders divided by total orders as the market gathers more buyers. The latter is the percentage of sel1 orders divided by total orders as the market gathers more sel1ers.“the market gathers more buyers" is set as an OIM larger than 0.4, that is, more 也an 70% of orders in the market are buy orders and less tban 30% of orders are sel1 orders. ***/**/* indicates significance at the 1 %/5%/10% level using a paired-samples t-test.
Panel A : Pre-transparent period
buyer herding strength seller herding s甘ength
individual institutional domestic foreign individual institutional domestic foreign institu位。nal insti個tional
1且vestors 1且vestors institutional institutional
mvestors mvestors investors investors E且vestors mvestors
Daily 的 30% 78.13% 78.65% 81.98% 67.92% 79.98% 81.45% 的 62% Interval 1 69.06% 的 58% 81.40% 82.64% 的 .63% 83.39% 82.66% 84.65% Interval 2 72.93% 81.60% 的 56% 85.91% 70.19% 83.02% 83.92% 的 27% Interval 3 74.03% 80.78% 81.87% 的 36% 71.69% 81.59% 83.18% 81.50% Interval4 74.39% 83.98% 83.50% 83.60% 71.38% 83.00% 85.20% 83.49% Interval 5 74.43% 82.38% 82.63% 83.00% 72.89% 84.34% 84.49% 84.63% Interval6 73.92% 82.44% 82.58% 82.46% 72.32% 83.41% 82.97% 84.97% Interval 7 74.96% 83.96% 85.15% 84.64% 73.04% 84.81% 83.99% 84.09% Interval 8 74.22% 82.76% 85.80% 的 73% 73.64% 83.05% 83.27% 84.04% Interval9 73.00% 82.75% 83.68% 83.55% 71.17% 的 .63% 82.34% 的 01%
Panel B : Post-transparent period
buyer herding strength seller herding s仕ength
individual institutional domestic foreign domestic foreign
to ona lnstIt1diorIal lEISHuttonal 1ndlVIdualmsbtubonal ti tIal E t 1 a l
mvestors I且vestors investors 且stttutJOnaJ mst1tuhon
mvestors investors investors mvestors mvestors
Daily 68.88% 78.41% 79.24% 81.85% 68.57% 78.29% 80.17% 81.55% Interval 1 70.25% 80.43% 82.91% 82.43% 69.35% 81.94% 83.43% 80.84% Interval2 72.65% 81.33% 83.95% 84.32% 71.05% 81.09% 82.98% 83.29% Interval3 73.73% 82.51% 83.34% 的 34% 73.23% 81.18% 82.68% 84.02% lnterval4 73.89% 81.38% 82.62% 83.90% 73.74% 83.17% 83.15% 81.94% lnterval5 75.00% 83.25% 84.33% 85.54% 73.06% 82.33% 82.90% 81.93% Interval6 76.33% 80.95% 的 .05% 84.07% 73.91% 80.14% 的 78% 80.60% Interval7 75.20% 81.80% 84.46% 82.60% 74.44% 82.31% 的 64% 83.60% lnterval8 75.08% 82.10% 的 10% 84.62% 73.50% 82.09% 的 28% 85.06% lnterval9 73.71% 的 65% 85.28% 85.16% 72.25% 82.61% 84.67% 81.96%
100 The Relationship between Pre-trade Transparen旬, Order 1mbalance and lnvestors ' Behavioral Biases
Panel C : Differences (post-transparent period - Pre-transparent period) buyer herding strength seller herding strength
individual institutional domestic foreign individual mstitutiona自 domestic foreign mOlv\Oual msmunonal institu位onal institutTona mOlv\Oua ;;;~.;;;~;~_. institutional institutional
mvestors mvestors investors 1 investors mvestors mvestors mve唱tors
Daily -0.41 % 0.28% 0.59% -0.13% 0.65%
*
-1.68%**
-1.28%*
-2.07%**
lntervall 1.18% -0.15% 1.51% -0.21% -0.28% -1.45% 。 77% -3.81%**
*
lnterval 2 -0.28% -0.27% 0.39% -1.59%**
0.86% -1.93%*
-0.95% 0.02% 1n terval 3 -0.3 0% 1.73% 1.47% 1.97% 1. 55%抖 -0.42% -0.50% 2.52% Interval 4 -0.50% -2.60%**
-0.88% 0.30% 2.37%抖 0.17% -2.05%*
-1.55% Interval5 。.57% 。.88% 1.70% 2.54%*
0.17% -2.01%*
-1.59% -2.71%**
lnterval6 2.40%**
-1.49%*
0.48% 1.61% 1. 59%抖 -3.27%**
0.81% -4 .37%抖 lnterval7 0.24% -2.16%抖 -0.69% -2.04%**
1.40%抖 -2.49%**
-0.35% 。 49% lnterva18 0.86% -0.66% -2.70%*
0.89% 。 13% -0.96% 0.01% 1.02% lnterval9 。 72% 0.89% 1.60% 1.62% 1.08%*
-1.02% 2.34%*
-3.04%*
Table 4The Empirical Results of the Panel Data Model
Table 4 displays the empirical results of the panel data model. This model simultaneously takes into account the characteristics of time series and cross 臼ctionalanalysis. The time series data includes 169 days and 1,521 in仕aday intervals. The cross sectional data includes 200 fmns. Hence, the daily and intraday analyses contain 33,800 and 304,200 observations, respectively.
“Individual一it" is the average OIM of individual investors in the day t . “T" is the dummy variable of 甘ansp訂'ency,組dit is assigned the value of 1 if the observations are during the “post-transparent period" . “Domestic_(i,t-l)" and “Foreign_(i,t-l)" represent 也e OIM in day t-l for domestic institutional investors and foreign institutional investors, respectively. “Rm一(t-l)" is the market index, and it is arranged 扭曲e control variable.
***/帥/* indicates significance at 也e 1%/5%/10悅 levelusing t-test. In addition, the panel data model can be divided into the ftxed effects model and the random effects model. The Hausman
tE哎,proposed by Hausman(l978), is used to determine which model can be used.
Model1 (daily) Model2 (In甘aday)
coefficient t value coe伍cient t value constant 1.4393
*
1.6979 5.6446**
*
8.3718 T -0.0100 -0.4759 -0.0160 -0.8145 domestict-l -0.0890***
-5.0868 -0.0733***
-6.5933 Txdomestict.1 0.0279 1.1565 0.0206 1.3465 foreignt.I -0.0995***
-6.5972 -0.1534***
-13.0453 Txforeignt-l -0.0457***
2.6435 -0.0419**
2.1132 Rmt-l -l.5527***
-3.8884 -l.7723***
-5.8522 R-squared 0.2092 0.1852 Chi-Sq. Statistic 15.3665***
12.3634***
(Hausman Test)Chiao Da Management Review Vol. 34 No.l, 2014 101
Figure 1
The Intraday Patterns of Orders Imbalance during the Various
Transparent Periods OIM 40% individual investors OIM 65% institutional investors 35% 60% 30% 55% ', ', A ', ‘、 ‘、 、、 ‘、 A 、 ', ', ', 唔 唔 25% 50% 20% 15% 45% 10% 2 4 6 -咱‘- pre-酋祖sparent ---恥-post-酋anspar回t 40~也 9 interva 1 2 2 4 4 6 6 7 9 7 9 interva 1 -金- pre-transparenl
-.-
posl-tr血sparent OIM65% domestic institutional investors 65% OIM
foreign insti個世onalinvestors
60% 60% 55% 卒..A、-,"金、、島、 I l!" 可可'f!(- 昌、、呵, 、'fr- -i;. 55% .. ~ ~且 50% 50% 45% 45~也 40% 40% mterval 2 4 6 7 8 9 -_._..-- -_._..--6-_._..--. pre-transparenl -﹒回-posl-甘ansparent 2 4 6 7 9 咀世rval - .... - pre-tr阻sparent -﹒←-poSl-甘ansparent
Figure 1 is drawn according to Table 1. This figure exhibits the intraday pattems of orders imbalance
duri月 the various transparent periods. The horizontal 缸is includes nine intraday intervals and each interval covers 30 minutes.
More specifically, there is no obvious relationship between the OIM' for
domestic institutional investors and that for individual investors
,
but therelationship between the OIM' for foreign institutional investors and that for individual investors is significantly negative. This may be due to either capital
102 The Relationship between Pre-trade Transparency, Order 1mbalance and lnvestors' Behavioral Biases
or information. Foreign institutional investors have an advantage over individual investors, so regardless of whether the market is 仕ansparent,
individual investors only realize that it is time to buy stock when foreign institutional investors sell stock and make a profit, so many individual investors usually buy based on the highest price which results in a delay.
In Table 5 the order imbalance for individual investors is divided into four quantiles, at 0.2, 0.4, 0.6 and 0.8. The table shows that the negative relationship between the OIM' for domestic institutional investors and that for individual investors does not change for different quantiles of order imbalance. However
,
the negative relationship between the OIM' for foreign institutional investors and that for individual investors occurs in the higher quantiles
,
such as those at 0.6 and 0.8. This may be because foreign institutional investors have more funds and information than individual investors,
which causes individual investors to follow,
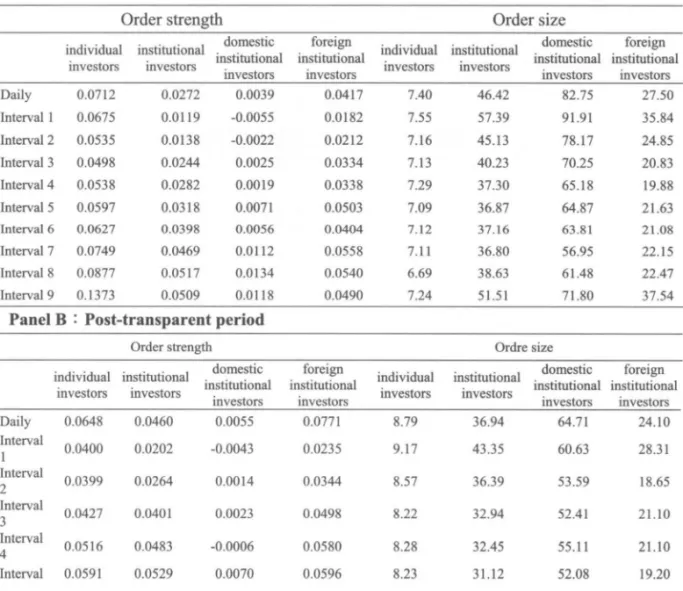
so they react to the order behavior when foreign institutional investors make large 仕ansactionsthat affect the volume and price in the market.3.3 Overconfidence
The inverse operative strength, order strength and the percentages of order quantity and order numbers are separately used to measure overconfident behavior. Table 6 lists the inverse operative strength and the results of a paired-samples t test for the two 仕ansparent periods. The inverse operative
s仕engthof individual investors decreases during the post-仕ansparent period. In general
,
the probability that individual investors follow the views of others because of uncertainty about investment decisions is relatively higher. Consistent with the herding behavior for individual investors in Table 3,
it is seen that most follow the 仕end in Table 6. In addition,
in terms of either daily analysis or in甘aday analysis,
the inverse operative strength of institutional investors increases significantly, especially for foreign institutional investors. The results show that institutional investors are more confident about their decisions because they have a better understanding of other people's willingness in a transparent market. Excessive 加st in their own judgment results in moreChiao Da Management Review Vol. 34 No.1, 2014 103
active transactions (Hirshleifer and Luo, 2002). This phenomenon is verified in
Figl汀e 2
,
Tables 7 and 8.6Table 5
The Empirical Results of the Quantile Re2ression Model
Table 5 utilizes the quantile regression model to explore whether there are obvious relationships
between the OIM of institutional investors and 也atfor individual investors under the greater order imbalance or not. The order imbalance for individual investors is divided into four mantiles, at 0.2, 0.4, 0.6 and 0.8. The other instructions are the same as Table 4.
Modell QR (0.2) QR (0.4) QR(0.6) QR(0.8)
(daily) coefficient tvalue coefficient t value coe征icient tvalue coefficient tvalue
cons位mt 0.0197 1.6233 0.0149 * -1.7689 -0.0091 0.7712 0.0241 * 1.8538 T -0.0313 * -1.8274 -0.0149 -1.0041 -0.0091 -0.6199 0.0253 1.1199 domestic叫 -0.1234 *** -4.2766 -0.0636 *** -3.0230 -0.1083 *** -4.6652 -0.1788 *** -8.7394 TXdomestic'.l 0.0603 * 1.7412 0.0109 0.3268 0.0768 0.6152 -0.1008 -1.1500 foreign'.l -0.1235 *** -4.3534 -0.1097 *** 明 7.1510 -0.1086 *** -5.9692 -0.1326 *** -7.1901 Txforeign叫 -0.0247 -0.6807 -0.0435 * -1.6599 -0.0600 ** -2.2372 -0.0604 ** -2.1757 Rm'.l -0.0146 ** -2.4313 -0.0842 *** -3.1134 -0.0151 *** -2.7972 -0.0190 *** -3.5414 R-squared 。 2017 。 2263 0.1750 。 1651 Mode12 QR (0.2) QR (0.4) QR(0.6) QR (0.8)
(In仕aday) coefficient tvalue coefficient t value coe佐icient t value coefficient t value
consta且t 0.2078 *** 3.2052 0.0397 *** 4.7539 0.1196 *** 2.9088 0.4812 *** 5.2761 T -0.0564 -1.5397 -0.0182 -1.1454 -0.0397 -1.2066 -0.0452 -1.4164 domestic'.l 呵0.0933 *** -6.2739 -0.0892 *** -6.5277 -0.0905 *** -5.4219 -0.0488 ** -2.2815 Txdomestic'.l 0.0567 1.5680 0.0533 1.1788 0.0373 * 1. 7271 0.0200 0.6919 foreign'.l -0.1777 *** -11.6997 -0.1725 *** -11.8559 -0.2031 *** -12.4113 -0.1893 *** -8.0207 Txforeign'.l -0.0187 -0.8976 -0.0325 -1.5737 -0.0131 ** -2.2598 -0.0502 * -1.7590 Rm'.l -0.0111 *** -2.9469 -0.0244 *** -6.1268 -0.0314 *** -7.7796 -0.0222 *** -3.2153 R-squared 0.1095 0.1099 0.1132 0.1024
6 The empirical result that institutional investors become more aggressive when there is greater
個nsparency is consistent with the fmdings of Ma, et al. (2008). However, the samples,
104 The Relationship between Pre-tl旬de Transparency,
Order 1mbalance and lnvestors ' Behavioral Biases
Table 6
The Inverse Operative Strength
Table 6 lists the inverse operative s仕engthand the res叫tsof paired-samples t test during the two transp訂ent periods. The inverse operative strength is 也e percentage of buy orders divided by total orders as 也e market gathers more sellers. “The market gathered more sellers"is set as 組 OIM 也atis smaller 也an-0.4. That is, more 也an70% of orders in 也e
market are sell orders and less th組 30%of the orders are buy orders. The differences of the inverse operative streng也 inPanel C represent the average of inverse operative strength on
也e specific trading interval during the post-transp訂.ency period, minus 也at during 也e pre-tr.祖sparency period. ***/料/* indicates significance at the 1 %/5%/10% level using a paired-samples t-test
Panel A : Pre-transparent period
individual institutional domestic foreign
mvestors investors institutional institutional
mvestors investors Daily 32.14% 19.86% 18.25% 16.18% Intervall 30.26% 16.70% 17.45% 14.35% Interva12 29.78% 17.08% 16.78% 16.73% Interva13 28.05% 17.94% 16.23% 17.00% Interva14 28.38% 16.88% 15.20% 16.06% Interva15 26.96% 15.52% 15.06% 15.94% Interva16 27.22% 16.34% 16.98% 15.83% Interva17 26.93% 15.13% 16.58% 15.87% Interva18 26.13% 16.22% 16.27% 15.90% Interva19 28.45% 16.49% 16.04% 14.54%
Panel B : Post-transparent period
individual insti仰自ional domestic foreign
mvestors investors institutional institutional
mvestors investors Daily 31.58% 23.06% 20.27% 18.92% Interval 1 30.73% 18.63% 16.36% 18.09% Interva12 28.92% 18.73% 16.59% 17.89% Interva13 26.72% 18.21 % 16.63% 15.45% Interva14 26.39% 16.27% 16.08% 17.56% Interva15 26.70% 17.75% 16.68% 18.50% Interva16 26.06% 19.63% 16.30% 18.97% Interva17 25.38% 17.09% 15.74% 16.67% Interva18 26.46% 18.13% 16.53% 13.61% Interva19 27.61% 17.09% 14.11% 19.03%
Panel C : Differences (post-transparent period - Pre-transparent period)
individual institutional domestic forei,伊
mvestors investors institutional institutional
mvestors investors
Daily -0.56% 3 .20% 抖 2.01% 抖 2.75% ***
Intervall 0.47% l.93% * -l.09% 3.74% **
Chiao Da Management Review Vol. 34 No.l, 2014 105 Interval3 -1.34% ** 0.27% 0.41% -1.56% Interval4 -1. 99% 抖 -0.60% 0.88% 1.50% Interval5 -0.25% 2.23% ** 1.62%
.
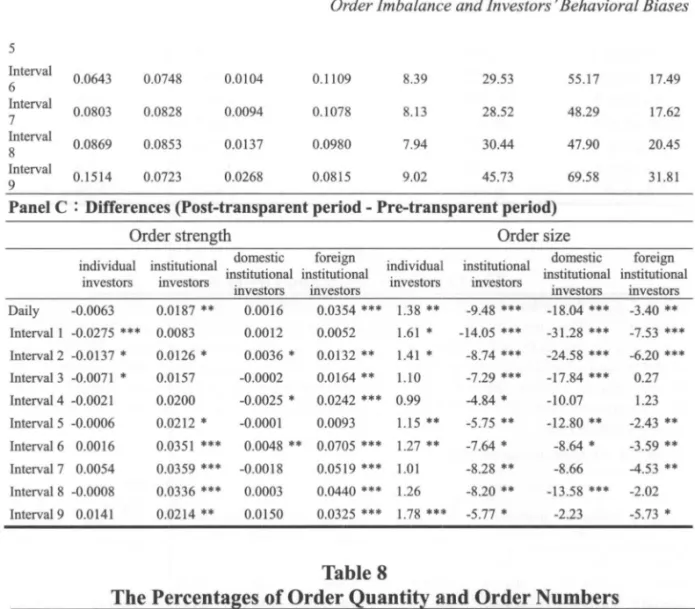
2.56% ** Interval6 -1.1 6% 抖 3.29% ** -0.68% 3.14% ** Interval7 -1.55% ** 1.95% -0.85% 0.80% Interval8 0.33% 1.90% 0.26% -2.29% Interval9 -0.84% * 0.61% -1.93% 4.49% ** Table 7The Order Stre鹽th and Order Size
Table 7 lists the order strength and order size for different types of investors by using the equation (7). The larger order strength indicates the more aggressive 仕ading. In addition, the average order size is the total order quantity divided by the total order numbers. The differences of order s甘engthand order size in Panel C represent the average of order strength and order size on the specific trading interval during the post-transp訂閱cy period, minus that during the pre﹒仕祖sparency period. *料/料/* indicates significance at the 1 %/5%/10% level using a paired-samples t-test.
Panel A : Pre-transparent period
Order strength Order size
domestic foreign ;_";,,;",,"' ;_o+;.. ,+;~_"' domestic foreign individual insti仙tional institutional ins討仙tIonal inedIVIdual institutIonal InstIMional mstiMbonal
mvestors mvestors investors investor百 Investors Investors InvestorsInvestors
Daily 。.0712 0.0272 0.0039 0.0417 7.40 46.42 82.75 27.50 Interva1 1 0.0675 0.0119 -0.0055 0.0182 7.55 57.39 91.91 35.84 Interval2 0.0535 0.0138 -0.0022 0.0212 7.16 45.13 78.17 24.85 Interval3 0.0498 0.0244 0.0025 0.0334 7.13 40.23 70.25 20.83 Interva14 0.0538 0.0282 0.0019 0.0338 7.29 37.30 65.18 19.88 Interva15 0.0597 0.0318 0.0071 0.0503 7.09 36.87 64.87 21.63 Interval6 0.0627 0.0398 0.0056 0.0404 7.12 37.16 63.81 21.08 Interval7 0.0749 。.0469 0.0112 0.0558 7.11 36.80 56.95 22.15 Interva18 0.0877 0.0517 0.0134 0.0540 6.69 38.63 61.48 22.47 Interval9 0.1373 0.0509 。.0118 0.0490 7.24 51.51 71.80 37.54
Panel B : Post-transparent period
Order strength Ordre size
individual institutional domestic foreign individual stitutional domestic foreig且
1且 IVloual msnrunonal institutional institutional
investors 1nto orla lnstitutIonal msututIonal
mvestors 且vestors
investors mveslOrs investors investors
mvestors Daily 0.0648 0.0460 。 0055 0.0771 8.79 36.94 64.71 24.10 Interval 0.0400 0.0202 -0.0043 0.0235 9.17 43.35 60.63 28.31 Interval 。.0399 0.0264 0.0014 0.0344 8.57 36.39 53.59 18.65 2 Interval 0.0427 0.0401 0.0023 0.0498 8.22 32.94 52.41 21.10 3 Interval 0.0516 0.0483 -0.0006 0.0580 8.28 32.45 55.11 21.10 4 lnterval 0.0591 0.0529 0.0070 0.0596 8.23 31.12 52.08 19.20
106 5 lnterval 6 lnterval 7 lntervaI g lnterval 9 0.0643 0.0803 0.0869 0.1514 0.0748 0.0104 0.0828 0.0094 0.0853 0.0137 。.0723 0.0268
The Relationship between P袍-trade Transparency,
Order 1mbalance and lnvestors ' Behavioral Biases
0.1109 8.39 29.53 55.17 17.49 0.1078 8.13 28.52 48.29 17.62 0.0980 7.94 30.44 47.90 20.45 0.0815 9.02 45.73 69.58 31.81 Panel C : Differences (post-transparent period - Pre-transparent period)
Order s仕ength Order size
domestic foreign individual institutional institutional institutional investors investors 1且vestors 且vestors individual lllvestors domestic fo叩ign lllS討仙tional institutional institutional mvestors Investors lllvestors Daily -0.0063 0.0187 ** 0.0016 0.0354 **. 1.38 ** -9.48... -18.04... -3.40 ** lntervall -0.0275.** 0.0083 0.0012 0.0052 1.61 • -14.05.** -31.28 **. -7.53 **. lntervaI 2 -0.0137 • 0.0126 • 0.0036 • 0.0132 ** 1.41. -8.74 **. -24.58 **. -6.20 艸* lnterva13 -0.0071 * 0.0157 -0.0002 0.0164 抖1.1 0 -7.29 **. -17.84.** 0.27 lnterva14 -0.0021 0.0200 -0.0025 • 0.0242 **. 0.99 -4.84 • -10.07 1.23 lnterval 5 -0.0006 I且terval6 0.0016 lnterval7 0.0054 Interval 8 -0.0008 Interval9 0.0141 0.0212 • -0.0001 0.0093 1.15 ** -5.75 ** -12.80 ** -2.43 ** 0.0351.** 0.0048 *. 0.0705 **. 1.27 ** -7.64 • -8.64 • -3.59 ** 0.0359 ••• -0.0018 0.0519 *** 1.01 -8.28 ** -8.66 -4.53 ** 。 0336*** 0.0003 0.0440 **. 1.26 -8.20 ** -13.58 **. -2.02 0.0214 ** 0.0150 0.0325 **. 1.78 **. -5.77. -2.23 -5.73 • Table 8
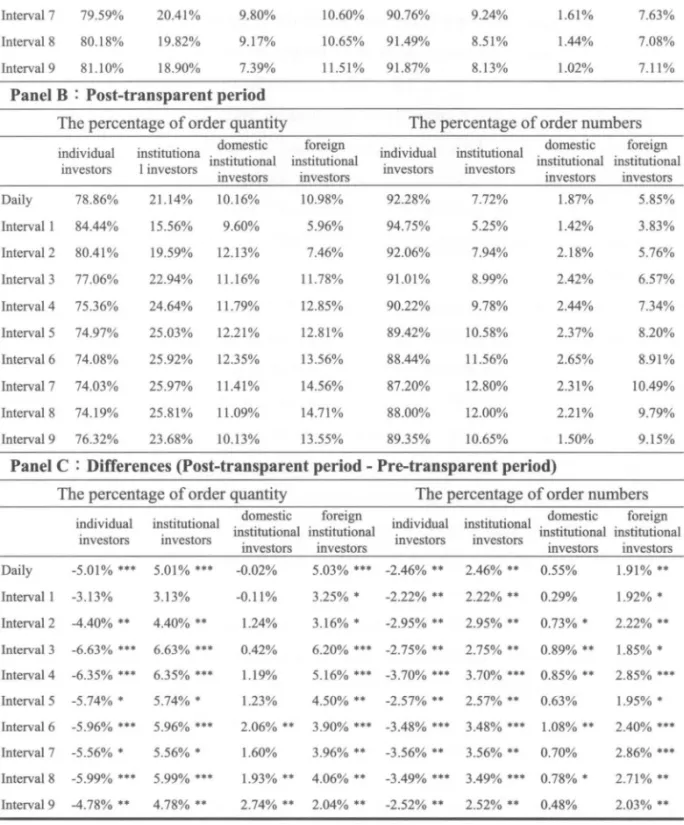
The Percenta~es of Order Quantity and Order Numbers
Table 8 lists the percentages of order quantity and order numbers for di宜erenttypes of investors. The percentage of order quantity is the order quantity for a specific type of investors (such as foreign institutional investors) divided by the total order quantity of all investors. Similarly,也epercentage of order numbers replaces order quantity with order numbers. The higher 也.epercentages of these two measures indicate 血的 thedegree of investors' participation in the market is higher. The difIerences of percentages in Panel C represent the average of percentages on the specific trading interval during the post-甘祖sparency period, minus that during the pre﹒甘甜sparencyperiod. .**/料/*indicates significance at 也e 1%/5%/10% level using a p直ired司samplest-test.
Panel A : Pre-transparent period
The percentage of order quantity The percentage of order numbers dividual institutiona1 domestic foreign . individual institutiona1 domestic foreign
1ll0lvl0ual msnrunonal institutional institutional mOlvlOual 1且Isnrunonal institutional institutional
mvestors lllvestors investors investors mvestors lllvestors investors investors Daily 83.87% 16.13% 10.18% 5.95% 94.75% 5.25% 1.32% 3.93% lnterval 1 87.58% 12.42% 9.72% 2.71% 96.96% 3.04% 1.13% 1.91% Interval2 84.81% 的 .19% 10.89% 4.30% 95.02% 4.98% 1.45% 3.53% lnterva13 83.69% 16.31% 10.73% 5.58% 93.76% 6.24% 1.53% 4.71% lntervaI4 81.71% 18.29% 10.60% 7.69% 93.92% 6.08% 1.58% 4.49% lnterva15 80.71% 19.29% 10.98% 8.31% 92.00% 8.00% 1.75% 6.26% lnterval6 80.04% 19.96% 10.30% 9.66% 91.92% 8.08% 1.57% 6.52%