VBM reveals brain volume differences between Parkinson’s
disease and essential tremor patients
Ching-Hung Lin1,2,3, Chun-Ming Chen4, Ming-Kuei Lu2,5,6, Chon-Haw Tsai2,5,6, Jin-Chern Chiou1,2, Jan-Ray
Liao4and Jeng-Ren Duann1,2,7,8*
1
Biomedical Engineering R&D Center, China Medical University, Taichung, Taiwan 2
Biomedical Electronics Translational Research Center, National Chiao Tung University, Hsinchu, Taiwan 3
Department of Psychology, Soochow University, Taipei, Taiwan
4Department of Electrical Engineering, National Chung Hsing University, Taichung, Taiwan
5Department of Neurology, China Medical University Hospital, Taichung, Taiwan
6
School of Medicine, Medical College, China Medical University, Taichung, Taiwan 7
School of Medicine, Graduate Institute of Clinical and Medical Science, China Medical University, Taichung, Taiwan 8
Institute for Neural Computation, University of California San Diego, La Jolla, CA, USA
Edited by:
John J. Foxe, Albert Einstein College of Medicine, USA
Reviewed by:
Bogdan Draganski, University Lausanne, Switzerland Pascal F. Durrenberger, Imperial College London, UK
*Correspondence:
Jeng-Ren Duann, Biomedical Engineering R&D Center, Graduate Institute of Clinical and Medical Science, China Medical University, 91 Hsueh-Shih Road, North District, Taichung 40447, Taiwan, R.O.C. e-mail: [email protected]
Symptoms of essential tremor (ET) are similar to those of Parkinson’s disease (PD) during their initial stages. Presently, there are few stable biomarkers available on a neuroanatomi-cal level for distinguishing between these two diseases. However, few investigations have directly compared the changes in brain volume and assessed the compensatory effects of a change in the parts of the brain associated with PD and with ET. To determine the com-pensatory and/or degenerative anatomical changes in the brains of PD and ET patients, the present study tested, via two voxel-based morphometry (VBM) approaches (Basic vs. DARTEL VBM processing), the anatomical brain images of 10 PD and 10 ET patients, as well as of 13 age-matched normal controls, obtained through a 3T magnetic resonance scanner. These findings indicate that PD and ET caused specific patterns of brain volume alterations in the brains examined. In addition, our observations also revealed compensatory effects, or self-reorganization, occurring in the thalamus and the middle temporal gyrus in the PD and ET patients, due perhaps in part to the enhanced thalamocortical sensorimotor inter-action and the head-eye position readjustment, respectively, in these PD and ET patients. Such a distinction may lend itself to use as a biomarker for differentiating between these two diseases.
Keywords: voxel-based morphometry, Parkinson’s disease, essential tremor, DARTEL VBM, basal ganglia, cerebel-lum, ventro-posterior-lateral thalamus, middle temporal gyrus
INTRODUCTION
Patients with Parkinson’s disease (PD) and essential tremor (ET) share some common symptoms (such as resting tremor) during their initial stages of illness. However, these two diseases involve different internal mechanisms and therefore require different
clin-ical treatments (Draganski and Bhatia, 2010;Watts et al., 2011).
Numerous studies have utilized brain imaging to probe alter-ations in the structural and functional organization of patients
with PD (Kassubek et al., 2002; Brenneis et al., 2003; Burton
et al., 2004;Price et al., 2004;Chebrolu et al., 2006;Beyer et al., 2007;Ramirez-Ruiz et al., 2007;Bouchard et al., 2008;Feldmann et al., 2008; Ibarretxe-Bilbao et al., 2008, 2009a, 2011a,b; Ben-ninger et al., 2009;Camicioli et al., 2009; Cardoso et al., 2009;
Jubault et al., 2009;Martin et al., 2009;Wattendorf et al., 2009;
Agosta et al., 2010a,b;Bruggemann et al., 2010;Hamasaki et al.,
Abbreviations: ACC, anterior cingulate cortex; BG, basal ganglia; BTC,
basal ganglia-thalamocortical circuit; CN, caudate nucleus; CTC, cerebello-thalamocortical; DLPFC, dorsolateral prefrontal cortex; ET, essential tremor; GP, globus pallidus; IN, insula; LN, lentiform nucleus; MFG, middle frontal gyrus; MTG, middle temporal gyrus; PD, Parkinson’s disease; PT, putamen; SN, substantia nigra; STG, superior temporal gyrus; STN, sub-thalamic nucleus; TPJ, temporo-parietal junction; VBM, voxel-based morphometry; VPL, ventral posterior lateral nucleus.
2010;Focke et al., 2011). Over the past decade, the voxel-based morphometry (VBM) technique has been applied often for study-ing brain volume changes in PD and other degenerative brain diseases. These studies have shown brain atrophy to exist in many cortical and subcortical regions, particularly in the basal gan-glia [BG, which contains five nuclei: the caudate nucleus (CN), the putamen (PT), the globus pallidus (GP), the sub-thalamic nucleus (STN), and the substantia nigra (SN)] within the PD
group (Gazzaniga et al., 2008;Mink, 2008;Dum and Strick, 2009;
Watts et al., 2011). However, these PD-VBM studies have not yet drawn any congruent conclusions (see Table S1 in Supplementary Material). It is worth noting that five PD-VBM studies have pin-pointed not only PD-related brain volume loss in certain brain
regions but also volume increase in certain other areas (Kassubek
et al., 2002;Reetz et al., 2009, 2010;Cerasa et al., 2011;Jubault et al., 2011). Among the brain areas that increased in volume are the frontal lobe, the temporo-parietal junction (TPJ), the pari-etal lobe, the insula (IN), the anterior cingulate cortex (ACC), the BG, and the thalamus, as has been reported in the literature. Nevertheless, few of these findings were wholly consistent with each other (see Table 1). Therefore, this issue of brain volume increases detected with VBM in PD groups will require further examination.
T able 1 | Summary of br ain v olume incr eased with VBM in P ar kinson’ s disease st udies. Chang ed Br ain Ar ea F rontal lobe P ar iet o-t empor o-occipital association cor tex P ar ietal lobe Insula Ant er ior cingulat e cor tex Basal g anglia Thalamus Resear c h Gr oup Kassubek et al. (20 02 ) V entralis intermedius (VIM) R eetz et al. (20 09 ) Right globus pallidus e xternus (sP ARKINMC) and right put amen (iPD) R eetz et al. (20 1 0 ) P arieto-temporo-occipit al association corte x (asymptomatic P arkin and A TP1 3A2 MC) Striat um (asymptomatic P arkin, PINK1, A TP1 3A2) Cerasa et al. (20 11 ) Bilateral inf erior front al gyr us (in dy skinetic patients) J ubault et al. (20 11 ) Right superior front al gyr us (surf ace area) Bilateral pariet al lobule (surf ace area) L ef t insular corte x (surf ace area) L ef t cingulate corte x (surf ace area)
On the other hand, relatively few investigations using a VBM technique have been conducted in order to identify volumetric
changes in brain structure associated with ET (Daniels et al., 2006;
Quattrone et al., 2008;Benito-Leon et al., 2009;Cerasa et al., 2009;
Bagepally et al., 2010). Moreover, the ET-VBM studies that have been conducted have not yet drawn any congruent conclusions (see Table 2).
In fact, the known movement disorders of PD and ET patients have largely been linked to the damage done to motor loops within
the central nervous system (Draganski and Bhatia, 2010; Watts
et al., 2011). Traditional motor-system studies have identified two motor programing circuits that are important for skill learning and for action modulation, namely, the basal ganglia-thalamocortical
(BTC) loop (Gazzaniga et al., 2008;Mink, 2008;Dum and Strick,
2009;Watts et al., 2011) and the cerebello-thalamocortical (CTC)
loop (Gazzaniga et al., 2008; Mauk and Thach, 2008;Dum and
Strick, 2009;Watts et al., 2011).
The BTC loop is linked mainly to the BG, the supplementary
motor area (SMA) (Ash et al., 2011), the thalamus, the prefrontal
cortex, and partially to the temporal cortex, the hippocampus, and a few occipital regions. This loop is activated largely by the inter-nal motivation, and is also involved in proficient motor behavior. On the other hand, the CTC pathway contains several cortico-subcortical regions, including the cerebellum, premotor cortex, thalamus, dorsolateral prefrontal cortex (DLPFC), and parietal cortex. The actions from the CTC loop regulate the movement system in the initial period of motor learning. This circuitry plays a critical role in conducting the actions guided by environmental
cues (i.e., external stimuli) (Gazzaniga et al., 2008;Mink, 2008;
Dum and Strick, 2009).
Previously, gray-matter volume changes in the BG and SN had
been reported to be significantly associated with PD (Mink, 2008;
Dum and Strick, 2009). Nevertheless, the manner in which the volumetric changes in the brain areas of the BTC loop relate to PD is still largely incoherent (see Table S1 in Supplementary Material). Although previous studies have revealed gray-matter volumetric
changes in the cerebellum and the thalamus (Quattrone et al.,
2008;Benito-Leon et al., 2009;Bagepally et al., 2010) in the ET patient’s brain, the manner in which volumetric changes in the brain areas along the CTC loop are associated with ET is still largely unknown (see Table 2).
As certain motor circuitries in the brains of PD and ET patients gradually degenerate, different motor control loops are likely to be utilized. Consequently, certain brain areas in these alternative pathways might then become more active, so as to compen-sate for the loss of function, and may thus increase in size. The present study, therefore, examines the neuroanatomical differences between the PD patients, the ET patients, and the age-matched normal control subjects using two VBM methods: the basic VBM and DARTEL (Diffeomorphic Anatomical Registration Through
Exponentiated Lie Algebra) VBM (Ashburner and Friston, 2000;
Ashburner, 2010) in SPM.
This study aims to compare the morphological changes of the brains between the three subject groups [namely, the PD, the ET, and the CT (normal control subjects)] and to confirm the morphometry results using two different VBM methods so as to
T able 2 | Summary of br ain v olume c hang e observ ed with VBM in Essential T remor St udies. Chang ed Br ain Ar ea F rontal lobe T empor al lobe P ar ietal lobe Limbic lobe Occipital lobe Insula Basal ganglia Thalamus Hippocampus P ons and medulla Cer ebellum Resear c h Gr oup Daniels et al. (20 06 ) X X X Right middle No consistent result Quat trone et al. (20 08 ) X V ermis B enito-L eon et al. (20 09 ) X Right X Bilateral X Right X Bilateral Cerasa et al. (20 09 ) X B agepally et al. (20 1 0 ) X Bilateral X L ef t middle X Right superior X Bilateral X X X
Table 3 | Demographic characteristics and clinical assessment scores in PD, ET, and healthy controls.
Group PD ET Control
Number of subjects 10 10 13
Age (year) 67.30 ± 8.77 63.40 ± 8.71 65.31 ± 11.09
Gender (male/female) 8M/2F 5M/5F 9M/4F
Disease duration (year) 2.85 ± 2.47 15.20 ± 7.91 –
UPDRS-I 2.90 ± 1.97 – –
UPDRS-II 8.00 ± 3.83 – –
UPDRS-III 22.50 ± 8.29 – –
H&Y stage 2.20 ± 0.26 – –
intention tremor score – 1.40 ± 0.52 –
2009). Here we hypothesized that the conjunctive regions revealed
by the two methods should be relatively stricter than that of any single method. Actually, the DARTEL VBM is based on the basic VBM but more precise in the preprocess procedure than in the basic VBM: first, the processing of DARTEL VBM uses an affine regularization with the East Asian brain template, which fits better the patient/subject populations in this study. Furthermore, during the spatial normalization step, the DARTEL VBM creates brain templates according to the anatomical images of specific subject groups, and then normalizes these templates with respect to the standard Montreal Neurological Institute (MNI) template (305
T1) (Talairach and Tournoux, 1988). This additional procedure of
the DARTEL VBM makes its spatial normalization more precise
than that of the basic VBM (Ashburner and Friston, 2000;
Ash-burner, 2010). In line with this, we have found more brain areas with significant volumetric morphometric differences using the DARTEL VBM method in this study.
More specifically, this study would like to test for any specific patterns of compensatory volumetric changes, more specifically of volume increase, as opposed to the atrophic effects indicated by the volume loss in the brain areas along the BTC and CTC pathways, each associated with different patient populations.
MATERIALS AND METHODS
SUBJECTS
The study recruited 33 subjects – 10 ET patients (five male and five female, mean age = 63.4 years; SD = 8.71 years), 10 PD patients (eight male and two female, mean age = 67.30; SD = 8.77), and 13 age-matched normal controls (nine male and four female, mean age = 65.31 years; SD = 11.09 years). The PD and ET patients were screened with standard clinical tests (PD: Unified Parkinson’s Disease Rating Scale (UPDRS); ET: Intention Tremor Score) by neurologists. The relative demographic characteristics of each group are listed in Table 3. Each subject gave informed consent before the MRI examination, the Institutional Ethics Committee of China Medical University Hospital approved the study (IRB No. DMR98-IRB-290), and the experiment was conducted according to the Declaration of Helsinki.
ACQUISITION OF MRI DATA
The MRI examinations were conducted using a quadrature head coil on a Signa HDx 3.0T MRI scanner (GE, Milwaukee,
WI, USA). During each MRI scan, a foam-rubber cushion was used for fixing the head of the subject in place, so as to minimize any voluntary head movement. In order to capture detailed anatomical information, a high-resolution T1-weighted image was utilized, using a 3-D gradient-echo pulse sequence, and a Modified Driven Equilibrium Fourier Transform (MDEFT) with the following imaging parameters: image matrix = 256 × 256; FOV = 224 mm × 224 mm; number of slices = 170; slice thickness = 1 mm; flip angle = 12° and TR/TE/TI (inversion time) = 7.372 ms/2.74 ms/650 ms.
DATA PROCESSING AND ANALYSIS
Statistical Parametric Mapping (SPM8) (Department of Cognitive
Neurology, London, UK) performed with (MATLAB 2010a, 2010)
(MathWorks, Boston, MA, USA), was utilized for preprocessing
and analyzing the MRI data. The statistical results were then presented using SPM8 and xjView 8.0 (Human Neuroimaging Lab, Baylor College of Medicine, Houston, TX, USA). Both basic and DARTEL VBM image-processing techniques, as described in the
literature (Ashburner and Friston, 2000;Good et al., 2001;
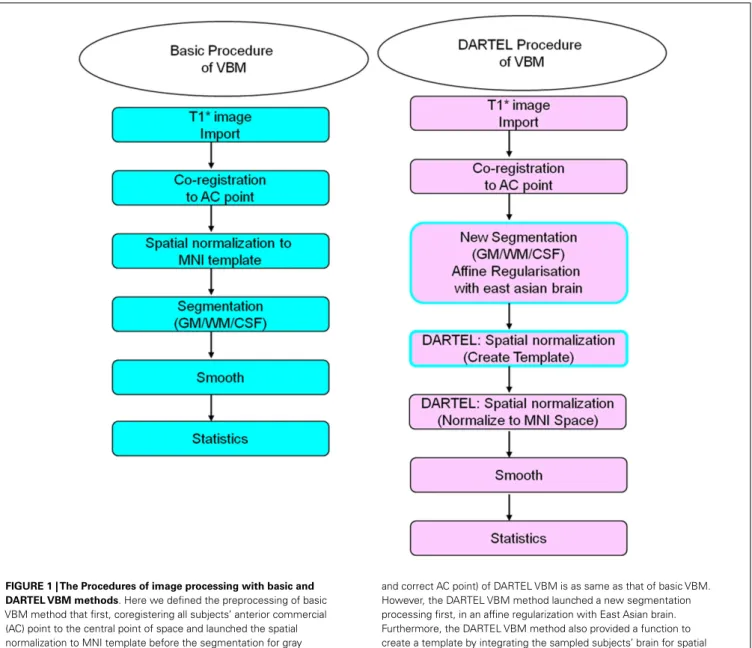
Ridg-way et al., 2008;Ashburner, 2010;Kurth et al., 2010), were adopted for evaluating differences in volumetric changes of various brain areas for the three subject groups. Figure 1 illustrates the flowchart for the two image-processing procedures.
Briefly, the anatomical MRI images were co-registered, nor-malized, and spatially smoothed using an 8-mm full-width-at-half-maximum (FWHM) Gaussian kernel in SPM8. The random effect model was adopted for the between-group analysis in order to compute any differences between the two population groups. Brain areas with significant volumetric differences were identified
FIGURE 1 | The Procedures of image processing with basic and DARTEL VBM methods. Here we defined the preprocessing of basic
VBM method that first, coregistering all subjects’ anterior commercial (AC) point to the central point of space and launched the spatial normalization to MNI template before the segmentation for gray matter, white matter, and cerebral spinal fluid. Finally, the 8 mm full-width-half-maximum (FWHM) was enrolled here for smoothing. On the other hand, the first two steps of preprocessing (T1*
image import
and correct AC point) of DARTEL VBM is as same as that of basic VBM. However, the DARTEL VBM method launched a new segmentation processing first, in an affine regularization with East Asian brain. Furthermore, the DARTEL VBM method also provided a function to create a template by integrating the sampled subjects’ brain for spatial normalization and finally normalized to the MNI template for position localization. The other image-processing step and statistical testing were similar to the basic VBM method.
using the statistical threshold of uncorrected P = 0.05, with spatial
extent K ≥ 30 voxels.Talairach and Tournoux’s (1988)3-D brain
stereotaxic system, with a MNI template (305 T1) in SPM8, and xjView 8 were used to determine the coordinates of local T -maxima. The brain areas with significant differences between population groups were reported only when they were identified by both VBM methods.
RESULTS
CHANGES IN VOLUME OF BRAIN AREAS FOR PD PATIENTS AS COMPARED TO NORMAL SUBJECTS (PD vs. CT)
Both VBM methods consistently found brain volumes to have decreased in the brain areas of the lentiform nucleus (LN), the IN, the middle frontal gyrus (MFG), and the cerebellar vermis in the PD group when compared to the normal controls. The details of brain areas with significant volumetric differences are listed in Table S2 in Supplementary Material. Table S2A in Supple-mentary Material shows the brain areas in which volume sizes are smaller in PD patients than in normal controls. The upper part of the table shows the results derived using the basic VBM, and the lower part shows the results using the DARTEL VBM method. The shaded areas in the table highlight the common results obtained from both VBM methods. Similarly, the brain areas with increased volumes in PD patients, as compared to the normal controls, are
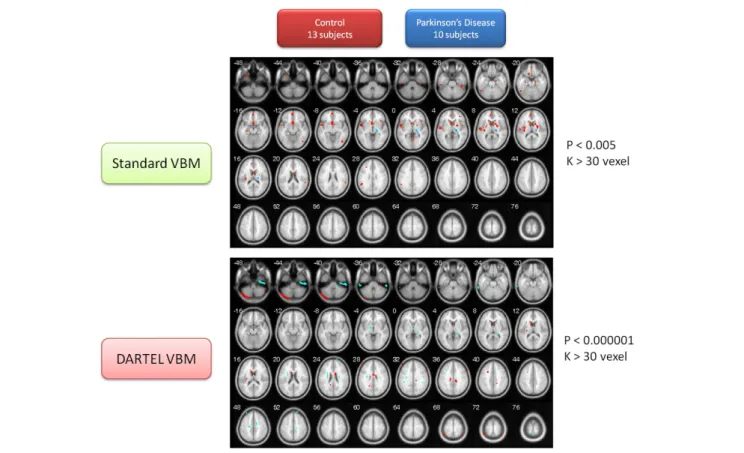
listed in Table S2B in Supplementary Material. Both VBM methods consistently identified the gray matter of the PD patients’ thalamus (ventral posterior lateral nucleus, VPL) as being larger than that of the normal control. The contrasting image between these two subject populations is depicted in Figure 2.
CHANGES IN VOLUME OF BRAIN AREAS FOR ET PATIENTS AS COMPARED TO NORMAL SUBJECTS (ET vs. CT)
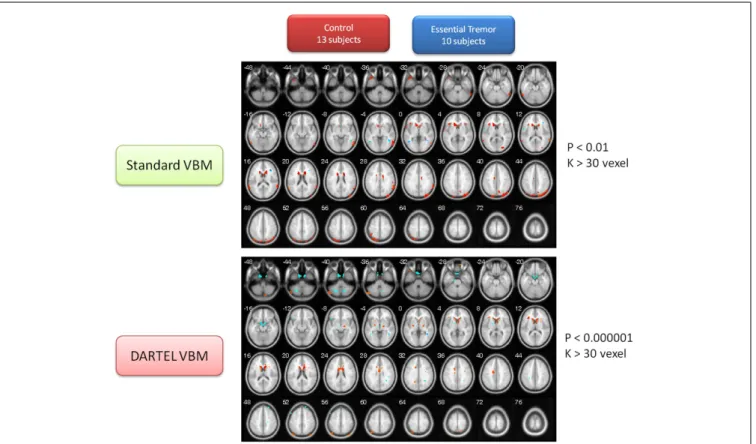
This portion of the study draws attention to the volumetric changes in the brains of ET patients compared to age-matched normal subjects. These two VBM methods consistently found that the brain volumes of the ET group were significantly smaller in many brain regions than that of control group, including the cau-date body, the middle temporal pole (L), the IN, the precuneus (L), and the superior temporal gyrus (STG). The detailed brain atrophy for the ET group is listed in Table S3A in Supplementary Material (the same color row marked similar brain regions for both methods). These two VBM methods, however, persistently identified the gray matter of the middle temporal gyrus (MTG), and the precentral gyrus in the ET group, to be larger than that of the normal control group (for detailed volume differences, please refer to Table S3B in Supplementary Material). The same color row marked similar brain regions for both methods. The contrast maps between the two groups are shown in Figure 3.
FIGURE 2 | Contrast maps of volume changes between healthy controls and Parkinson’s disease with two VBM methods. The warm
color represents the gray-matter volume of healthy controls larger than that of PD. Conversely, the cold color marks the gray-matter volume of PD larger than that of healthy controls. The basic VBM method revealed that PD patients have large atrophy in basal forebrain, IN, frontal cortex, temporal
cortex, and several occipital regions. The DARTEL VBM method with a critically significant-level also demonstrated the basal ganglia atrophy in PD patients, but the other atrophy regions are not totally consistent with the observation using basic VBM method. Conversely, the two methods consistently pinpointed that the posterior part of thalamus in PD patients is larger than that of normal controls.
FIGURE 3 | Contrast maps of volume changes between healthy controls and essential tremors with two VBM methods. The warm color represents
the gray-matter volume of healthy controls larger than that of ET. On the other hand, the cold color marks the gray-matter volume of ET larger than that of healthy controls. The basic VBM method revealed that ET patients have large atrophy in basal ganglia, particularly the caudate nucleus. Furthermore, IN,
temporal cortex, and parietal cortex were also observed. On the other hand, the DARTEL VBM method also confirmed that the caudate nucleus serious atrophy in ET patients. Additionally, the parietal cortex, cerebellum, and thalamus atrophy in ET patients was observed in DARTEL VBM method. Conversely, the two methods congruently identified that the bilateral MTG was significantly large than that of normal controls.
CHANGES IN VOLUME OF BRAIN AREAS FOR PD PATIENTS AS COMPARED TO ET PATIENTS (PD vs. ET)
In addition, this study also provided the volume of gray matter so as to compare between the two types of motor disorder (PD vs. ET). The utilization of the two VBM methods mentioned above served to confirm that the brain volume of the ET group was sig-nificantly smaller than that of the PD group in many brain regions, including the thalamus (VPL) and the MTG (R). In addition, both VBM methods persistently identified the gray matter of the MFG, the MTG, the cerebellum posterior lobe (Crus 1), and the IN in the ET group, to be larger than that of the PD group (for details about the volume change between the ET and PD groups, please refer to Tables S4A,B in Supplementary Material) (The identical color row represented consistent findings between both methods). The contrast maps for the two groups are depicted in Figure 4.
DISCUSSION
In this study we observed how the atrophic regions in PD groups are not only located in BTC loops but in CTC loops as well. The volume alterations associated with ET, on the other hand, are located in both BTC and CTC circuitries. As a result, differentiating between these two neurodegenerative movement disorders based solely on brain morphological alterations might not be the most
effective solution. However, such an overlap might be the reason as to why these two movement disorders share common symptoms of resting tremor, at least during the early stages of their onset. It is also worth noting that the volume increase of thalamus in PD groups in the present study is consistent with the hypothesized compensatory models of BTC. Conversely, the volume increase of the MTG in ET groups varies from what was predicted in the hypothesized compensatory model of the CTC. The func-tion of the MTG was regarded as being mainly the processing of motion perception and of ocular movement. Nevertheless, some ET patients have head tremor over the long term and may need to compensate by keeping their eye field stabilized. The MTG of ET patients might therefore need to be constantly activated so as to integrate their body-environment sensation and coordinate their head- and eye-centric systems. As a result, the MTG may very likely enlarge in size in response to such long-term compensatory effects. This study utilized two VBM methods for identifying the atrophic and compensatory effects in PD and ET patients, as com-pared to healthy controls. Both VBM methods consistently found that the PD patients have gray-matter atrophy in the BG, IN, MFG, and the cerebellum. Additionally, both methods also congruently identified the posterior part of thalamus as having increased in vol-ume when compared to that of normal controls. We also observed
FIGURE 4 | Contrast maps of volume changes between essential tremors and Parkinson’s disease with two VBM methods. In this
figure, the warm color represents the gray-matter volume of ET larger than that of PD, alternatively, the cold color marks the gray-matter volume of PD larger than that of ET. The additional comparison between the PD and ET patients indicated that the MTG, MFG, IN, temporal
lobe, and cerebellum of ET were larger than that of PD in both VBM methods (see alsoFigure 3). Moreover, the both methods
demonstrated that the parietal cortex, temporal cortex, and thalamus of PD were larger than that of ET. The finding on thalamus is consistent with the previous result in comparison between PD patients and healthy control (see alsoFigure 2).
that the gray matter of the caudate body, middle temporal pole, IN, precuneus, and the STG decreased, but that of the MTG increased in ET patients. The compensatory effect on PD and ET patients, during both VBM methods, was discussed less in previous brain volumetric morphology studies. Here we provide an alternative viewpoint, particularly as regards the compensatory effect on cer-tain brain regions (e.g., the thalamus in the PD group; the MTG in the ET group) that may help to reconsider the mechanism of movement symptoms during variant stages.
PD vs. CT
This study’s observations on brain atrophy, including that in the LN, the IN, the MFG, and the cerebellum (vermis) in the PD patients group, using both VBM methods, is consistent with a
number of previous functional and structural MRI studies (
Hig-ginson et al., 2001; Brenneis et al., 2003; Nakajima et al., 2003;
Price et al., 2004;Grafton et al., 2006;Pahwa et al., 2006;Phillips et al., 2006;Feldmann et al., 2008; Ibarretxe-Bilbao et al., 2008, 2009a,b,c;Borghammer et al., 2009;Camicioli et al., 2009; Car-doso et al., 2009;Pereira et al., 2009, 2011;Wattendorf et al., 2009;
Hamasaki et al., 2010) (see Figure 2; Table S1 in Supplementary Material). It is worth noting that the gray matter of the thalamus (VPL) of the PD group is larger than that of the control group, as
shown by both VBM methods. The present finding on thalamus enlargement is not noted in previous PD-related studies, except
for that ofKassubek et al. (2002). This finding is not inaccessible,
as conventional literature has consistently demonstrated how the thalamus receives inhibitory inputs from the GPi (Internal Part of Globus Pallidus) and the SN, and then projects excitatory
out-put to the cortex (Lubar and Bahler, 1976). In line with the BTC
loop, the inhibitory signal from the BG (GPi and SN) is weaker in PD patients as compared to healthy controls. Over the long run, therefore, thalamus enlargement may occur due to a decreased
inhibitory signal (Deogonkar et al., 2011). Consequently, the
exci-tatory output from the thalamus to the cortex may become too large and the signal may scatter in an unstable manner. Conversely, this phenomenon of thalamus enlargement may contribute to the aftereffects of medical treatment. Most patients were given l-DOPA treatment for many years to compensate for the function loss of BTC loops. Therefore, a number of stereotaxic surgeries and deep brain stimulation techniques on the thalamus can improve
the symptoms of PD patients (Deogonkar et al., 2011).
ET vs. CT
Atrophy in the CN, middle temporal pole, IN, Precuneus, and the STG appeared consistently when using both methods (Table S3A
in Supplementary Material). The present observation indicates that the resting tremor of ET patients might be due to gradual damage to the BTC loop. On the other hand, the present analysis also demonstrates that the MTG and the precentral gyrus have increased the volume of gray matter within the ET group (Table S3B in Supplementary Material). This MTG was known to be in response to motion detection and eye-movement control. The volume increase of MTG might be generated by the visual-motor coordination function in ET patients with head tremor.
PD vs. ET
An additional analysis was launched at this point for testing vol-ume differences between PD and ET patients. The findings were mostly consistent with the two previous comparisons to the con-trol group (PD vs. CT; ET vs. CT). The PD group has a relatively larger volume growth of the VPL thalamus and the MTG (Figure 4; Table S4A in Supplementary Material). The ET group, on the other hand, possessed a relatively larger volume increase in gray matter in the MFG, the MTG, the cerebellum posterior lobe (Crus 1), and the IN (Figure 4; Table S4B in Supplementary Material). The increased volume of these motor control regions may imply that these brain regions are involved in compensating for the effect of motor function over the long-term. For example, several patients with head tremor type suffered from uncomfortable involuntary head-motions, which meant the eye-movement control system had to expend more effort on immediate correction in response to the external world. Nevertheless, medical treatment may be an important confounding factor in interpreting the compensation effects of brain volume. This confounding factor will require a rel-atively larger amount of data for further clarification in the near future.
This study, by using two analysis methods, was able to con-firm that gray-matter atrophy (in the BG), and its compensatory effects (in the posterior part of the thalamus) in PD patients, conform to what was predicted by the BTC hypothesis. How-ever, the ET patients’ gray-matter atrophic effect related mostly to the BG and the neocortex, while its compensatory effects were observed mainly in the MTG, which is not completely congruent with the CTC hypothesis. Additionally, the brain volume change of ET patients was due mostly to the large atrophy of the CN. This may imply that the ET and PD partially share the dam-age mechanism in BTC loops, which, in turn, might explain, at least in part, their similar external symptoms (e.g., resting tremor).
The present study directly compared brain morphology between the three subject groups: the PD, the ET, and the normal control subjects. This study, however, was limited by the sample size of each group. To prevent an over-interpretation of its results, we employed the two VBM methods to cross validate the findings. Although the two VBM methods had slightly different analysis procedures, they resulted in fairly similar brain regions show-ing significant morphological changes associated with these two diseases. Both methods found several overlapping brain regions with disease-related volumetric differences from patients in the same groups. The DARTEL VBM, however, used a more pre-cise spatial normalization procedure and thus found a relatively larger number of brain areas than the basic VBM. Therefore, we
used different statistical criteria (uncorrected p< 0.005 for the
standard VBM and uncorrected p< 0.000001 for the DARTEL
VBM) for screening significant voxels in both methods. It is also worth noting that even with limited sample size for each of the patient/subject populations, the DARTEL VBM method could still find quite a few significant brain regions with significant mor-phometric differences among patient groups under a stringent
statistical criterion of uncorrected p< 0.000001. Using
conjunc-tion of these two VBM methods should be able to further address the problem of false positive caused by multiple comparisons in this study.
Over the past decade, the VBM methods and the standard of procedure of performing VBM analysis are still under continual revision and validation (see Table S1 in Supplementary Material; Tables 1 and 2). This is especially true when applying VBM to the patient populations with neurodegenerative diseases, such as PD and ET. Different degrees of atrophy in these patient populations might cause problems in spatial normalization at the boundary of the brain due at least in part to the intrusive degenerative portions. How such degenerative brains in the patient popula-tions may affect the result of VBM analysis remains to be further explored in detail.
CONCLUSION
As shown in both VBM analyses, the results reveal both decreased and increased volumes in brain areas that are involved in both BTC and CTC circuitries. Decreases in the volumes of the BG, the IN, and in many cortical regions, are consistent with previous PD studies. The present study also found that the volume increase in the PD group occurs in the VPL thalamus. Serious atrophy in the LN, the IN, the temporal, and the parietal cortex, on the other hand, is observed in the ET group. Notably, the increase in volume of the MTG was very evident in the ET group. The present obser-vation is consistent with a number of PD- and ET-VBM studies, which state that these long-term movement disorders are associ-ated not only with the atrophy of brain regions involved in motor control loops, but also with the enlargement of certain other brain regions. Such an enlargement may reflect a compensatory effect in response to the damaged motor control loops, the BTC, or to the CTC loops. As a result, the brain regions that increase in volume may play a more specific role following any brain damage caused by PD and ET, and may therefore be used as biomarkers for the diagnosis of these movement disorders, as well as for their clinical assessment.
AUTHORS CONTRIBUTION
Ching-Hung Lin, Chun-Ming Chen, and Jeng-Ren Duann con-tributed to the conceptual innovation, literature review, data interpretation, and drafting of the preliminary manuscript. Chun-Ming Chen, Jeng-Ren Duann acquired all image data. Ching-Hung Lin provided the image processing as well as statistical analysis. Ming-Kuei Lu and Chon-Haw Tsai were responsible for patients screening and provided some critical observation and discussion. Chon-Haw Tsai and Jin-Chern Chiou set up all experimental conditions for this study. Jeng-Ren Duann arranged all imag-ing experiments and finalized the MRI data interpretations with Ching-Hung Lin. Jan-Ray Liao provided some concepts of digital
image processing in MR image reconstruction and data analysis. All authors have consented to the submission and publication of the manuscript.
ACKNOWLEDGMENTS
The authors would like to thank the National Science Council of Taiwan, for financially supporting this study under Contract No. NSC 99-2314-B-039-017-MY2 and NSC 102-2320-B-039-001. This study was also supported in part by the “Aim for the Top University Plan” of National Chiao Tung University and the Ministry of Education, Taiwan (MOE-100W960). Parts of
the materials were previously presented in the 2012 Symposium Electro Medical Bioscience Association and BioPro International Workshop (Taipei, Taiwan). We-Kang Lee and Zong-Kai Hsu are appreciated for their great help on final proofreading and format rechecking. We also extend our thanks to the two reviewers for their valuable comments.
SUPPLEMENTARY MATERIAL
The Supplementary Material for this article can be found online at http://www.frontiersin.org/Human_Neuroscience/10. 3389/fnhum.2013.00247/abstract
REFERENCES
Agosta, F., Kostic, V. S., Galantucci, S., Mesaros, S., Svetel, M., and Pagani, E. (2010a). The in vivo distribution of brain tissue loss in Richardson’s syndrome and PSP-parkinsonism: a VBM-DARTEL study. Eur. J. Neurosci. 32, 640–647. doi:10.1111/j.1460-9568.2010.07304.x
Agosta, F., Pagani, E., Petrolini, M., Sor-mani, M. P., Caputo, D., and Perini, M. (2010b). MRI predictors of long-term evolution in amyotrophic lateral sclerosis. Eur. J. Neurosci. 32, 1490–1496. doi:10.1111/j.1460-9568.2010.07445.x
Ash, S., McMillan, C., Gross, R. G., Cook, P., Morgan, B., and Boller, A. (2011). The organi-zation of narrative discourse in Lewy body spectrum dis-order. Brain Lang. 119, 30–41. doi:10.1016/j.bandl.2011.05.006 Ashburner, J. (2010). VBM Tutorial.
[Manual]. 14.
Ashburner, J., and Friston, K. J. (2000). Voxel-based mor-phometry – the methods.
Neuroimage 11(6 Pt 1), 805–821.
doi:10.1006/nimg.2000.0582 Bagepally, B. S., Bhatt, M. D.,
Chan-dran, V., Saini, J., Bharath, R. D., and Vasudev, M. (2010). Decrease in Cerebral and cerebellar gray matter in essential tremor: a voxel-based morphometric analysis under 3T MRI. J. Neuroimaging 22, 275–278. doi:10.1111/j.1552-6569.2011.00598.x
Benito-Leon, J., Alvarez-Linera, J., Hernandez-Tamames, J. A., Alonso-Navarro, H., Jimenez-Jimenez, F. J., and Louis, E. D. (2009). Brain struc-tural changes in essential tremor: voxel-based morphometry at 3-Tesla. J. Neurol. Sci. 287, 138–142. doi:10.1016/j.jns.2009.08.037 Benninger, D. H., Thees, S., Kollias, S.
S., Bassetti, C. L., and Waldvogel, D. (2009). Morphological differences in Parkinson’s disease with and without rest tremor. J. Neurol. 256, 256–263. doi:10.1007/s00415-009-0092-2
Beyer, M. K., Larsen, J. P., and Aars-land, D. (2007). Gray matter atrophy in Parkinson disease with demen-tia and demendemen-tia with Lewy bodies.
Neurology 69, 747–754. doi:10.1212/
01.wnl.0000269666.62598.1c Borghammer, P., Ostergaard, K.,
Cum-ming, P., Gjedde, A., Rodell, A., and Hall, N. (2009). A deformation-based morphometry study of patients with early-stage Parkin-son’s disease. Eur. J. Neurol. 17, 314–320. doi:10.1111/j.1468-1331.2009.02807.x
Bouchard, T. P., Malykhin, N., Mar-tin, W. R., Hanstock, C. C., Emery, D. J., and Fisher, N. J. (2008). Age and dementia-associated atrophy predominates in the hippocampal head and amygdala in Parkinson’s disease. Neurobiol.
Aging 29, 1027–1039. doi:10.1016/
j.neurobiolaging.2007.02.002 Brenneis, C., Seppi, K., Schocke, M. F.,
Muller, J., Luginger, E., and Bosch, S. (2003). Voxel-based morphome-try detects cortical atrophy in the Parkinson variant of multiple system atrophy. Mov. Disord. 18, 1132–1138. doi:10.1002/mds.10502
Bruggemann, N., Hagenah, J., Reetz, K., Schmidt, A., Kasten, M., and Buchmann, I. (2010). Reces-sively inherited parkinsonism: effect of ATP13A2 mutations on the clinical and neuroimag-ing phenotype. Arch. Neurol. 67, 1357–1363. doi:10.1001/archneurol. 2010.281
Burton, E. J., McKeith, I. G., Burn, D. J., Williams, E. D., and O’Brien, J. T. (2004). Cerebral atrophy in Parkinson’s disease with and without dementia: a comparison with Alzheimer’s disease, demen-tia with Lewy bodies and con-trols. Brain 127(Pt 4), 791–800. doi:10.1093/brain/awh088 Camicioli, R., Gee, M., Bouchard, T. P.,
Fisher, N. J., Hanstock, C. C., and Emery, D. J. (2009). Voxel-based morphometry reveals extra-nigral atrophy patterns associated with dopamine refractory cognitive and
motor impairment in parkinson-ism. Parkinsonism Relat. Disord. 15, 187–195. doi:10.1016/j.parkreldis. 2008.05.002
Cardoso, E. F., Maia, F. M., Fregni, F., Myczkowski, M. L., Melo, L. M., and Sato, J. R. (2009). Depression in Parkinson’s disease: convergence from voxel-based morphometry and functional magnetic resonance imaging in the limbic thalamus.
Neuroim-age 47, 467–472. doi:10.1016/ j.neuroimage.2009.04.059 Cerasa, A., Messina, D., Nicoletti, G.,
Novellino, F., Lanza, P., and Condino, F. (2009). Cerebellar atrophy in essential tremor using an auto-mated segmentation method. AJNR
Am. J. Neuroradiol. 30, 1240–1243.
doi:10.3174/ajnr.A1544
Cerasa, A., Messina, D., Pugliese, P., Morelli, M., Lanza, P., and Sal-sone, M. (2011). Increased pre-frontal volume in PD with levodopa-induced dyskinesias: a voxel-based morphometry study. Mov. Disord. 26, 807–812. doi:10.1002/mds.23660 Chebrolu, H., Slevin, J. T., Gash, D. A., Gerhardt, G. A., Young, B., and Given, C. A. (2006). MRI volumetric and intensity analysis of the cerebellum in Parkinson’s disease patients infused with glial-derived neurotrophic factor (GDNF). Exp. Neurol. 198, 450–456. doi:10.1016/j.expneurol.2005.12.021 Chumbley, J. R., and Friston, K. J. (2009). False discovery rate revis-ited: FDR and topological infer-ence using Gaussian random fields.
Neuroimage 44, 62–70. doi:10.1016/
j.neuroimage.2008.05.021 Daniels, C., Peller, M., Wolff, S.,
Alfke, K., Witt, K., and Gaser, C. (2006). Voxel-based morphometry shows no decreases in cerebellar gray matter volume in essential tremor. Neurology 67, 1452–1456. doi:10.1212/01.wnl.0000240130. 94408.99
Deogonkar, M., Machado, A., and Vitek, J. L. (2011). “Stereotxic surgery and deep brain stimulation for
Parkinson’s disease and movement disorders,” in Movement Disorders, 3rd Edn, eds R. L. Watts, D. G. Stan-daertt, and J. A. Obeso (New York: Mc Graw Hill), 319–359. Draganski, B., and Bhatia, K. P.
(2010). Brain structure in move-ment disorders: a neuroimaging per-spective. Curr. Opin. Neurol. 23, 413–419. doi:10.1097/WCO.0b013 e32833bc59c
Dum, R. P., and Strick, P. L. (2009). “Basal ganglia and cerebellar circuits with the cerebral cortex,” in The
Cog-nitive Neuroscience, 4 Edn, ed. M.
S. Gazzaniga (Cambridge, MA: The MIT Press), 553–563.
Feldmann, A., Illes, Z., Kosztolanyi, P., Illes, E., Mike, A., and Kover, F. (2008). Morphometric changes of gray matter in Parkinson’s disease with depression: a voxel-based mor-phometry study. Mov. Disord. 23, 42–46. doi:10.1002/mds.21765 Focke, N. K., Helms, G., Scheewe, S.,
Pantel, P. M., Bachmann, C. G., and Dechent, P. (2011). Individual voxel-based subtype prediction can differentiate progressive supranu-clear palsy from idiopathic Parkin-son syndrome and healthy controls.
Hum. Brain Mapp. 32, 1905–1915.
doi:10.1002/hbm.21161
Gazzaniga, M. S., Ivry, R. B., and Man-gun, G. R. (2008). Cognitive
Neu-roscience: The Biology of the Mind,
3rd Edn. New York: W.W. Norton & Company.
Good, C. D., Johnsrude, I. S., Ash-burner, J., Henson, R. N., Friston, K. J., and Frackowiak, R. S. (2001). A voxel-based morphometric study of ageing in 465 normal adult human brains. Neuroimage 14(1 Pt 1), 21–36. doi:10.1006/nimg.2001.0786 Grafton, S. T., Turner, R. S., Desmur-get, M., Bakay, R., Delong, M., and Vitek, J. (2006). Normaliz-ing motor-related brain activity: subthalamic nucleus stimulation in Parkinson disease. [Research Support, N.I.H., Extramural].
Neurology 66, 1192–1199. doi:10.
Hamasaki, T., Yamada, K., Hirai, T., and Kuratsu, J. (2010). A positive correla-tion between fraccorrela-tional white matter volume and the response of Parkin-son disease patients to subthalamic stimulation. Acta Neurochir. (Wien) 152, 997–1006. doi:10.1007/s00701-010-0609-6 discussion 1006, Higginson, C. I., Fields, J. A., and
Troster, A. I. (2001). Which symp-toms of anxiety diminish after surgi-cal interventions for Parkinson dis-ease? Neuropsychiatry Neuropsychol.
Behav. Neurol. 14, 117–121.
Ibarretxe-Bilbao, N., Junque, C., Marti, M. J., and Tolosa, E. (2011a). Brain structural MRI correlates of cog-nitive dysfunctions in Parkinson’s disease. J. Neurol. Sci. 310, 70–74. doi:10.1016/j.jns.2011.07.054 Ibarretxe-Bilbao, N., Junque, C., Marti,
M. J., and Tolosa, E. (2011b). Cerebral basis of visual hallucina-tions in Parkinson’s disease: struc-tural and functional MRI stud-ies. J. Neurol. Sci. 310, 79–81. doi:10.1016/j.jns.2011.06.019 Ibarretxe-Bilbao, N., Junque, C., Tolosa,
E., Marti, M. J., Valldeoriola, F., and Bargallo, N. (2009a). Neu-roanatomical correlates of impaired decision-making and facial emo-tion recogniemo-tion in early Parkin-son’s disease. Eur. J. Neurosci. 30, 1162–1171. doi:10.1111/j.1460-9568.2009.06892.x
Ibarretxe-Bilbao, N., Ramirez-Ruiz, B., Junque, C., Marti, M. J., Valldeo-riola, F., and Bargallo, N. (2009b). Differential progression of brain atrophy in Parkinson’s disease with and without visual hallucinations.
J. Neurol. Neurosurg. Psychiatr.
81, 650–657. doi:10.1136/jnnp.2009. 179655
Ibarretxe-Bilbao, N., Tolosa, E., Junque, C., and Marti, M. J. (2009c). MRI and cognitive impairment in Parkinson’s disease. Mov.
Dis-ord. 24(Suppl. 2), S748–753. doi:10.1002/mds.22670
Ibarretxe-Bilbao, N., Ramirez-Ruiz, B., Tolosa, E., Marti, M. J., Valldeori-ola, F., and Bargallo, N. (2008). Hip-pocampal head atrophy predomi-nance in Parkinson’s disease with hallucinations and with demen-tia. J. Neurol. 255, 1324–1331. doi:10.1007/s00415-008-0885-8 Jubault, T., Brambati, S. M.,
Deg-root, C., Kullmann, B., Strafella, A. P., and Lafontaine, A. L. (2009). Regional brain stem
atrophy in idiopathic Parkinson’s disease detected by anatomi-cal MRI. PLoS ONE 4:e8247. doi:10.1371/journal.pone.0008247 Jubault, T., Gagnon, J. F., Karama, S.,
Ptito, A., Lafontaine, A. L., and Evans, A. C. (2011). Patterns of cortical thickness and surface area in early Parkinson’s disease.
Neu-roimage 55, 462–467. doi:10.1016/
j.neuroimage.2010.12.043 Kassubek, J., Juengling, F. D.,
Hell-wig, B., Spreer, J., and Lucking, C. H. (2002). Thalamic gray matter changes in unilateral Parkinsonian resting tremor: a voxel-based mor-phometric analysis of 3-dimensional magnetic resonance imaging.
Neu-rosci. Lett. 323, 29–32. doi:10.1016/
S0304-3940(02)00111-8
Kurth, F., Luders, E., and Gaser, C. (2010). VBM8-Toolbox Manual. [Manual]. 30.
Lubar, J., and Bahler, W. (1976). Behavioral management of epilep-tic seizures following EEG biofeed-back training of the sensorimotor rhythm. Biofeedback Self Regul. 1, 77–103. doi:10.1007/BF00998692 Martin, W. R., Wieler, M., Gee, M.,
and Camicioli, R. (2009). Tempo-ral lobe changes in early, untreated Parkinson’s disease. Mov. Disord. 24, 1949–1954. doi:10.1002/mds.22680 Mauk, M. D., and Thach, W. T. (2008).
“Cerebellum,” in Fundamental Neuroscience, 3rd Edn, eds L. R.
Squire, D. Berg, F. E. Bloom, S. D. Lac, A. Ghosh, and N. C. Spitzer (Burlington: Academic Press), 751–774.
Mink, J. W. (2008). “The basal gan-glia,” in Fundamental Neuroscience, 3rd Edn, eds L. R. Squire, D. Berg, F. E. Bloom, S. D. Lac, and N. C. Spitzer (Burlington, MA: Academic Press), 725–750.
MATLAB 2010a. (2010). Natick: The MathWorks, Inc.
Nakajima, T., Nimura, T.,Yamaguchi, K., Ando, T., Itoh, M., and Yoshimoto, T. (2003). The impact of stereotac-tic pallidal surgery on the dopamine D2 receptor in Parkinson disease: a positron emission tomography study. [Research Support, Non-U.S. Gov’t]. J. Neurosurg. 98, 57–63. doi:10.3171/jns.2003.98.1.0057 Pahwa, R., Factor, S. A., Lyons, K. E.,
Ondo, W. G., Gronseth, G., and Bronte-Stewart, H. (2006). Practice Parameter: treatment of Parkin-son disease with motor fluctuations
and dyskinesia (an evidence-based review): report of the Quality Standards Subcommittee of the American Academy of Neurology. [Practice Guideline Review].
Neu-rology 66, 983–995. doi:10.1212/
01.wnl.0000215250.82576.87 Pereira, J. B., Ibarretxe-Bilbao, N., Marti,
M. J., Compta, Y., Junque, C., and Bargallo, N. (2011). Assess-ment of cortical degeneration in patients with Parkinson’s disease by voxel-based morphometry, cor-tical folding, and corcor-tical thickness.
Hum. Brain Mapp. 33, 2521–2534.
doi:10.1002/hbm.21378
Pereira, J. B., Junque, C., Marti, M. J., Ramirez-Ruiz, B., Bargallo, N., and Tolosa, E. (2009). Neuroanatomical substrate of visuospatial and visuop-erceptual impairment in Parkinson’s disease. Mov. Disord. 24, 1193–1199. doi:10.1002/mds.22560
Phillips, M. D., Baker, K. B., Lowe, M. J., Tkach, J. A., Cooper, S. E., and Kopell, B. H. (2006). Parkinson disease: pattern of func-tional MR imaging activation dur-ing deep brain stimulation of subthalamic nucleus–initial expe-rience. [Research Support, Non-U.S. Gov’t]. Radiology 239, 209–216. doi:10.1148/radiol.2391041990 Price, S., Paviour, D., Scahill, R., Stevens,
J., Rossor, M., and Lees, A. (2004). Voxel-based morphometry detects patterns of atrophy that help dif-ferentiate progressive supranuclear palsy and Parkinson’s disease.
Neu-roimage 23, 663–669. doi:10.1016/
j.neuroimage.2004.06.013 Quattrone, A., Cerasa, A., Messina,
D., Nicoletti, G., Hagberg, G. E., and Lemieux, L. (2008). Essen-tial head tremor is associated with cerebellar vermis atrophy: a volu-metric and voxel-based morphom-etry MR imaging study. AJNR
Am. J. Neuroradiol. 29, 1692–1697.
doi:10.3174/ajnr.A1190
Ramirez-Ruiz, B., Marti, M. J., Tolosa, E., Gimenez, M., Bargallo, N., and Valldeoriola, F. (2007). Cerebral atrophy in Parkinson’s disease patients with visual hal-lucinations. Eur. J. Neurol. 14, 750–756. doi:10.1111/j.1468-1331.2007.01768.x
Reetz, K., Gaser, C., Klein, C., Hage-nah, J., Buchel, C., and Gottschalk, S. (2009). Structural findings in the basal ganglia in genetically deter-mined and idiopathic Parkinson’s
disease. Mov. Disord. 24, 99–103. doi:10.1002/mds.22333
Reetz, K., Tadic, V., Kasten, M., Brugge-mann, N., Schmidt,A., and Hagenah, J. (2010). Structural imaging in the presymptomatic stage of genet-ically determined parkinsonism.
Neurobiol. Dis. 39, 402–408. doi:10.1016/j.nbd.2010.05.006 Ridgway, G. R., Henley, S. M., Rohrer,
J. D., Scahill, R. I., Warren, J. D., and Fox, N. C. (2008). Ten simple rules for reporting voxel-based morphometry studies.
Neu-roimage 40, 1429–1435. doi:10.1016/
j.neuroimage.2008.01.003 Talairach, J., and Tournoux, P. (1988).
Co-Planar Stereotaxic Atlas of the Human Brain: 3-Dimensional Pro-portional System: An Approach to Cerebral Imaging (M. Rayport, Trans.). New York: Thieme Medical Publishers.
Wattendorf, E., Welge-Lussen, A., Fiedler, K., Bilecen, D., Wolfens-berger, M., and Fuhr, P. (2009). Olfactory impairment predicts brain atrophy in Parkinson’s dis-ease. J. Neurosci. 29, 15410–15413. doi:10.1523/JNEUROSCI.1909-09.2009
Watts, R. L., Standaertt, D. G., and Obeso, J. A. (eds). (2011).
Move-ment Disorders, 3rd Edn. New York:
McGraw Hill.
Conflict of Interest Statement: The
authors declare that the research was conducted in the absence of any com-mercial or financial relationships that could be construed as a potential con-flict of interest.
Received: 05 February 2013; accepted: 19 May 2013; published online: 14 June 2013.
Citation: Lin C-H, Chen C-M, Lu M-K, Tsai C-H, Chiou J-C, Liao J-R and Duann J-R (2013) VBM reveals brain volume differences between Parkinson’s disease and essential tremor patients. Front. Hum. Neurosci. 7:247. doi: 10.3389/fnhum.2013.00247
Copyright © 2013 Lin, Chen, Lu, Tsai, Chiou, Liao and Duann. This is an open-access article distributed under the terms of the Creative Commons Attribution License, which permits use, distribution and reproduction in other forums, pro-vided the original authors and source are credited and subject to any copy-right notices concerning any third-party graphics etc.