國
立
交
通
大
學
經營管理研究所
博 士 論 文
No.146
以跨代空間映射觀點探討新產品的
有機成長與交叉存活競爭
New Products’ Organic Growth and Cross-Competitive Survival
Patterns: A Multi-Generation Spatial Mapping Perspective
研 究 生:吳敏華
指導教授:唐瓔璋 教授
國
立
交
通
大
學
經營管理研究所
博
士
論
文
No.146
以跨代空間映射觀點探討新產品的
有機成長與交叉存活競爭
New Products’ Organic Growth and Cross-Competitive Survival
Patterns: A Multi-Generation Spatial Mapping Perspective
研 究 生:吳敏華
研究指導委員會:唐瓔璋 教授
丁 承 教授
張家齊 教授
指導教授:唐瓔璋 教授
中 華 民 國 一○一 年 六 月
以跨代空間映射觀點探討新產品的有機成長與交叉存活競爭
New Products’ Organic Growth and Cross-Competitive Survival Patterns:
A Multi-Generation Spatial Mapping Perspective
研 究 生:吳敏華 Student:Min-Hua Wu
指導教授:唐瓔璋 Advisor:Ying-Chan Tang
國 立 交 通 大 學
經 營 管 理 研 究 所
博 士 論 文
A DissertationSubmitted to Institute of Business and Management College of Management
National Chiao Tung University in Partial Fulfillment of the Requirements
for the Degree of Doctor of Philosophy
in
Business and Management
June 2012
Taipei, Taiwan, Republic of China
- - i
以跨代空間映射觀點探討新產品的有機成長與交叉存活競爭
研究生:吳敏華
指導教授
:唐瓔璋
國立交通大學經營管理研究所博士班
摘
要
科技品短暫的存續期間,市場擴散可以生物物種演進的概念來詮釋,使產品 為一系列不斷進步調整的群體。本研究從單一品類的角度,觀察品牌產品在不同 的進化階段,市場上相同屬性但不同規格產品的價格競爭形勢。從行銷的觀點, 以羅吉特形式市場佔有率模型,分析台灣某通路商實際的交易買賣資料,藉由價 格競爭指數計算出價格交叉彈性,反映品牌產品的相對吸引力,探索誘餌產品是 否引起消費者選擇時的妥協和極端趨避心態;進一步以空間時態的自我羅吉斯模 式,整合產品吸引力之估算,概念地捕捉新產品交叉銷售之自我蠶食或內在增長 的意涵。此外,從市場進入的觀點,以存活分析檢視產品的品類族群競爭,Cox 正比例涉險模式顯示價格因素並不顯著。研究結果驗證早期階段消費者的妥協選 項,考量產品間的相依性至空間自我相關集合,比傳統的線性銷售預測有較優之 配適。透過心理與物理的討論,本研究認為妥協效果並非科技軌跡的唯一決定因 子,其可能是基於買賣雙方內在趨力和產品發展路徑的必然結果;以產品內和產 品間的空間映射,檢視跨世代新產品的有機成長,除了推翻「新高科技商品一定 能存活」的假設外,也對展望理論「消費者傾向妥協中間選項為最佳決策」的論 述提出質疑。 關鍵詞:妥協效果、科技軌跡、跨代空間映射。
- - ii
New Products’ Organic Growth and Cross-Competitive Survival Patterns:
A Multi-Generation Spatial Mapping Perspective
Student:Min-Hua Wu Advisor:Dr. Ying-Chan Tang
Institute of Business and Management
National Chiao Tung University
ABSTRACT
The market diffusion of high-tech products with their short life cycle duration can be interpreted in terms of biological species evolution, that is, as a series of continuously progressing product groups. This study focuses on different evolutionary stages of the same property, which differs in product specifications competition, from the perspective of a single brand product category. The transactions data of a leading brand of an actual Taiwan MP3 music player was analyzed by logit-type market share models. Price competition index and cross-price elasticity were calculated to estimate alternative products’ attractiveness, and, consequently, whether the decoys create consumer compromise and extremeness aversion mentality. The autologistic choice model for a spatial-temporal pattern was also demonstrated to incorporate attractiveness in formal choice models; these estimates enable the authors to conceptually capture the cross-selling patterns of a new product’s cannibalism or intrinsic growth. Additionally, the market entry view is also adopted to consider product survival duration; the Cox proportional hazard model reveals price is non-significant factor. The results verify consumers’ midway compromise and decoy options at earlier stage. Incorporating the interdependence of products by modeling a spatial autocorrelation choice set leads to superior fit compared with the traditional linear sales predictions. This study proposes that compromise effect is not the only determinant for product growth, but that it may inevitably result from the technology’s trajectory and product development path based on a two-fold inner drive. Using intra- and inter-competition spatial mapping to survey the organic growth of new cross-generational products, the long-term survivability can be assessed. These assessments have cast doubts on consumer acceptance of a new product launch, and the discourse of an individual’s best choice as in prospect theory has been questioned, as this choice seems more compromised intermediate.
- - iii
ACKNOWLEDGEMENTS
In his poem, “The Road not Taken,” Robert Frost wrote, “Two roads diverged in a wood, and I--I took the one less traveled by, and that has made all the difference.” This dissertation has been a challenge, but one I have enjoyed. I am happy to present it to my advisor, Dr. Ying-Chan Tang, who not only provided sound advice about relevant theory, but also encouraged me throughout my academic program to avoid the shackles of traditional thinking.
I would like to extend my heartfelt gratitude to my committee members, Dr. Cherng Ding and Dr. Chia-Chi Chang for guiding me through the dissertation process, and never accepting less than my best efforts. Members of my oral defense committee, Wen-Chang Fang, Chung-Chiang Hsiao, and Kuo-Chung Chang, also shared their personal experiences and expertise with me. I thank them all, as I could not have completed this dissertation without their assistance.
I would also like to extend a special thanks to the teachers and faculty of the Department of International Trade at the Chinese Culture University for offering me a job as a part-time instructor. By providing me with teaching experience to complement the education I have received, the Department of International Trade helped me refine my thinking about research.
The course of my Ph.D. program has been the most wonderful and beautiful period in my life; I have experienced marriage, pregnancy, and childbirth. To fully enjoy these blessings, I spent eight years (including non-academic leave) to obtain this academic degree. As such, I am sincerely grateful for the patience and thoughtfulness of the teachers and faculty from National Chiao Tung University. I would like to extend special thanks to Miss Hsiao as she has always provided suggestions and assistance with kindness.
Most importantly, I would like to thank my family, friends, and husband, whose patient love enabled me to complete this dissertation.
Finally, I offer my thanks to Buddha, who made all things possible and bestowed upon me a healthy and endearing daughter, who is a miracle.
- - iv
CONTENTS
摘要 ……….. i ABSTRACT ……….. ii ACKNOWLEDGEMENTS ……….. iii CONTENTS ……….. iv LIST of TABLES ……….. viLIST of FIGURES ……….. vii
1. Introduction……….. 1
1.1 Research Background………... 1
1.2 Motivation……… 4
1.3 Research Objective and Contribution………... 4
2. Literature Review………. 6
2.1 Product Life Cycle and Evolution Cycle……….. 6
2.2 Compromise Effect………... 7
2.3 Brand Attraction………... 8
2.4 Price Elasticity and Brand Competition-Analyzing…. 9 2.5 Spatial Science………. 10
2.6 Competitive Entry ………... 12
3. The Proposed Model……… 14
3.1 Conceptual Overview………... 14
3.2 Joint-Space Mapping……… 15
3.3 Mathematical Calculations………... 17
3.4 Lifetime Distributions ………..… 20
4. Empirical Application……….. 22
4.1 Industry Property and Data Sources………. 22
4.2 Database Description……… 23
4.3 Joint-Space Reasoning………. 25
4.4 Product Price Competition………... 25
4.5 Spatial Correlation……… 29
4.6 Survival in a Competitive Market……… 33
- - v
5. Discussion……… 40
5.1 Compromise Phenomenon……… 40
5.2 Multi-generational Spatial Diffusion……… 42
5.3 Intra-Brand Competitive Survival……… 45
6. Managerial and Theoretical Implications………. 48
6.1 New Product Development……….. 48
6.2 Product Attractiveness Observation………. 50
6.3 Market Competition………..……... 52
6.4 Continuation in Disruptive Innovation………. 53
7. Conclusion……… 57
7.1 Concluding Remarks……… 57
7.2 Limitations……… 57
REFERENCES ……….. 59
APPENDIX Regression Models for Lifetime Data……….. 65
- - vi
LIST of TABLES
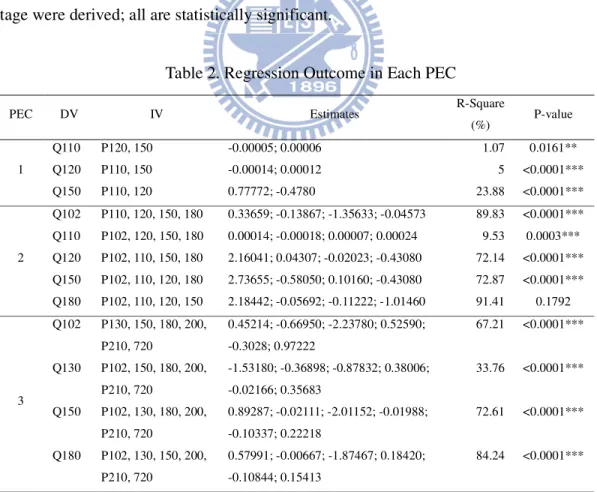
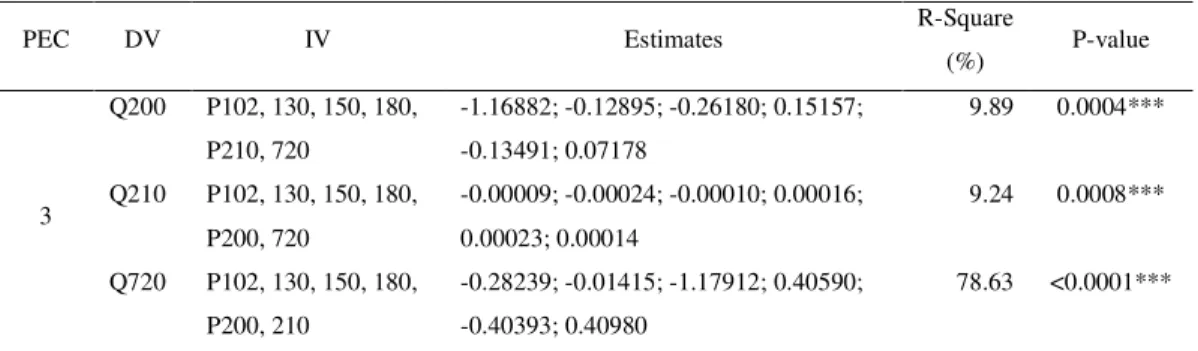
Table 1. Product Price and Sale in Each PEC………. 24Table 2. Regression Outcome in Each PEC………... 26
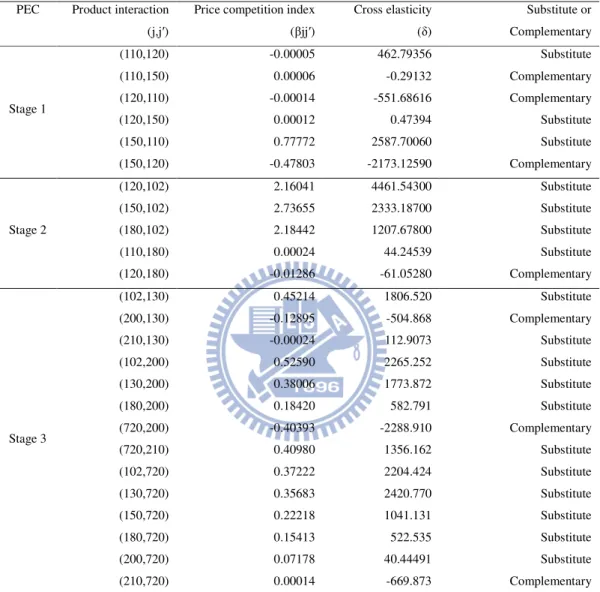
Table 3. Price Competition Index and Cross Elasticity in Each PEC………. 28
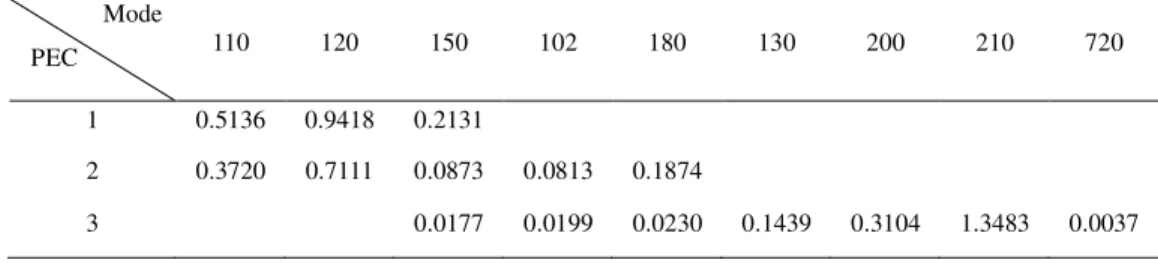
Table 4. The Relative Attractiveness of Products in Each PEC……….. 29
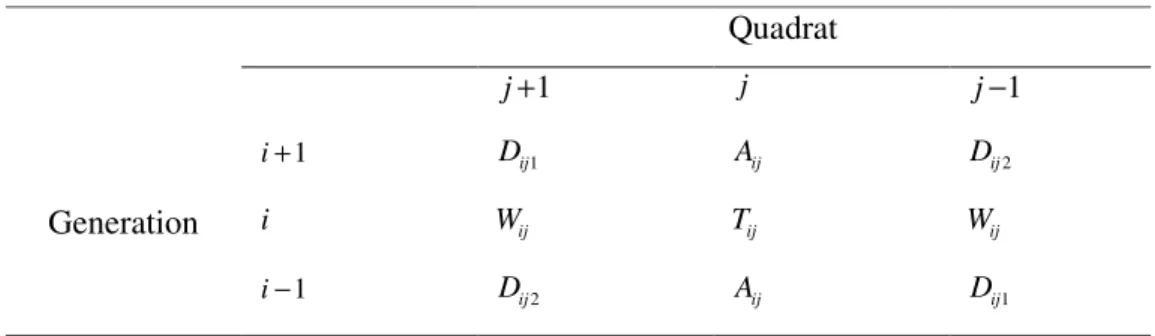
Table 5. Types of Neighbors of Site Tij……….. 30
Table 6. Chi-square Statistic for Comparing Models..………... 31
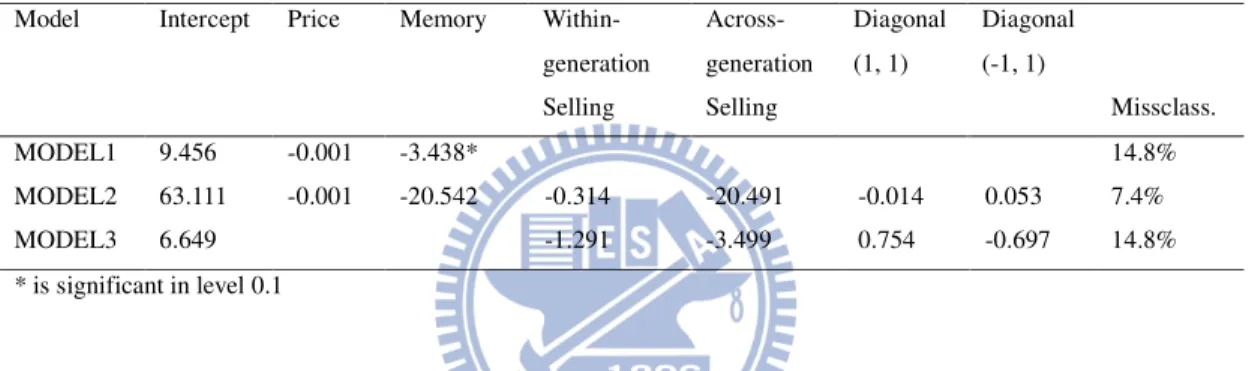
Table 7. Parameter Estimates and Proportion on Quadrats Misclassified………... 32
Table 8. Kaplan-Meier Estimator and Its Estimated Variance……….. …. 35
Table 9. Rank Statistics………... 36
Table 10. Testing Equality of Survival Curves for Duration over Strata………….. 37
Table 11. Testing Global Null Hypothesis of Proportional Hazards Model………. 38
- - vii
LIST of FIGURES
Figure 1. Research Concept Sketch………...
14Figure 2. Conceptual Overview of Models………... 16
Figure 3. Modified Standard Systems of Spatial Mapping………... 19
Figure 4. Survival Curves of MP3 Product………... 35
Figure 5. Survival Curves of Three Generations……….. 37
Figure 6. Product Attribute Position of Choice Set………... 40
Figure 7. A Series of Technological Generations……….. 43
Figure 8. Three-dimensional Scatter Plot for Different Generations……… 49
Figure 9. Scatter Plot of Product Information………... 51
Figure 10. Three-Dimensional Surface for Different Generations………. 54
- - 1
1. Introduction
1.1 Research Background
With the global industry moving swiftly toward the post-globalization era, the competitive environment has become complicated and unpredictable, and technological products are increasingly characterized by a short life cycle. Retrospecting on the ICT industry’s evolutionary change of the last several decades, Apple Computer introduced iPod in 2001, iPhone in 2007, iPad Tablet PC in 2010, and possibly iTV; is a series of new products for several generations. Companies innovate and adjust their product direction to gain competitive advantage and meet the spontaneously growing demand. Many corporations strive for research and development (R&D) and production of more advanced products to satisfy diversified consumer needs, attempting to create another industry life-cycle peak. Nevertheless, new products are intrinsically associated with a high level of market uncertainty. Changes in market competitors, the uncertainty of new technology paradigms, and the variety of consumer trends are affecting performance. Innovation is not just about launching a thoroughly new concept of goods, but involves improving the existing product in the market to give consumers a new experience that is truly innovative.
As old products are continuously replaced in favor of new ones, product types and features grow increasingly complex, and product elimination through competition accelerates. Moreover, businesses not only face competition from other brands but also face fierce struggles among the product lines of their own brands. As homogeneous products multiply, if businesses wish to preempt their competitors in launching new products, they must first understand the existing state of product competition on the market. Product life cycle (PLC) has been widely used in product management, strategic planning, and marketing activities. However, its definition and application are highly controversial.
Previous research criticized PLC as not being a conscientiously rigorous model; in particular, its use in the development of marketing products seems overly simplified. It ignores those important variables affecting sales, and may even lead managers to mishandle the competition situation and miss the opportunities for product innovation, leading to tautologies in deterministic and sequential stages (Dhalla and Yuspeh, 1976; Hunt, 1976, 2010; Tellis and Crawford, 1981; Wind and Claycamp, 1976). Product
- - 2
evolution cycle (PEC) is the concept that products are continually changing and evolving. This concept draws on the biological viewpoint of evolution to explain the growth and expansion of products (Chandrasekaran and Tellis, 2007; Holak and Tang, 1990; Norton and Bass 1987; Tellis and Crawford, 1981). Product species are not just objects with fixed characteristics and specifications, but a series of continuously progressing and changing groups.
As product development is the transformation of a market opportunity into a product available for sale (Krishnan and Ulrich, 2001), it is an intrinsic process that involves not only sellers’ niche or habitat metabolisms and new product diffusion epidemics but also interactive marketing that includes up-selling, down-selling, and cross-selling (Kamakura, Kossar, and Wedel, 2004; Li, Sun, and Wilcox, 2005). Well-designed product lines push corporations to grow instead of self-cannibalizing. In the development process, technological products are generally based on an original model, to which an increasing number of new functions or attributes are added. Consumers facing the multitude of choices resulting from product evolution will attempt to determine the best reason for selecting a specific product. The diffusion of innovation theory can be used to explain commodities spread (Rogers, 1995). When consumers perceive the innovative products as superior to other competing goods, the product has a comparative advantage and a higher likelihood of consumer adoption, leading to the diffusion effect (Agarwal and Prasad, 1997; McDade, Oliva, and Pirsch, 2002; Taylor and Todd, 1995). Even so, according to the prospect theory (Kahneman and Tversky, 1979), consumers will focus more on potential losses rather than potential benefits when they are unsure of their preferences; thus, they tend to prefer less extreme choices.
In addition, consumers are often influenced by their context effect (Huber, Payne, and Puto, 1982; Simonson and Tversky, 1992), and endeavor to determine the best reason for selecting one specific commodity. The choice behavior under uncertainty is more easily interpreted as compromise effect; in particular, compromise effect can systematically influence consumer choice in regard to the wide range of product sets and attributes (Kiverz, Netzer, and Srinivasan, 2004; Simonson, 1989). This makes a moderate, compromised choice the best option. When a specific brand’s competitor adopts a price-cutting strategy, the ability of this brand to fight back against such
- - 3
price-reducing behavior (cross-elasticity) is reflected in the change of market share or sales and provides an opportunity for attracting consumers. This is called brand attraction power, reflecting the behavior result of a firm and its competitors (Francois and MacLachlan, 1994; Woodside and Walser, 2007). Precisely, cross-price elasticity is the sales changes of other products resulting from the price change of one product. It can be used to observe the influence of a competing brand’s price change, analyze market competition structure, and position further competitive brands (Cooper, 1988; Day, 1979; González-Benito, Martínez-Ruiz, and Molla-Descals, 2009; Kamakura and Russell, 1989). From a brand management perspective, the importance lies in understanding the substitution consumers recognize, measuring the power of brands under price competition, and forecasting the volume of sales (Bucklin and Srinivasan, 1991; Shocker, Stewart, and Zahorik, 1990).
This study adopts the marketing view in the product development research community to consider product competition. A product is a bundle of attributes, and consumer utility is a function of these attributes. Typically, consumers’ decisions rely on product attribute level and price while corporation’s performance metrics are conceded in whether the product fits the market, gains market share, or upgrades customer utility. In addition, competitive products are developed not only across firms but within the same firm over time (Krishnan and Ulrich, 2001). From the perspective of a single brand, we observe the price competition among products at different stages of evolution that had the same market attributes but different mode specifications. The focus of this study is not on the influence of price on sales but rather investigates the alternative or complementary price relationships between different product modes, as well as using cross-price elasticity to measure the attraction power of brands in price competition. Whether adding a decoy product option to the choice set under consideration by a consumer would increase the possibility of a specific product being selected was also explored.
Specifically, past studies analyzed product sales as a function of price or related marketing activities as consumer choice variables and did not incorporate other contextual view to study such as cross-selling and product line cannibalism. The focus of this article is to demonstrate the spatial pattern such as Apple’s i-series, which enables the practitioners to view the sequential patterns of a new product’s growth
- - 4
process of a particular product specification in the light of other competitive ones. Our aim is to demonstrate the applications of spatial competition models and interpretation of the associated parameters.
1.2 Motivation
Technology trajectory is the developed path of technology in its life cycle overtime and this path may be the growth rate of performance improvement, product diffusion, or the direction of advance within a technological paradigm (Dosi, 1982; Schiling, 2010). Considering the marketing view that a product is a bundle of attributes, this study incorporates spatial mapping perspectives to understand the diffusion of multi-generation products. In addition, we hope to comprehend the spatial competition between products in a product class over different generations and how the market entries are adopted by considering product survival duration.
For industrial economics, market entry plays a central role. From the perspective of a single brand, the multi-generation product can be regarded as continuous product entry. The effectiveness of market entry involves with various product modes and marketing activities. Price is an important consideration for products appearing attractive; combining duration and the price attribute allows us to understand the nature of competition and the market evolution. This study attempts to determine the influence of price variable over various product generations and investigate the new product hazard rate information to facilitate our understanding about technology trajectory and life cycle paths.
1.3 Research Objective and Contribution
In keeping up with the above, the research objectives are (1) to analyze a national MP3 brand on how the product-price variants of a specific product class (or category) influences each others’ product attractiveness over different evolution cycles; (2) to probe consumer’s utility function on whether the aversion for losses is compromised in the considered product choice set; (3) to compare multi-generation products’ chance of survival on the basis of lifetime survival gains.
Our contribution is threefold. First, we provide a structured process of intra-brand product development research with the implementation of spatial science. We hope that this approach encourages researchers to be flexible about incorporating critical factors,
- - 5
multiple points, and multiple generations into their models. Second, we present an evolution cycle approach to organizing the product price competition, using the marketing perspective of several product generations in examining the compromise effect. The product attributes and consumer behavioral interaction enable marketers to target their communications more effectively. Third, we identify the technology’s trajectory and discuss possibilities for future product line design that would extend in productive directions. On the premised rationality of the individual’s inner drive for selecting a preferred product and the vendors’ inner drive to satisfy their growing demand by product joint space, we acknowledge the role of individual behavior and marketing in the effectiveness of product development processes. This interdisciplinary research can complement previous study on entry and technology marketing.
The rest of the dissertation is organized as follows. Section 2 gives a brief overview of PLC and PEC, compromise effect, brand attraction, cross-price elasticity and the brand competition-analyzing model and reviews spatial science, focusing especially on the study applied by marketing or consumer research. Section 3 outlines our proposed model, including a conceptual framework and mathematical calculations, and Section 4 deals with data and empirical application. In Section 5, we discuss compromise phenomenon and multi-generational spatial diffusion from the marketing perspective, and covers the market entry view with regard to a single brand to discuss the actual product survival considering life time duration. Section 6 contains managerial and theoretical implications including the expected effect of pricing strategy on product launch decisions. Conclusion and further research direction are suggested in Section 7.
- - 6
2. Literature Review
2.1 Product Life Cycle and Evolution Cycle
PLC theory is used to explain the life of products in the market, that is to say the entire process from a new product’s entrance into the market to its elimination through competition (Vernon, 1966). From the marketing perspective, Kotler (1991) defined PLC as the relationship of sales varying over time in the period during which the product comes in the market until it is removed. There are four main assumptions: (1) the product has a limited life; (2) the seller encounters different challenges, problems, and opportunities at different stages; (3) the variation direction of income is not identical in each cycle and may increase or decrease; and (4) relevant product strategy must consider the stage that the product is at.
Most products go through four stages: introduction, growth, maturity, and decline. This theory was widely discussed in the past; however, scholars have questioned its validity. Hunt (1976) argued that since the fixed four stages have a bell-shaped distribution, to define the stage of one product by its sales, and then to forecast sales by the defined stage, is neither conscientious nor careful but a tautology. Wind and Claycamp (1976) indicated that PLC neglects important variables affecting sales, such as firm’s marketing activities competitive reactions, and other relevant environmental factors. Dhalla and Yuspeh (1976) proposed that managers may mistakenly believe that the product has entered an early decline when they are not satisfied with sales conditions, leading them to miss innovation opportunities; PLC, thus, is a very dangerous tool for managers.
Tellis and Crawford (1981) claimed that PLC describes the actual state of biology, that is, all organisms experience birth, growth, maturity, and decline over time, which is an already quelled process as time passes; however, it is an over-simplified model used in the development of marketing products. They further proposed PEC to interpret product growth and diffusion from a biological point of view, which expresses a dynamic continuous changing process. The term “product” does not have fixed characteristics and specifications, but is a series of continuously progressing and changing groups (Chandrasekaran and Tellis, 2007).
Product evolution mainly includes four changes. They are (1) cumulative change, which involves aggregated product evolution where the product progresses step by step
- - 7
on the basis of prior successful experiences; (2) motivated change, wherein three forces contribute to the products’ continued evolution, namely, general power (managers’ or entrepreneurs’ creativity), selective power (the market composed of consumers and competitors that affect sales), and intermediary power (such as government or other agents); (3) directed change, which are the linear results of changing, so that products will be more efficient, complex, and progressive through evolution; and (4) patterned change in which product evolution models are developed from five radiation models in biology—cladogenesis, anagenesis, adaptive radiation, stasigenesis, and extinction. These models are divergence (new product is not entirely a new concept but a combination of existing products or technologies and departs from the existing product line), development (new products constantly revised to meet the consumers’ needs with a rapid increase in sales), differentiation (successful products on the market will be adjusted to satisfy different consumers’ needs), stabilization (only minor changes in products, including packaging and trading services), and demise (sales are down and the product cannot remain in the market when it does not meet consumer expectations), respectively.
The empirical study by Holak and Tang (1990) is the first to deal comprehensively with PEC. They studied the value of evolutionary cycles and assessed the influence of three evolutionary forces (general, selective, and intermediary force) on the relevant product. As discussed above, products in PLC show single and fixed characteristics while PEC assumes that products are continually evolving and generally based on an original model to which new functions or attributes are added. Product variant of the MP3 music player for example is purely different due to its capacity, color, and mode (or type); the actual launch time in the market did not show the clear patterns of introduction, growth, maturity, and decline stages.
2.2 Compromise Effect
Huber et al. (1982) proposed that consumers’ choices are influenced by the related characteristics of different program choices. These effects are called context effect. In consumers’ considered choice set, the probability that a certain product will be optioned increases if a decoy product is introduced to this set. Simonson (1989) assumed that consumers will attempt to find the best reasons for selecting a specific product in different product option programs. Three results for the prediction of compromise effect
- - 8
and interpretation of attraction effect were obtained: (1) the market share of the alternative will increase while there exists a compromised alternative in the product choice set; (2) the influence of attraction and compromise will be greater when consumers want to rationalize their and other people’s decision; and (3) the option of a dominant brand and a compromise brand is related to complex decisions.
Simonson and Tversky (1992) agreed that consumers’ choices are influenced by their context effect (consumers’ considered choice set). They addressed two hypotheses related to the choice set: (1) the tradeoff contrast: consumers compare certain product attributes when they proceed to make a selection in a particular set; different results will be generated under different comparison baselines; (2) extremeness aversion: consumers fear an extreme choice since they wish to avoid an extreme choice outcome when there is no explicit preference, causing them to select products with more moderate attributes. Kiverz et al. (2004) established a theoretical mechanism for the influence factor of compromise effect. They suggested investigating whether joining the compromise effect to previous consumers’ choice models would yield better prediction ability. The advantage of this model is the use of a single reference point; this can be helpful for market analyzers in drafting a product launch strategy and in increasing the attraction of a specific product. In addition, the compromise effect can systematically influence consumers’ choice under a larger product set. To generalize the concept of compromise, it has the same meaning as consumers’ being loss averse and the concavity of their consideration set (they would prefer the middle commodity).
2.3 Brand Attraction
Previous studies presented the multi-dimensional view on the definition of brand attraction. Srivastava and Shocker (1991) indicated that the connotation of brand equity derives from a multi-dimensional concept of brand attraction and brand value; brand attraction is further denote performance-profitability, life-weaknesses, and scalability-growth potential. Francois and MacLachlan (1994) considered that brand attraction reflects firms’ and competitors’ actions taken previously and discussed the attraction by dividing them into internal (essential) and external (nonessential) points of view. Internal perspective includes consumers’ long-term experience of a particular brand; external perspective is short-term stimulus, such as the ability of a specific brand to resist a competitor’s price reduction behavior (cross-elasticity), which may involve the market
- - 9
share or sales reaction of a competitive firm implementing marketing tools. How both affect the brand health can be explored through internal and external perspectives.
Woodside and Walser (2007) provided a clear definition for brand attraction: a brand’s relatively greater attraction for consumers in comparison with other brands or the product attributes of a given brand. This implies the intensity of competitive brands is an inconsistent and relative concept. With reference to methods for measuring brand attraction, MacLachlan and Mulhern (1991) suggested questionnaire measurement and conjoint analysis through survey questionnaires in accordance with the existing and potential customers. Farquhar and Ijiri (1993) used the internal records as measures of brand strength from a business perspective. Kamakura and Russell (1994) suggested beginning with the transaction data of the existing market, such as supermarket scanner data.
2.4 Price Elasticity and Brand Competition-Analyzing
Price elasticity refers to the way in which the changes in a product’s market position (such as price or promotion) can be transformed to changes in sales or market share (Cooper, 1988). Cross-price elasticity means the sales change of another product resulting from the price changes of one product. Two products are substitutes if the cross elasticity is positive, whereas, they are complements if the cross elasticity is negative. Economists try to define consumer or market demand curves from the variation of price elasticity; marketing scholars also use it to study the market structure, and hence, extend its use to a variety of estimation methods.
Day, Shocker, and Srivastava (1979) analyzed the difference between data collected from subjective judgments and data obtained from real behavior: subjective judgments include cognition and preferences; purchasing behavior is the actual behavior (such as retail channel data). Research advocated measuring the brand transition probability and cross-price elasticity by actual behavioral data and observing the influence that the price change of a competing brand has on other flexible structures of a market-share attraction model. The competitive interaction model and multinomial-logit model were combined, focusing on the asymmetrical influence among brands in market share. The calculated cross-price elasticity could be used to position competing brands; it is a complete model for understanding the market structure through cross-price elasticity.
- - 10
Kamakura and Russell (1989) proposed the market response model of consumer heterogeneity and analyzed the market structure by calculated elasticity statistics. Shocker et al. (1990) addressed the importance of cross-price elasticity based on brand management, for the following reasons: (1) the relative degree of cross-elasticity can provide insights into the market structure and knowledge of possible substitutes considered by consumers; (2) it can be applied to measure brand power in price competition. Bucklin and Srinivasan (1991) suggested that the cross-price elasticity can be used to predict changes in sales volume when a particular brand adopts a promotion strategy. Russell (1992) proposed a latent symmetric elasticity structure model; the elastic matrix is assumed to be decomposed into two parts: symmetric alternative indicators (illustrating the competition intensity among brands) and brand coefficient (measuring the overall impact of a brand on its competitors). Symmetric substitution elasticity is applied with the multidimensional scaling method.
Recently, DeSarbo, Grewal, and Wind (2006) employed a space method to express a competitive market structure chart that assumes a correlation between brand distance and the degree of substitution of price changes. González-Benito et al. (2009) divided the cross-price effect in the market response model into two elements: (1) price changes of a brand will have different effects on the prices of other brands; and (2) the price of each brand will affect the competition brand. The asymmetric matrix derived from cross-price elasticity can be portrayed as a positioning map.
According to the above literature, the relative market share or relative sales of brands can be applied to define the brand attraction. This study utilizes the actual product sales to reflect a specific product attraction. A distributor’s transaction data is the basis for analysis; it belongs to existing market-related transaction information and can reflect consumers’ actual purchasing behavior; the product level analysis and discussion are based on the data in this study.
2.5 Spatial Science
Spatial statistical methods involve the analysis of geo-referenced data, when the relative locations of observations are important; that is, the locations are explicitly taken into account, especially relative ones (Heikkinen, 2011). They often include a map projection of a geographic region onto a plane and can also be applied in abstract spaces spanned by covariates. Researchers have applied this concept to model intra-household
- - 11
behavioral interaction and market basket selection (Boztuğ and Hildebrandt, 2003; Russel and Petersen, 2000; Yang, Zhao, Erdem, and Zhao, 2010).
Boztuğ and Hildebrandt (2003) tested whether products chosen on a shopping trip in a supermarket are an indicator of the preference interdependencies between different products or brands. They regarded the bundle chosen as an indicator of a global utility function in which the function related to a product bundle is the result of the marketing mix of the underlying brands. A multivariate logistic model was adopted that estimated by methods of spatial statistics. Comparing cross-nation buying behavior, they found strong effects for the cross-category variables, but only non-significant ones for the base variables such as price and time effect of purchases. The existence of global utility implies a cross-category dependence of brand choice behavior. The non-significant factor may have underlying methodological reasons or may be the result of cultural differences.
Yang et al. (2010) argued that quantitative models in marketing typically focus on the household as the unit of analysis while ignoring the individual family members’ behavior and the behavioral interactions among household members. The authors developed a model to capture multiple agents’ simultaneous choice decisions over more than two choice alternatives in the context of family members’ television viewing. They probed whether the television was on, what type of program was playing, and which family members were watching. In doing so, they estimated the individual’s intrinsic preference and the extrinsic preference from a joint consumption with other members. Auto-logistic choice model and hierarchical Bayesian were utilized to test group decision-making heuristics; the results show the behavioral interaction family members may exhibit in joint consumption occasions.
For single region spacial study, this single region represents a time interval as in time series or survival analysis (Heikkinen, 2011). If we focus on one specific product category, it can be said that there is a single market for products to compete. In an industry, potential entrants may decide to join this market. Market equilibrium is thought to be brought about by a pool of potential entrants, ready to enter if incumbent firms earn excessive profits (Klepper and Simons, 2000). Few studies have considered the implications of a company increasing product modes in its product line in order to provide consumers alternatives and to increase the possibility of choices. Research has
- - 12
not shown whether this can be a deterrent for all the market entrants or analyzed how product attributes affect product attractiveness and survival over the product’s evolution. We thus shed new light on the important aspects of market entry, and provide new insights on consumer behavior and marketing.
2.6 Competitive Entry
Barriers to market entry influence firms’ profitability by preventing new competitors from entering markets. The magnitude of barriers in deterring entry of competitors into markets is expected to vary by industries and stage of PLC (Gotz, 2002; Karakaya and Kerlin, 2007; Karakaya and Stahl, 1989; Yang, 1998). Research conducted by Karakaya and Kerlin (2007) focused on the importance of barriers to entry and examined the impact of different industries (biotechnology, waste management, pharmaceutical preparations, tobacco, and alcohol) and PLC stages. They proposed that both industry and PLC stages should be utilized as contingency factors in market entry strategy formulation, including the mode and timing of entry. Additionally, finances required for capital expenditures and competitiveness are important determinants of market entry decisions for potential market entrants.
Game theory of microeconomics has been applied to marketing. According to Varoufakis (2001), game theory can be defined as the analysis of rational behavior under circumstances of strategic interdependence, when an individual’s best strategy depends upon what his opponents are likely to do. Most firms produce more than one product. When a firm produces different products sold in different markets and the value of one product depends on the demand for the other, this type of dependence is referred to as cross-market network effect (Chen and Xie, 2007). It is widespread across many different industries in which firms provide multiple products to different sets of customers. Strauss (2000) asserted that a cross-market network effect affects the optimal prices of the two interdependent products in opposite directions: the stronger the cross-market network effect, the larger the difference in profit margins between the two products.
Cabral and Villas-Boas (2005) studied oligopoly price competition between multi-product firms whose products interact in their profit function. The main point of their research is that under certain conditions, inter-firm profit interactions lead to Bertrand supertraps. They proposed that the effect of price competition is so powerful
- - 13
that the strategic effect of competition on firms’ profits by an economic force may dominate its direct effect on profit that applies to a monopoly firm. That stronger economy of scope may lead to lower profitability for firms in competition if their products interact in profit functions.
Chen and Xie (2007) examined the impact of a cross-market network effect on firms’ competitive strategies. Their study paid special attention to the interaction between the cross-market network effect and asymmetry in customer loyalty. They considered two competing firms that differed in customer loyalty. Both firms sold two different but related products: a primary product and a secondary product. They extended their study to a two-period game under the interdependence of the two markets, whereby a profit in one market may be gained at the cost of the other and by the positive relationship between a larger loyalty segment and a higher opportunity cost of price competition in the product of the primary market. Results show that the entrant can outperform the incumbent if the incumbent’s feasible loyalty level is at a mid-level and the entrant has a low entry cost. This suggests that asymmetry in customer loyalty can be a source of first-mover advantage or disadvantage. A first mover may be at a disadvantage to the entrant in both profit and market share if its advantage in loyalty is neither sufficiently small nor sufficiently large.
This study discusses a single brand with related product cross-generations as it related to the concept of interdependence between different products. In the initial stage, disruptive innovation may occur to capture customers who do not possess the product. After that, a maintenance strategy is implemented to launch a better product in the existing market. An individual’s best choice depends upon what opponent alternatives he is likely to buy. Price competition in a product line also exists in the presence of the interdependence of products.
- - 14
3. The Proposed Model
3.1 Conceptual Overview
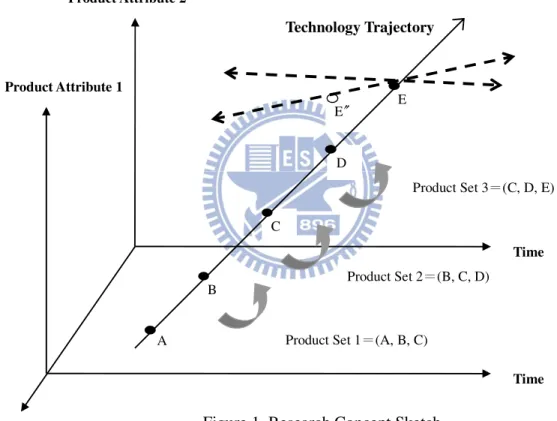
This study probes the effect of the price of different product modes belonging to a single brand category on the relative attractiveness of other products. We discussed several evolutionary stages for determining the structure of market competition. In addition to consumers’ choices among a product set, we also discuss innovation types in inter-generational products, attempt to determine the product evolution path, and then discuss the next generation development. The research concept is depicted in Figure 1.
Figure 1. Research Concept Sketch
The focus is on the dynamic of new product’s diffusion path. The general researches in diffusion usually use static viewpoint to investigate, few have discussed the dynamic complexity. We use multi-generation of intra-brand product with the implementation of spatial science to analyze the competition of products in each evolution cycle. Now let us assume that the considered set of chosen product choice is composed by product A, B, and C in the first generation. If consumer’s aversion for
E〞 Technology Trajectory E Product Attribute 2 Product Attribute 1 Product Set 2=(B, C, D) Product Set 3=(C, D, E) B D C Time
A Product Set 1=(A, B, C)
- - 15
losses is compromised, the probability of option B in product set {A, B, C} will be bigger than in set {B, C, D} of the second generation. Innovation, acceptance, and diffusion are related continuous processes; consumers’ compromise effect denotes that brands gain share when the one selected is the intermediate rather than extreme option. Consequently, the interaction between new products were assessed in each generation. Whether a decoy creates consumer compromise and extremeness aversion mentality was also detected.
With time and technological advancement, new-generation products are introduced into the market and end up competing with previous-generation products. According to the diffusion model of high-tech products by Norton and Bass (1987), a new product may not immediately become a huge success, with the sales growth being a gradual diffusion process. New-generation products may expand the company’s sales through better specifications, wider applications, and improved features, but may also cannibalize existing products’ sales.
How the product’s attribute influences each other’s product attractiveness over various generations was analyzed. Then the process and interaction among multiple products and the characteristic of products’ diffusion can be identified. The type of vertical or horizontal diffusion allows us to understand the path of technology’s trajectory. Under different diffusion rates, product development may move toward E or E〞(i.e., consumer choice not going for the latest product immediately, but after some time buffer), and then proceed on new trajectories, indicative of the varying new product developments. Combining discussions of consumer psychology and product physical attribute allows us to understand the nature of competition and the market evolution.
3.2 Joint-Space Mapping
In order to investigate the interaction between new products released on the market by a multi-products brand at different points in time, this study uses the logit-type market share model (González-Benito et al., 2009) for calculating the price competition index of each product. The competition index serves to calculate the cross-price elasticity in order to determine the relationship between changes in the relative attractiveness of products caused by changes in product prices. This contributes to define the directions toward which the consumer’s compromise tendency moves as
- - 16
technical progress. A technological trajectory can be represented by the movement of multi-products trade-offs cross over different generations, and the trajectory in the multi-generation space defined by these analyzed price and product attractiveness variables.
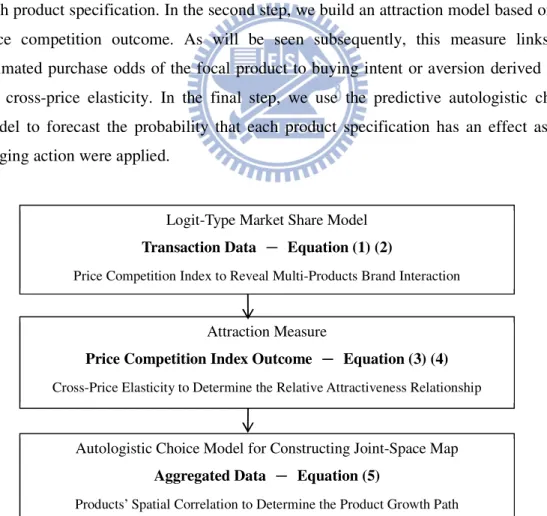
To take this one step further, we integrate the competitive interaction model of market sales and the autologistic model of spatial patterns to view the product’s intrinsic growth. The autologistic model is a flexible model for predicting the presence or absence of disease in an agricultural field on the basis of soil variables (Gumpertz, Graham, and Ristaino, 1997). This research applies it to marketing to analyze whether a product possesses attractiveness or not by considering products’ spatial correlation. As shown in Figure 2, the procedure involves three steps. In the first step, we construct a price competition index using the target product’s actual purchase histories by all customers for different generations. This analysis includes prices and sales volumes of each product specification. In the second step, we build an attraction model based on the price competition outcome. As will be seen subsequently, this measure links the estimated purchase odds of the focal product to buying intent or aversion derived from the cross-price elasticity. In the final step, we use the predictive autologistic choice model to forecast the probability that each product specification has an effect as if a tugging action were applied.
Figure 2. Conceptual Overview of Models
Logit-Type Market Share Model
Transaction Data ---- Equation (1) (2)
Price Competition Index to Reveal Multi-Products Brand Interaction
Attraction Measure
Price Competition Index Outcome ---- Equation (3) (4)
Cross-Price Elasticity to Determine the Relative Attractiveness Relationship
Autologistic Choice Model for Constructing Joint-Space Map
Aggregated Data --- Equation (5) -
- - 17 3.3 Mathematical Calculations
The logit-type market share model assumes that price is the determining factor in market share; the attractiveness of a particular product is the response variable. It splits the price cross-effects in the market response model into two elements: the first one is the changes in price of other products resulting from the changes in prices of a certain product; the second element is the interaction influence on all other competitive products caused by the price of each product. The subjects in this study are various products modes under a single brand from three generations, so as to transform the original relative attractiveness model among brands into products specially designated to a certain brand category. The analysis of the models is as follows:
' ( ) ( ) ( ') t t t j J A j j A j π ← =
∑
(1) ( ' ' ( ')) ' ( ) P jt j j J jj j j t A j e α + β ← ≠ = ∑ (2)where, πt( )j represents the relative attractiveness of productjin period t ; A jt( ) is
the attraction of product j in period t; α is the interior attraction of productj j
independent of price effects; βjj′stands for the price competition index of product j and
j′; and Pt j( )′ is the price of productj′in period t.
The relative attractiveness of product j in period t can be calculated by formula
(1), that is, the ratio of the attraction of product j in a certain time period to its
competing products’ attractiveness. The attraction of product j in a certain time period
is computed by formula (2); the attraction is divided into two parts: attraction of product
j itself without regard to prices and its attraction when influenced by prices. We focus
on the latter that discusses the price competition index of product jwhen its attraction
is caused by the prices of other existing products in the market.
The attraction model (2) used the logarithm and results in formula (3). The relationship of price and attractiveness can be found by regression estimates according to the products existing in the market at each stage. The price competition index from mutual influences of individual products was obtained, and then the cross-price elasticity from the price competition index was found using formula (4).
- - 18 ' ' ' ln ( ) ( ') J j j jj t j j t A j α ←β P j ≠ = +
∑
(3) '' ' ' '' ' ( , ') j J ( '') ( ') j j t t jj j j j j j p j δ β ← β π ≠ = − ∑
(4) where δ(jj′)represents the cross elasticity in product jand j′; πt( )j′′ is a delegate of the relative attractiveness of product j′′; and βj j′′ ′presents the price competition indexof product j′andj′′. The cross elasticity of productjandj′is due to the influence of the
price of product j′on the sales of productj, and subtracts the influence of the price of
productj′on other products’ attraction. Therefore, considering market competition into
consideration, deriving the cross elasticity, and discussing these products enables one to identify substitutes or complementary relationships through the elasticity.
In the autologistic model, the log odds of attraction in a particular quadrat (here meaning product mode or specification) are modeled as a linear combination of high or low attraction in neighboring quadrats as well as the price and memory variables. Neighboring quadrats can be defined as adjacent quadrats within a generation, quadrats in adjacent generations, quadrats two generations away, and so on. There are three features of the autologistic model that make it well suited to the study of spatial patterns of attractiveness: (1) it applies specifically to binary response variables such as high or low attraction; (2) explanatory variables can be incorporated into the model; and (3) the probability of high attraction in a quadrat depends explicitly on whether the neighboring plots are attracted.
Traditionally, logistic regression is often used to model nonspatial binary data (Gumpertz et al., 1997). This research incorporates spatial correlation into logistic regression models by modeling the probability of high attraction in a given quadrat (product mode) as dependent on the attraction status of neighboring quadrats. This method was originally developed by physicists to model an electron spin at each site in a magnetic field (Cressie, 1991). It has also been extended to ordered categorical data, such as disease ratings on a scale of 1 to 4 (Strauss, 1992); similarly, we rated a categorical scale of product memory attributes as independent variables since the marketing communication mechanism lies in capacity attributes, especially in regard to technology goods.
- - 19
1972). We applied and modified it as a first-order system includes only the four adjacent quadrats in the set of neighbors—two within the generation and two in adjacent generations; a second-order system includes the four diagonal neighbors in addition to the quadrats of the first-order system; a third-order system includes quadrats two generations or columns away, shown in Figure 3.
* * ×××× * * ○ * ○ * ×××× * ○ * ○ ◎ ○ * ○ ◎ * ×××× * ◎ ○ * ○ ◎ First-order from ×××× to * Second-order from ×××× to ○ Third-order from ×××× to ◎
Figure 3. Modified Standard Systems of Spatial Mapping
A set of products can be defined for each quadrat in the lattice; if quadrat i is a
neighbor of quadrat j, the converse is also true. For binary data, if the response at site i depends in a pairwise fashion on the observed number of neighbors with attraction
presence and on covariates, then the conditional probability of a particular response,
1
i
y = (high attraction) or yi =0 (low attraction), is as follows:
{
}
{
}
0 0 exp Pr( , , ) 1 exp i i r k ik i i j k j N j i i i j i r k ik j k j N j x y y y Y y x y j N x y β γ β γ = ∈ = ∈ + = ∈ = + +∑
∑
∑
∑
where the set of products of the ith site is denoted as Ni. Since yi takes the value
1 if the attraction is high, the log of the odds of attraction being present is expressed in formula (5). 0 logit(Pr( 1) , , ) i r i i j i k k ik j N j j Y = x y for j∈N =
∑
= β x +∑
∈ γ y (5)The first-order spatial dependence is when the spatial dependence is of the same magnitude down generations and across generations.
i j
j N∈ y
∑
is the sum of the number of high attractions in the four neighbors. The parameters β quantify the effects of the k- - 20
covariates given the attraction status of the neighbors. For instance, if price is a covariate, its parameter would measure the log of the increase in odds of high attraction that was due to increasing price, after accounting for the effect of attraction in any neighboring quadrats. This type of model has flexibility in that neighbors may be defined in any way that makes sense. If spatial correlation is present, the covariates alone are not sufficient to account for the observed spatial variability. In some settings, spatial correlations can be completely eliminated by regression on covariates. In the present application, however, attractiveness is actually spread or whittled away from one product to another, so it is likely that, even after considering the variables, the attractiveness status of the neighboring quadrats could be an important predictor of attractiveness presence.
3.4 Lifetime Distributions
As the study concerns the duration of product mode after market entry, and these products become competitive at different times, lifetime data analysis is proposed for attractive comparison. Assuming that T is a nonnegative lifetime random variable,
functions of T are summarized as follows:
Probability density function: f t( ), ∀ ≥t 0 (6)
Distribution function: 0 ( ) ( ) t F t =
∫
f x dx (7) Survival function: ( ) ( ) 1 ( ) ( ) t S t P T t F t f x dx ∞ = > = − =∫
(8) Hazard function: 0 ( ) ( ) lim t P t T t t T t h t t → ≤ < + ≥ = △ △ △ (9)Cumulative hazard function:
0
( ) ( ) t
H t =
∫
h x dx (10)Among these, survival function S t( ), which means the probability of a product
surviving to time t, is decreases monotonically. Hazard function h t( ) specifies the
failure probability during a very short interval of time, for example, from t to t+△t,
given that the product survives till time t. These functions can provide mathematically
equivalent specifications of the distribution of T. This means that if any of them are
known, the others are uniquely specified.
- - 21
not been observed, but is known to have occurred at certain interval. There are several types of censoring: (1) right censoring- the observed lifetime is less than or equal to the actual but unknown lifetime, in brief, not experiencing the event at the end or termination; (2) left censoring- the actual lifetime is less than that observed—this situation is encountered when experiencing the event before the start of study or when the only thing for sure is the event occurring at or before the observed time; (3) interval censoring- the event has occurred within an interval of time, but the exact time point is unknown.
Two methods can be employed to estimate the survival function. First, the life table method is a modification of the frequency table to deal with censored data and is a widely used method of portraying lifetime data. This method emphasizes estimation of the conditional probability of death in an interval given surviving to the start of that interval and the probability of surviving past the end of an interval. Assumptions for the life table method are as follows: (1) censored event times are independent of their real lifetimes; and (2) the censoring times and failure times are uniformly distributed with each interval. The second method is product limit estimate, also called Kaplan-Meier estimate. To obtain this estimate of survival, the lifetimes for those experiencing the specified event are first ranked in increasing order. If both censorings and failures occur at the same time, then the censorings are assumed to occur after the failure time. The Kaplan-Meier method assumes that all of the subjects with censored times were at risk at the time of the failures.
- - 22
4. Empirical Application
4.1 Industry Property and Data Sources
The target industry is that of the MP3 (MPEG-1 AUDIO LYER3) music player, a market that has already entered the saturation phase in a majority of developed countries. Following the first purchase, product sales become dependent on the consumers’ purchasing related, upgraded products or on discarding old products in favor of repurchase. Therefore, compared to PLC, using PEC can provide a more comprehensive perspective for understanding the interaction and competition among products in each evolutionary cycle. This understanding can provide a basis for determining the future development trends of products when formulating marketing strategies.
MP3 is a kind of digital audio encoding and destructive compression format developed by MPEG (Motion Picture Experts Group). It is designed to reduce the amount of audio data, filter out the voices that people cannot accept when listening to music. In applying psychological acoustics to determine whether the audio composition can be discarded, the MP3 format for music compression does not differ much from the CD format of music storage as far as the human ear is concerned. The first MP3 music player in the world was manufactured by Saehan Information Systems in Korea in 1998 and its subsequent product sales grew exponentially each year.
Currently, the globally competitive, major vendors in the market are Apple, Creative, Samsung, Sony, SanDisk, Microsoft, iRiver, etc. Industrial concentration is low. With the introduction of its iPod series products, Apple has achieved leadership; its global market share was 26.7% in 2007, and over 20% in 2009, whereas other manufacturers have less than 10% market share. In the US market alone, its market share was 70% in 2010 (Yoffie and Kim, 2010). Nevertheless, an analysis of the PLC of the global MP3 music player shows its introductory stage was from 1998 to 2001, at which time there were only a few R&D manufacturers; 2002 to 2006 saw the growth stage; in 2007, it matured, and since then, the growth rate has gradually declined and has become negative. Even with the economy’s rebound in 2010, market growth is still limited. It is predicted that the product will enter a decline in the future because of market saturation.
- - 23
market saturation, there will be further decline due to MP3 music phones absorbing most of the original market. As with personal computers, consumers’ first purchase will not be the main source of sales in the future; rather, product sales will depend on consumers purchasing related upgraded products or discarding old or damaged products in favor of repurchase. Firms must provide more powerful product features, for example, advanced wireless connectivity and high-end displays to attract consumers to buy the new products (iSuppli, 2008). At present, Apple, Samsung, Microsoft, and iRiver have adjusted their strategic direction to pursue the development of multimedia products; they no longer manufacture just the MP3 pure play music products but have introduced more polybasic PMP-related (portable multimedia player) products, using innovation to stimulate a market in which growth is limited.
The transaction data for Taiwan’s market leader is analyzed. Following the leading brand, MSI, Creative, and Panasonic have the sequence market shares. The analysis can be extrapolated to analyze the music industry. This research endeavors to examine MP3 products among which the brand in Taiwan was the leader, in the context of the global MP3 player’s industrial development, and then to explore the competition among various types of music players.
4.2 Database Description
This study probes the effect of the price of different product modes belonging to a single brand category on the relative attractiveness of other products. To measure the relative attractiveness of specific brand products, this study used existing data on market transactions. Using the database systems of certain distributors in Taiwan, 15 months of sales records on MP3 transaction data were collected: a total of 7,936 entries of observed data for 53,197 units sold. The authors analyzed the price competition among nine different product types launched on the Taiwan market by the leading brand. The influence of the prices of specific products on the sales of other products was used to reflect the relative attractiveness of this brand’s products. This study discusses the brand in three stages from the PEC perspective, and uses the research results to determine the structure of market competition.
- - 24
product memory, mode, buyers’ name, and purchasing time. Drafting the sales revenue and sales volume of all products with respect to selling time fails to show a simple-four cycle distribution of introduction, growth, maturity, and decline as expected in PLC. The survival time observed for each mode of product in the market is from 7 to 16 months; the shortest is for mode 720 (7 months from February 2005 to August 2005) and the longest is for modes 200 and 210 (both 16 months from December 2004 to February 2006). Meanwhile, although memory DRAM (dynamic random access memory) was expensive both before and after 2004, it can store more capacity, and the size of memory capacity, therefore, became the greatest force that pushed consumers to make purchases at that time (Yoffie and Kim, 2010). The follow-up products discussion is divided into three stages because makers of MP3 continue to introduce new products, as they have a short life cycle. To maintain the accuracy of the study estimates, the products are classified according to the PEC concept. The first phase of product specifications is 128/256MB, the second is 256MB products, and the third phase consists of 512MB, 1G, and 5G memory.
The average price and sales volume of each product specification according to PEC stages are displayed in Table 1. Firms adjusted the product price over time. Moreover, the total sales of existing products also change in the light of new product launches. Corporations use the product mode as their communication mechanism in advertising and promotion, while modes are prioritized according to memory capacity, and organized by their launch dates. Therefore, consumers’ purchases also depend on the order of mode, apart from the memory capacity.
Table 1. Product Price and Sale in Each PEC (Price Unit: NT dollar)
PEC Mode 110 120 150 102 180 130 200 210 720 First March to June 2004 Average Price 3327 4546 5348 Sales Volume 2674 3822 1384 Second July to Oct 2004 Average Price 3155 4061 5180 2950 4715 Sales Volume 2345 3594 694 650 1365 Third November 2004 to May 2005 Average Price 4407 2693 3700 3668 4835 3309 7578 Sales Volume 321 360 415 2319 4366 10583 68