國 立 交 通 大 學
生 物 資 訊 研 究 所
碩 士 論 文
哺乳類基因啟動區的調控因子整合性分析系統
RegProM : an integrated system for comprehensively
analyzing the regulatory elements of gene promoters in
mammalian genomes
指導教授:黃憲達 博士
哺乳類基因啟動區的調控因子整合性分析系統
(論文題目)
國 立 交 通 大 學
生物資訊研究所
碩 士 論 文
研 究 生:蔡燕茹
指導教授:黃憲達 博士
中華民國九十五年七月二十日
RegProM : 哺乳類基因啟動區的調控因子整合性
分析系統
學生: 蔡燕茹 指導教授 : 黃憲達 博士
國立交通大學 生物資訊所
摘要 座落在基因 5'端的啟動區在基因轉錄的調控上扮演重要的角 色,基因啟動區的序列跟結構上的特性影響著基因的轉錄初始化,雖 然目前已有不少的基因啟動區相關的註解系統,但是並沒有ㄧ個是可 以提供最完整的調控資訊,包含轉錄起始位置、轉錄子和轉錄子辨識 位置、CpG island、重複序列、ATA box、CCAAT box、 GC box、統 計上過度表現的寡核甘酸序列、單核甘酸多態性、DNA穩定性、GC含 量、微小核醣核酸靶位點。為了方便基因啟動區的分析,此研究發展 了一個整合性的系統,可以為哺乳類物種間(人類、大鼠、小鼠、狗、 黑猩猩)的同源基因提供詳盡的調控資訊,此系統不但可以為已知基 因的啟動區註解調控特性,也可以為使用者輸入的序列註解上可能的 轉錄起始位置跟調控特性。並且這些基因啟動區所註解後的調控性質 會 以 圖 形 化 的 方 式 呈 現 , 這 個 整 合 性 系 統 現 在 http://RegProM.mbc.nctu.edu.tw/。RegProM : an integrated system for
comprehensively analyzing the regulatory elements
of gene promoters in mammalian genomes
Student: Yen-Ju Tsai Advisor : Dr. Hsien-Da Huang
Institute of Bioinformatics, National Chiao Tung University
Abstract
Promoters located at the 5’ ends of genes play an important role in gene transcriptional regulation. The sequence and structural features located in the gene promoter region are involved in regulating gene transcriptional initiation. Although numerous systems have been proposed for annotating promoter regions, none of them provided the comprehensive regulatory features such as Transcription Start Site, Transcription Factor Binding Site (TFBS), CpG island, repeats (SINE, LINE, tandem repeats, and so on), TATA box, CCAAT box, GC box, statistical over-represented (OR) oligonucleotide, single nucleotide polymorphism (SNP), DNA stability, GC-content and microRNA target sites. To facilitate the investigation of the gene promoters, this work presents an integrated system for annotating the regulatory features in homologous gene promoter regions of mammalian genomes, including human, mouse, rat, chimpanzee, and dog. The proposed system not only provides the regulatory features for the known gene promoter region, but also annotates the putative TSSs and regulatory features for the user inputted sequence. Furthermore, regulatory features are graphically visualized to facilitate the observation of gene promoters. The proposed integrated system is now available at http://regprom.mbc.nctu.edu.tw/.
致謝
首先,我要感謝指導教授黃憲達博士和李宗夷博士在這兩年的 日子中對我細心指導,使我學會如何運用資訊工具發掘更多珍貴的 生物知識,也學會如何獨立研究並落實想法。 實驗室的博士班學長,李宗夷,黃熙淵,許博凱,徐唯哲,龔 維祥,學姐詹雯玲;以及碩士班同學林立人,許勝達,王威霽,林 在營;還有學妹任冠樺,學弟洪瑞鴻、邢恆嘉,感謝你們對我的指 導與協助以及鼓勵,我會珍藏和大家一起努力克服困難、享受工作 與成果及談心玩樂的時光。 最後,我要特別感謝我的家人給予的支持,尤其是我的父母與 我的弟弟與妹妹,總是包容與鼓勵我,更是支撐我完成學業的重要 精神支柱。 能夠順利完成碩士論文並取得碩士學位,是所有人的功勞,謹 在此誠摯地感謝大家,將這份喜悅及成果與關心我的所有人一同分 享。 國立交通大學 生物資訊研究所 發現生資實驗室 研究生 蔡燕茹 謹誌於交通大學 2006 年六月Table of Contents
摘要...i
Abstract...ii
Table of Contents ...iv
List of Figures...vi List of Tables...vii List of Tables...vii Chapter 1 Introduction ...1 1.1 Background...1 1.1.1 Gene Transcription...1 1.1.2 Regulatory Features ...8 1.1.2.1 CpG Island ...9 1.1.2.2 DNA Stability...11
1.1.2.3 siRNA and microRNA Target Sites ...13
1.2 Motivation...16
1.3 Goal...16
Chapter 2 Related Works ...18
2.1 Transcription Start Site Databases ...18
2.1.1 Eukaryotic Promoter Database (EPD) ...18
2.1.2 Database of Transcription Start Sites (DBTSS)...19
2.2 Transcription Factor and Binding Site Database ...20
2.3 Promoter Annotation Systems...21
2.3.1 PromoSer...21
2.3.2 MpromDb...22
2.3.3 DoOP...24
2.3.4 CORG ...24
2.3.5 TiProD...25
2.4 Promoter Prediction Programs...27
2.4.1 NNPP2.2 ...27 2.4.2 Eponine ...28 2.4.3 CpGProD...29 2.5 Related Software...30 2.5.1 BLAST...30 2.5.2 ClustalW ...30 2.5.3 FootPrinter ...31 2.5.4 miRanda ...31
Chapter 3 Materials and Methods...33
3.1 Materials ...33
3.1.1 Genome Databases...33
3.1.2 Transcription Start Site Databases ...33
3.2 Methods...35
3.2.1 Promoter Extraction ...36
3.2.2 Transcriptional Regulatory Features Annotation ...37
3.2.3 Comparative Gene Promoter Analysis...46
3.2.4 Graphical Visualization of Regulatory Features ...48
Chapter 4 Results ...49
4.1 The Statistics of Regulatory Features in RegProM...49
4.2 Web Interface ...55
4.3 Case Studies ...59
4.3.1 Identifying Novel Regulatory Elements for Genes...60
4.3.2 Identifying Regulatory Elements for miRNA Genes ...61
4.3.3 Identifying Conserved Regulatory Elements in Homologous Gene Promoters ...64
4.3.4 Identifying Co-occurring Regulatory Elements...65
Chapter 5 Discussions...66
5.1 Comparison ...66
5.2 Future Works...67
Chapter 6 Conclusions ...69
List of Figures
Figure 1.1 Control elements for gene transcription [5]...2
Figure 1.2 Transcription factors and the basal machinery [5]...2
Figure 1.3 Covalent modification of histone tails and Regulation of gene transcription [6]...4
Figure 1.4 Chromatin-remodeling enzymes facilitate multiple steps during gene activation [9]...6
Figure 1.5 DNA methylation and regulation of gene transcription [10]. ...7
Figure 1.6 CpG island and Regulation of gene transcription [15]. ...10
Figure 1.7 The calculation of DNA stability. ... 11
Figure 1.8 The example of free energy computation. ...13
Figure 1.9 The gene silencing of siRNA and microRNA (Hiroaki Kawasaki & Kazunari Taira, 2004). ...15
Figure 2.1 The comparison between the cloning method and the oligo-capping method. ...19
Figure 3.1 The system flow of RegProM...35
Figure 3.2 Distributions of average free energy of DNA duplex formation in human and mouse promoters. ...45
Figure 4.1 The submission interface of RegProM. ...55
Figure 4.2 An example of the RegProM search results...56
Figure 4.3 The gene annotation and the alternative TSSs of gene...57
Figure 4.4 The visualization of the regulatory features within gene promoter region...58
Figure 4.5 The regulatory features conserved in homologous gene promoters. ...59
Figure 4.6 Graphical view of regulatory elements...61
Figure 4.7 The annotated regulatory features for miRNA gene...63
Figure 4.8 The regulatory features conserved in homologous gene promoters. ...64
Figure 4.9 The phylogenetic footprinting of homologous gene promoter sequences. ...65
List of Tables
Table 3.1 Supported regulatory features in RegProM. ...37 Table 3.2 The lists of TATA box, CCAAT box and GC box with positional
densities [45]...41 Table 3.3 Statistics of homologous genes...47 Table 4.1 The statistics of known genes, pseudogenes, and miRNA genes.
...49 Table 4.2 Statistics of experimentally transcription start sites from Ensembl, DBTSS and EPD...50 Table 4.3 Statistics of TFBSs, TFs, and genes encoding TFs. ...51 Table 4.4 Statistics of CpG islands...52 Table 4.5 Statistics of Repeats in human, mouse, rat, chimpanzee, and dog.
...52 Table 4.6 Statistics of SNPs in human, mouse, rat, chimpanzee, and dog. .53 Table 4.7 The statistics of putative miRNA target sites. ...54 Table 5.1 Compariing RegProM with other gene promoter annotation
Chapter 1 Introduction
1.1
Background
The regulation of gene transcription plays important roles in many biological processes. Gene transcription is regulated by transcription factors (TFs), which bind to the specific DNA regulatory element, i.e., transcription factor binding site (TFBS) [1]. Promoter, the genomic sequence immediately upstream of the transcriptional start site defined by the 5'-end of an mRNA, is presumed to bind the transacting factors required to transcribe the gene [2]. It reports that different features in the promoter region promote regulatory diversity, such as single nucleotide polymorphism (SNP) [3], repetitive DNA [4], and so on. Because of the abundant gene regulation features possible involving in the gene transcriptional regulation, it is critical to integrate the information of these regulatory features within the gene promoter to facilitate the analysis of gene regulation.
1.1.1
Gene Transcription
The process of gene produce a RNA molecule is called gene transcription. Gene is expressed by transcription from DNA to mRNA and followed by translation from mRNA to protein. Control of transcription initiation is the most important mechanism in gene
expression for determining whether most genes are expressed and how much of the encoded mRNAs and consequently proteins are produced.
Figure 1.1 Control elements for gene transcription [5].
Figure 1.2 Transcription factors and the basal machinery [5].
specific DNA-binding proteins, termed transcription factors (TFs) or regulators, and regulatory DNA sequences, termed transcription factor binding sites (TFBSs) or regulatory elements. Regulatory elements are usually located within the promoter - that is, the DNA sequence immediately upstream of the transcriptional start site defined by the 5'-end of an mRNA.
Recent studies reveal that gene transcription is controlled by the specific-binding between the proximal promoter element or distal promoter element. As shown in Fig. 1.1, they are referred to proximal enhancer or distal enhancer and transcription factors such as specificity protein-1(Sp1), families of activator protein (AP1), CCAAT-enhancer binding protein (C/EBP), steroid receptors (i.e., glucocorticoid or GR) and tissue-specific transcription factors (i.e., NF-κB) (Fig. 1.2). Besides, the formation of the pre-initiation complex (PIC) and defines transcription start site is directed by the TATA-box recognized by TATA-box binding protein (TBP), followed by the interplay of general transcription factors (TEIIA, TFIIB, TFIID, TFIIE, TFIIF, TFIIH) and RNA Polymerase II with core promoter element like TATA-box, the initiator (INR) and the downstream promoter element (DPE) [5, 6].
Furthermore, the structure of eukaryotic core promoters is more complex than prokaryotic core promoters and the eukaryotic promoters contain a variety of sequence motifs, for example TATA box, CCAAT box,
GC box and INR box [7]. Therefore, some other biological signals can be also considered for the analysis of the core promoters, including the presence of CpG islands, the occurrence of the transcription factor binding sites, the statistical nucleotide properties of proximal and core promoters, and the orthologous gene core promoters [8]. We introduce these regulatory features within the gene core promoter in the Section below.
Figure 1.3 Covalent modification of histone tails and Regulation of gene transcription [6].
Additionally, gene transcription is affected by chromatin structure formed because eukaryotic DNA sequences are associated with histone
protein. The basic structural unit of chromatin is the nucleosome, which is composed of about 147 bps of DNA wrapped tightly around a disk-shaped core of histone proteins. The covalent modifications, such as acetylation, methylation and phosphorylation of the specific residues in the histone tails for example can control chromatin condensation. As shown in Fig. 1.3, the acetylation of the lysine residue in histone tails by histone acetyltransferases (HATs) result in relaxation of the nucleosomes by reducing the binding force between the positively charged histone tails and the negatively charged phosphate backbone of DNA. The transcriptional factors recruit HATs for relaxing nucleosome to facilitate their access to the promoter DNA in the condensed chromatin so as to activate gene expression. In the otherwise, the deacetylation of histone tails catalyzed by hisone deacetylases (HDACs) can prevent the access of TFs to their binding site, so that gene expression is repressed [6].
Figure 1.4 Chromatin-remodeling enzymes facilitate multiple steps during gene activation [9].
Figure 1.4 illustrates that the order of steps on the pathway to transcription initiation at a specific promoter appears to be different for different promoters. For example, a group of TFs bind to the human IFN-β gene promoter recruit histone acetyltransferases (HATs), aceylated histone promotes chromatin-remodeling enzyme SWI/SNF to remodel the chromatin structure to facilitate completion of pre-initiation complex (PIC) assembly (Fig. 1.4(B)). Whereas the order of the assembly of PIC complex and the binding of TFs at the human α1-AT gene promoter is
behind the requirement of the HATs and the chromatin-remodeling enzyme (Fig. 1.4(C)) [9].
Figure 1.5 DNA methylation and regulation of gene transcription [10].
Covalent modification of DNA is another factor that may also cause gene silencing by means of compacting chromatin [10]. The only known epigenetic modification of DNA in mammals is methylation of cytosine at position C5 in CpG dinucleotides [11]. Epigenetic modification of DNA are coupled to gene expression silencing through four models [10]. First, DNA methylation can directly repress gene transcription by blocking TFs from their binding site (Fig. 1.5(a)). Secondly, methyl-CpG binding proteins (MBPs) recognize methylated DNA and recruit co-repressor to form condensed chromatin structure for repressing gene directly (Fig. 1.5(b)). Thirdly, DNA methyltransferas (DNMTs) could silent gene expression both directly by act as transcription repressor or co-repressor of other transcription repressor and indirectly through epigenetic modification of cytosine. And DNMT-mediated silencing seems to rely
on chromatin modification by interacting with HADCs and histone methyltransferases (HMTs) (Fig. 1.5(c)). Fourthly, if intronic or exonic DAN is methylated by DNMTs, gene can also be silenced (Fig. 1.5(d)) [10].
1.1.2
Regulatory Features
The structure of eukaryotic promoters is more complex than prokaryotic promoters and they have several sequence motifs, for example TATA box, CCAAT box, GC box, and INR box [7]. Therefore, some concepts are also used to analyze the promoter, including the presence of CpG islands close to the transcription start site, the occurrence of transcription factor binding sites, the statistical nucleotide properties of proximal and core promoters, the orthologous gene promoters and restricting the promoter region from using information from mRNA transcripts [8].
This work develops an integrated system for comprehensively annotating the regulatory features, including transcription start sites, 5’-end exon position, transcription factor binding sites, CpG islands, repeats (LINE, SINE, Alu and tandem repeat), TATA box, CCAAT box, GC box, statistically over-represented oligonucleotide and single nucleotide polymorphism (SNP) of known gene promoters. Furthermore, the GC content (GC%), DNA stability and microRNA target sites [12] are
also provided to enable advanced analysis of promoter regions.
1.1.2.1
CpG Island
CpG islands are short regions , greater than or equal to 500 bps in length , with a higher density of CpG di-nucleotides than genome average -that is, G+C content is above 50% and observed CpG/expected CpG ratio is greater than or equal to 0.6. Also, CpG islands are often located within the 5’ promoter of housekeeping genes, sometimes overlapping the coding region of the coding region to variable extent (usually the first exon) [13]. Although enriched in CpG di-nucleotides, the best substrates for DNA methyltransferase, CpG islands are found to be unmethylated when the transcription of the gene associated with them is active and is inhibited when these regions undergo methylation. However, in normal mammalian cells, methylation of CpG islands play important roles in governing X-chromosome inactivation, maintaining imprinted genes, and in some cases determining the cell-type-specific expression patterns of genes. Moreover, CpG island methylation is critical for repressing tumour suppressor genes during the development of cancer [14].
Figure 1.6 CpG island and Regulation of gene transcription [15].
unmethylated and resided in chromatin composed of widely spaced ncleosomes with acetylated histones, so as to facilitate transcription-activating complex accessible to the promoters. Otherwise, the CpG-rich promoter is hypermethylated in a cancer cell (Fig. 1.6(b)), and gene is silenced though the MBPs-recognizing methylated DNA and MBPs-recruiting co-repressors to form condensed chromatin structure for silencing gene.
1.1.2.2
DNA Stability
Figure 1.7 The calculation of DNA stability.
(The figure is obtained from http://www.albany.edu/~achm110/dnastability.html)
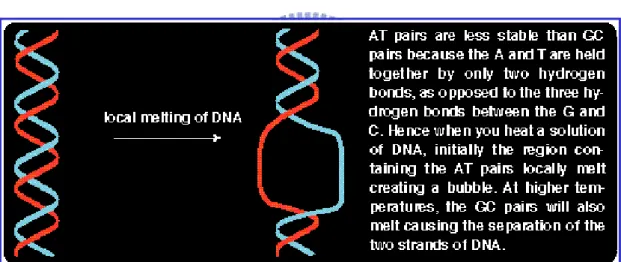
Aditi Kanhere et al. [16] devised the assessment of DNA stability, for prokaryotic promoter prediction. As shown in Fig. 1.7, the DNA stability is viewed as the structural property of the fragment of the DNA duplex, which is calculated based on determining the minimum free energy of the duplex folded by the hydrogen bond of the A-T and C-G pairs.
SantaLucia et al. [17] used the unified standard free energy of ten di-nucleotides duplexes, such as AA/TT, AT/TA, TA/AT, CA/GT, GT/CA, CT/GA, GA/CT, CG/GC, GC/CG and GG/CC [17] (See Appendix, Table S1), to calculate the standard free energy change of a DNA oligonucleotide based on di-nucleotide composition. The standard free energy change ( ) corresponding to the melting transition of an ‘n’ nucleotide (or ‘n-1’ di-nucleotides) long DNA molecule, from double strand to single strand, is calculated as follows [7]:
0 37 G Δ
∑
− = + Δ + Δ + Δ − = Δ 1 1 0 1 , 0 0 0( ) ( ) n i i i sym ini G G G total Gwhere, denotes two types of initiation free energy : “initiation with terminal G⋅C” and “initiation with terminal A⋅T”; is +0.43 kcal/mol and is applicable if the duplex is self-complementary, and
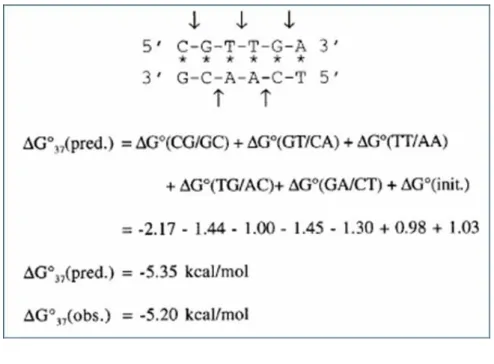
represents the standard free energy change for type ij dinucleotide. Table S1 lists the standard free energy changes for ten Watson-Crick types ij. In the present calculation, each promoter sequence is divided into overlapping windows of 15 bp (or 14 dinucleotide steps), and for each window the free energy is calculated as shown above. The example of free energy calculation is shown in Fig. 1.8.
0 ini G Δ 0 sym G Δ 0 , j i G Δ
Figure 1.8 The example of free energy computation.
This study applied the equation of standard free energy change (mentioned in the Appendix) to calculate the stability of DNA duplex with window size = 15 nt, sliding from -1000 to +201 of TSS in the DBTSS human and mouse experimentally determined promoters. Aditi Kanhere et al. [16] demonstrated that the change in DNA stability appears to provide a much better clue than the usual sequence motifs. Therefore, this work provides the DNA stability of the promoter region to enhance the promoter identification.
1.1.2.3 siRNA and microRNA Target Sites
Morris et al. [18] reported that small interfering RNA (siRNA) and microRNA (miRNA) silencing gene transcription associated with DNA methylation of the target sequence (as shown in Fig. 1.9), and
demonstrated that siRNA-directed transcriptional silencing is conserved in mammals, enabling the inhibition of mammalian gene function. The miRNA and siRNA pathways overlap at several points. Both siRNAs and miRNAs are processed from double-stranded RNA precusors requiring dsRNA-specific Rnase III enzymes [19]. The microRNAs (miRNAs) are first discovered in C. elegan and regulate developmental stage. Currently, 44 species are found to produce miRNAs, not only in Eukaryotes, six virus species are also evidenced. More and more miRNAs are discovered, and have been shown to play important roles in a number of organisms at the level of development, apoptosis, and establishment of cell lineage.
MicroRNA genes are one of the more abundant classes of regulatory genes in animals, estimated to comprise between 0.5 and 1 percent of the predicted genes in worms, flies, and humans, raising the prospect that they could have many more regulatory functions than those uncovered to date. The miRNAs are derived from precursor transcripts approximately 70–120 nt long sequences, which fold to form as stem-loop structures. These structures are believed to be recognized and taken out of nucleus by exportin 5. Pre-miRNA is then cleaved by Dicer (a ribonuclease III enzyme) to excise the mature miRNAs in the form of a small interfering RNA (siRNA) -like duplex, and asymmetrical assembly of the mature miRNA strands, which may be decided upon relative thermodynamic characteristics of the two 5 termini of strands, combining with the
Argonaute proteins into effector complexes.
There are two ways to regulate gene expression: the common situation in plants, mRNA may be degraded when miRNA: mRNA perfectly complementary. In other situation, always in animals, non-perfect complementary targeting caused translational repress. The miRNAs appears to modulate methylation in chromatin level to silence chromatin, but this only occurs in yeast, some animals and plants. The miRNA gene profiles are extracted from miRBase [20], and been used to detect the miRNA target sites. The system integrates miRanda [12], to detect the microRNA target sites associated with two major parameters, the Minimum Free Energy (MFE) cutoff and score cutoff.
Figure 1.9 The gene silencing of siRNA and microRNA (Hiroaki Kawasaki & Kazunari Taira, 2004).
1.2
Motivation
Gene promoters located at the 5’-ends of genes play an important role in gene transcriptional regulation. Although numerous systems have been developed for identifying promoters of genes, none of them provide a comprehensive annotation of regulatory features in the promoter regions which they identify. Especially, the alternative promoters of one gene should be proposed because the multiple transcripts with different transcription start sites of the gene are obtained. Moreover, the conserved regulatory elements of orthologous genes among various species should be provided for further cross-species promoter analysis.
1.3 Goal
This work developed an integrated system, namely RegProM, for comprehensively annotating the regulatory features, including transcription start sites, 5’-end exon position, transcription factor binding sites, CpG islands, repeats (LINE, SINE, Alu and tandem repeat), TATA box, CCAAT box, GC box, statistically over-represented oligonucleotide, and single nucleotide polymorphism (SNP) of known gene promoters. Furthermore, the GC content (GC%), DNA stability and microRNA target sites [12] are also provided to enable advanced analysis of promoter
regions.
The cross-species analysis of the homologous gene promoter sequences is performed by CLUSTALW [21], a multiple sequence alignment program. Through the conservation of promoter sequence among the five genomes, the conserved regulatory features can be observed and they may have a greater influence on the transcription regulation. Furthermore, this work integrates a phylogenetic footprinting method, namely FootPrinter [22], that identifies putative regulatory elements in DNA sequences that are unusually well conserved across a set of orthologous sequences. Following the annotation, the regulatory features are represented via visualization. The system not only enables the annotation of comprehensive regulatory features in known gene promoters, but also helps determining the promoter regions and annotating the regulatory features in user inputted sequence.
Chapter 2 Related Works
In this Chapter, some related databases of transcription start sites and TF binding sites are introduced over here. Moreover, the related programs that used in this study are introduced following.
2.1 Transcription Start Site Databases
The information of exact transcriptional start sites (TSSs) of genes is valuable in many ways; it can be used to make the prediction of TSSs more accurate and the analysis of upstream regulatory regions (promoter) more precise [23]. Eukaryotic Promoter Database (EPD) [24] and the Database of Transcriptional Start Site (DBTSS) [23] are the published databases containing the experimentally promoter sequences.
2.1.1 Eukaryotic Promoter Database (EPD)
EPD1 is an annotated, non-redundant collection of eukaryotic Pol II promoters, for which the transcription start site has been determined experimentally. Furthermore, EPD is structured in a way that facilitates dynamic extraction of biologically meaningful promoter subsets for comparative sequence analysis. EPD is a collection of 4,810 eukaryotic POL II promoters. Tools for analyzing sequence motifs around TSSs
defined in EPDare provided by the signal search analysis server.
2.1.2 Database of Transcription Start Sites (DBTSS)
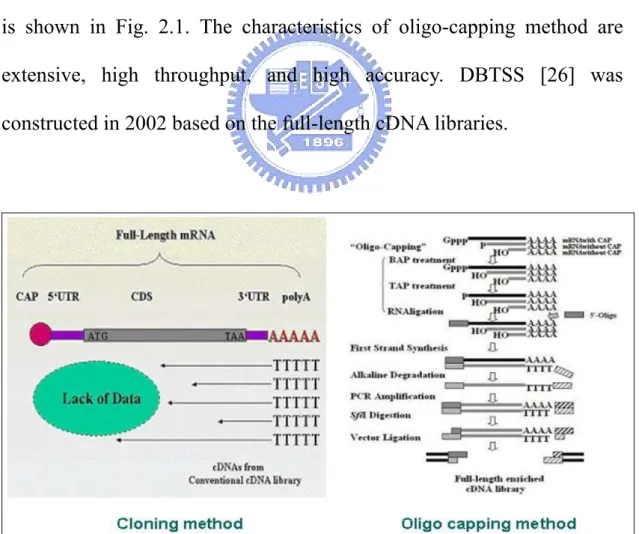
DBTSS was first constructed in 2002 based on precise experimentally determined 5'-end cDNA clones by oligo-capping method [25]. DBTSS now provides the information about the potential alternative promoters because the number of 5'-end cDNA clones is sufficient to determine several promoters for one gene by clustering TSSs within a 500 bases interval. The different between cloning method and oligo-capping method is shown in Fig. 2.1. The characteristics of oligo-capping method are extensive, high throughput, and high accuracy. DBTSS [26] was constructed in 2002 based on the full-length cDNA libraries.
Figure 2.1 The comparison between the cloning method and the oligo-capping method.
DBTSS2 is a collection of transcriptional start sites and adjacent promoters, which are experimentally determined by intensive analyses of full-length cDNAs. In order to extract biological insight from the compiled sequence information, search engines for putative transcription factor binding sites are implemented. Also, for molecular evolutionary studies of the transcriptional regulations, detailed sequence alignments of the promoters between human, mouse and other model organisms are provided. The positional information of the TSSs, sequences of the promoters and related information can also be downloaded in flat file form from the download site. The current release of DBTSS (5.1) contains TSS information of 15,262 and 14,162 genes determined by 1.4 and 0.4 million cDNAs in humans and mice respectively.
2.2 Transcription Factor and Binding Site Database
Gene transcription is regulated by transcription factors (TFs) binding mostly and specifically to the promoter region which is the so called transcription factor binding sites (TFBSs). Many experimentally identified TF binding sites have been collected in TRANSFAC [27], which is the most complete and well maintained database of TFs, their genomic binding sites and DNA-binding profiles. The experimentally identified TF bind sites were obtained from TRANSFAC (8.3), which
contains 5,711 transcription factors and 14,406 binding sites. In the system, 4,206 known binding sites are matched to upstream regions of human, mouse, rat, chimpanzee, and dog genes.
A program, namely MATCH [28], was implemented to scans the transcription factor binding site in an input sequence using the transcription factor binding profiles of TRANSFAC. Two important parameters of MATCH, core score and matrix score, represent the sequence matching score of core region and whole region of binding site, respectively. The known TF binding sites are used to scan the input sequence in both strands, and the positions of each known site homolog are then displayed in the graphical visualization.
2.3
Promoter Annotation Systems
Various integrated systems have been proposed that store the gene promoter related information, such as PromoSer [29], MPromDb [30], DoOP [31], CORG [32], and TiProD [33].
2.3.1
PromoSer
PromoSer [29] is a large-scale mammalian promoter and transcription start site identification service by considering alignments of a large number of partial and full-length mRNA sequences to genomic DNA, with provision for alternative promoters of human, mouse, and rat
genes. PromoSer collects human, mouse, and rat genome data from UCSC genome browser[34], all available TSS flanking sequences from EPD, all EST and non-EST mRNA sequences from GenBank and RefSeq[35], and full-length cDNA from RIKEN[36] and DBTSS. PromoSer uses a local alignment tool named BLAT[37], to align mRNA sequences and non-EST sequences to corresponding genomes and to localize to specific chromosomal regions. After combing overlapping alignments in the same orientation, 37,572 human clusters, 39,470 mouse clusters, and 15,915 clusters are obtained.
PromoSer finds that at least 63% for human, 58% for mouse, and 17% for rat RefSeq entries could be further extended toward the 5’ end. The upstream shift of TSS position on the chromosome averaged 16,981 bases for human, 6,801 bases for mouse, and 8,880 bases for rat, and the average number of sequences overlapping an extendable RefSeq is 123 for human,47 for mouse, and 14 for rat. Besides, PromoSer also reports alternative promoters if multiple TSS positions > 20 bp apart are found.
2.3.2 MpromDb
MPromDb [30] is a mammalian promoter database that integrates gene promoters with experimentally supported annotation of transcription start sites, cis-regulatory elements, CpG islands and chromatin immunoprecipitation microarray (ChIP-chip) experimental results with
intuitively designed presentation. MPromDb collects human and mouse promoter from EPD and DBTSS and full-length 5’-UTRs from 5’-UTR database[38]. Also, MPromDb retrieves experimentally supported first exons, full-length mRNAs, full-length 5’-UTRs, and promoter sequences by parsing GenBank records derived from keyword search. MPromDb maps these sequences to corresponding genome sequences by BLAT. MPromDb stores 19,170 promoters for 15,616 human genes, 15,953 promoters for 14,157 mouse genes, and 1,284 promoters for 1,234 rat genes. Besides, 22% of human genes and 12% of mouse genes have two or more alternative promoters.
MPromDb also collects experimentally supported cis-regulatory elements derived from comprehensive parsing GenBank records. In addition, the TF-binding sites are extended 100 bases on either side to map onto corresponding gene promoters. There are 2,027 TF-binding sites for human, 1,181 sites for mouse, and 531 sites for rat and these sites are corresponding to 224 TFs. Moreover, MpromDb stores two kinds of ChIP-chip microarray data to annotate corresponding gene promoters. One is the CGI clones of CGI array available from the UHN Microarray Center[39] and consists of 12,192 clones (Sanger 12k set).The other one is the probes of Agilent promoter array initially developed by Rick Young's group at MIT [40, 41] and consists of 68,704 oligonucleotide probes representing the upstream regions of 17 054 NCBI
RefSeq mRNAs .
2.3.3
DoOP
DoOP [31] is a database of orthologous promoters, collections of clusters of orthologous upstream sequences from chordates and plant, aiming to facilitate the recognition of regulatory sites conserved among species.DoOP chooses the human and Arabidopsis thaliana as reference species for chordate and plant, respectively .They make use of NCBI gene annotation[42] for retrieving sequences of first exons or the first two exons of genes as query sequences in BLAST search to create clusters containing orthologous sequences from different species.
Afterward DoOP draws on the 500, 1000, 3000 bps upstream sequences of above orthologous clusters, that is orthologous promoter sequences, for making a multiple alignment with the program DIALIGN[43] to create consensus sequences and to search for conserve motifs. DoOP contains 21,061 chordate clusters from 284 different species and 7548 plant clusters from 269 different species nowadays.
2.3.4
CORG
CORG [32] is a database for comparative regulatory genomics that uses a systematic approach to delineate the conserved non-coding blocks from upstream regions of putative orthologous gene pairs from human
and mouse, the non-coding DNA segments that are conserved across multiple homologous genomic sequences are good indicators of putative regulatory elements. CORG takes 18,467 homologous gene piars from Ensembl compara7.1 and non-coding upstream sequences of genes from NCBI human Assembly 29 and MGSC mouse Assembly 3.
In order to determining the sequence region for computational promoter prediction, CORG takes 5’ translation start sites and the TSS annotation by EPD into consideration. They finds that 90% of all mapped promoter region are within a interval of 10kb related to translation start site, therefore, CORG retrieves 15kb upstream sequences to analyze base on Waterman–Eggert algorithm[44]. Finally, CORG finds 58% of homologous gene pairs of human and mouse from Ensembl, that is 10,973 gene pairs, are detected with a P-value of less than 0.01 when aligned. In other words, there are 293,503 conserved non-coding blocks for the two genomes. Also, CORG finds that on average about 8% of each investigated upstream sequences was part significantly conserved.
2.3.5
TiProD
TiProD [33] is a database of human promoter sequence for which some functional feature are known, and allows a user to query individual promoters and the expression pattern they mediate, gene expression signatures of individual tissues, and to retrieve sets of promoters
according to their tissue-specific activity or according to individual Gene Ontology [45] terms the corresponding genes are assigned to. TiProD collects TSSs information of human genes from EPD, Ensembl, and DBTSS. After sliding its entire sequence fragment with a 1000 nt length window to find clusters of TSSs, TiProD determines the “virtual TSSs” by giving more weight to the TSSs from EPD or the TSSs with more evidence points. Furthermore, TiProD retrieves -500 to +60 sequences around the “virtual TSSs” as promoter sequences.
Besides, TiProD parses the UniGene[35, 46] Library Data and Expression Data files from CGAP[47, 48] and assigns Gene Ontology terms by linking to UniGene clusters to annotate the corresponding gene promoters. Currently, TiProD stores 15,384 human promoters belonging to 52 tissues. TiProD normalizes frequencies of genes in each library and calculated an abundance score aij:
(1) Then they computes the average abundance score for each gene i among all tissues j:
(2) The tissue-specificity index tij then is the ratio of the abundance to the average abundance score:
(3) If one gene is specifically expressed in one tissue, the value of tij will be close to 1.
2.4 Promoter Prediction Programs
Several promoter prediction programs including NNPP2.2, Eponine, and CpGProD were used for annotating the putative promoter regions on user input sequence.
2.4.1 NNPP2.2
NNPP 2.2 [49] is constructed of time-delay neural networks. The network model is a special case of a feed-forward neural network, which has been successfully applied to voice recognition. Time-delay neural networks slightly differ from feed-forward neural networks in the design of the hidden layer. The hidden nodes of a standard feed-forward model are determined by experiment or by lemma. In a time-delay model, the hidden nodes are determined by the number of the input nodes and the input size of the receptive fields. Therefore, the input layer and the hidden layer are no longer fully connected. The hidden nodes in a hidden layer are only connected to input nodes within a particular receptive field. In a time-delay model, the hidden node is also called a feature node and is
known as weight sharing in neural network technology.
In the training process, all the weights in the same receptive filed will be calculated and then copied to each other. However, the weights computed between the hidden nodes and the output nodes are still based on standard feed-forward algorithms. To optimize promoter prediction accuracy, two time-delay neural network models which recognize TATA-box with 30 bp (-40 bp to -10 bp from the TSS) and Inr (-14 bp to +11 bp from the TSS) regions of promoters are used. A combined model with 51 bps (-40 bps upstream to +11 bps downstream of TSS) is used along with the two models mentioned above for promoter prediction. The testing results showed that NNPP demonstrated 75% true positives for a fruit fly genome with a length of 2.9 Mbps.
2.4.2 Eponine
Eponine [50] proposed a probabilistic method for detecting transcription start sites (TSS) in mammalian genomic sequence, with good specificity and excellent positional accuracy. Eponine models consist of a set of DNA weight matrices recognizing specific sequence motifs. Each of these is associated with a position distribution relative to the transcription start site.
Eponine has been tested by comparing the output with annotated mRNAs from human chromosome 22. From this work, they estimate that
using the default threshold (0.999), it detects >50% of transcription start sites with 70% specificity. However, it does not always predict the direction of transcription correctly. It’s an effect which seems to be common among computational TSS finders.
2.4.3 CpGProD
CpGProD [51] is a program dedicated to the prediction of promoters associated with CpG Islands in mammalian genomic sequences. In vertebrate genomes, the CpG Islands (CGIs) are involved in DNA methylation of gene transcription. 50-60% of the human genes exhibit a CGI over the transcription start site (TSS) but not all the CGIs are associated with promoter regions [52]. CpGProD uses a CGI definition more stringent than that proposed by Gardiner-Garden and Frommer (1987). CpG Island are defined as DNA regions longer than 500 nucleotides (instead 200 bp), with a moving average G + C frequency above 0.5 and a moving average CpG observed/expected (CpG o/e) ratio greater than 0.6. Although it is strictly dedicated to this particular promoter class corresponding to ≈50% of the genes, CpGProD exhibits a higher sensitivity and specificity than other tools used for promoter prediction.
2.5
Related Software
The sequence alignment programs such as BLAST and ClustalW had been used for sequence similarity search and promoter sequence conservation, respectively. Moreover, some programs about finding regulatory features in promoter also had been integrated in our method.
2.5.1
BLAST
The Basic Local Alignment Search Tool (BLAST) [53] finds regions of local similarity between sequences. The program compares nucleotide or protein sequences to sequence databases and calculates the statistical significance of matches. BLAST can be used to infer functional and evolutionary relationships between sequences as well as help identify members of gene families.
2.5.2
ClustalW
ClustalW [21] is a general purpose multiple sequence alignment program for DNA or proteins. It produces biologically meaningful multiple sequence alignments of divergent sequences. It calculates the best match for the selected sequences, and lines them up so that the identities, similarities and differences can be seen. Evolutionary relationships can be seen via viewing Cladograms or Phylograms.
2.5.3
FootPrinter
FootPrinter, was designed specifically for phylogenetic footprinting that is a method that identifies putative regulatory elements in DNA sequences that are unusually well conserved across a set of orthologous sequences. The idea underlying phylogenetic footprinting is that selective pressure causes regulatory elements to evolve at a slower rate than the non-functional surrounding sequence [22]. This method focuses on the discovery of novel regulatory elements in orthologous sequences. Therefore the best conserved motifs in a set of homologous regulatory regions are excellent candidates as regulatory elements. Given a set of homologous input sequences and the phylogenetic tree T relating them, FootPrinter identifies a set of k-mers, one from each input sequence, that have parsimony score at most d with respect to T, where k and d are parameters specified by the user (the parsimony score is the minimum number of nucleotide substitutions along the branches of T that explain the set of identified k-mers) [22]. By default, the parameters k (motif size, valid range: 4 to 16) and d (maximum parsimony score, valid range: 0 to 20) are set to 10 and 2, respectively.
2.5.4
miRanda
Morris et al. [18] found that small interfering RNA (siRNA) and microRNA (miRNA) silencing gene transcription associated with DNA
methylation of the target sequence, and demonstrated that siRNA-directed transcriptional silencing is conserved in mammals, enabling the inhibition of mammalian gene function. The miRNA gene profiles are extracted from miRBase [20], and been used to detect the miRNA target sites. The system integrates miRanda [12], to detect the microRNA target sites associated with two major parameters, the Minimum Free Energy (MFE) and score. For the highly prediction accuracy, the values of MFE and score are set to -20 and 150, respectively.
Chapter 3
Materials and Methods
3.1
Materials
In this section, we state some genome databases and experimentally transcription start site databases used in this system for analyzing regulatory features of gene promoter regions.
3.1.1 Genome Databases
The Ensembl [54] and RefSeq [55] genome databases also contain a large number of gene start sites by mapping the mRNA and EST sequences to genomes.
3.1.2 Transcription Start Site Databases
Many experimentally identified TF binding sites have been collected in TRANSFAC [27], which is the most complete and well maintained database of TFs, their genomic binding sites and DNA-binding profiles. The information of exact transcriptional start sites (TSSs) of genes is valuable in many ways; it can be used to make the prediction of TSSs more accurate and the analysis of upstream regulatory regions (promoter) more precise [23]. Eukaryotic Promoter Database (EPD) [24] and the Database of Transcriptional Start Site (DBTSS) [23] are the published
databases containing the experimentally promoter sequences. EPD is an annotated, non-redundant collection of eukaryotic Pol II promoters, for which the transcription start site has been determined experimentally. Furthermore, EPD is structured in a way that facilitates dynamic extraction of biologically meaningful promoter subsets for comparative sequence analysis. DBTSS was first constructed in 2002 based on precise experimentally determined 5'-end cDNA clones by oligo-capping method [25]. DBTSS now provides the information about the potential alternative promoters because the number of 5'-end cDNA clone is sufficient to determine several promoters for one gene by clustering TSSs within a 500 bases interval.
Figure 3.1 The system flow of RegProM.
3.2
Methods
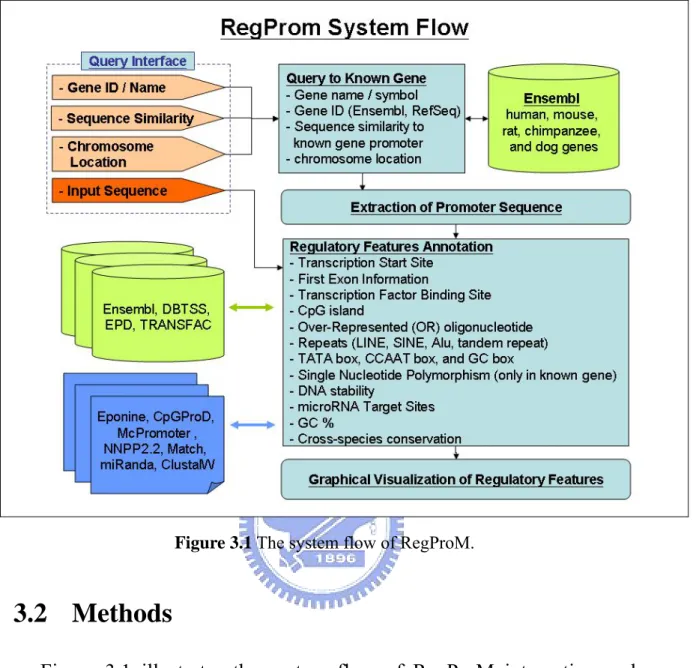
Figure 3.1 illustrates the system flow of RegProM integrating and annotating transcriptional regulatory features in the promoter region. This integrated system can comprehensively annotate the regulatory features for the known gene promoters, and provide the conserved regulatory features in the homologous gene promoter sequences. Besides, the system takes advantage of several promoter identification programs to determine the putative transcription start sites and annotate the regulatory features for the user inputted sequence. RegProM can facilitate the gene
transcription analysis via graphical visualization of regulatory elements in the promoter region.
3.2.1 Promoter Extraction
The system integrates five mammalian genomes, including human, mouse, rat, chimpanzee and dog from the Ensembl genome database [54], and the number of known genes are 22774, 25420, 22159, 22475, and 18201, respectively. The known gene transcription start sites (TSSs) are obtained from the Ensembl, and by default, the upstream sequences 2000 bps from TSS (+1) to the downstream 200 bps are extracted and defined as the promoter regions. However, several genes had alternative promoters which were experimentally identified by the alternative transcription initiation sits [23].
The Database of Transcriptional Start Site (DBTSS) collects a full-length cDNA library which experimentally determined TSS, a total of 8308 human genes and 4276 mouse genes were found to have putative multiple promoters. Another popular promoter database, Eukaryotic Promoter Database (EPD) [24], is an annotated non-redundant collection of eukaryotic POL II promoters, for which the transcription start site has been determined experimentally. There were 1871 human promoters, 196 mouse promoters, and 119 rat promoters of EPD integrated in our system. All the TSSs of Ensembl, DBTSS, and EPD were integrated and provided
to users for the complete visualization in promoter analysis.
Table 3.1 Supported regulatory features in RegProM.
Regulrtory Features Resources Descriptions
Ensembl [54] Storing the known gene start site of human, mouse, rat, chimpanzee, and dog
DBTSS [23] A database stores experimentally determined TSS of human and mouse
EPD [24] An annotated non-redundant collection of experimentally eukaryotic POL II promoters Eponine [50] Predicting the transcription start site McPromoter [56] A statistical method to look for eukaryotic
polymerase II TSSs in genomic DNA Transcription start site
NNPP 2.2 [49]
A promoter prediction which incorporated the time-delay neural network model with the structural and compositional properties of a eukaryotic core promoter region
TRANSFAC [27] Storing the experimental verified transcription factors, their genomic binding sites and DNA-binding profiles
Transcription factor binding site
MATCH [28] Scanning the transcription factor binding site using the transcription factor binding profiles from TRANSFAC
Ensembl core libraries
[57] Extracting the CpG island in known gene promoters of Ensembl CpG island
CpGProD [51] Detecting the CpG island Ensembl core libraries
[57]
Extracting the LINE, SINE, and Alu repeats in known gene promoter regions of Ensembl
Repeat
TRF [58] A tandem repeat finder TATA box, CCAAT box,
and GC box Narang et al. [59] Defining the 6-mer pattern of TATA box, CCAAT box, and GX box with positional density Over represented pattern Huang et al. [60] Defining the statistical significant pattern in promoter region DNA stability Aditi Kanhere et
al.[16] Predicting the DNA stability of promoter region microRNA target site miRanda [12] Predicting microRNA target site
Sequence conservation of homologous gene promoter
CLUSTALW [21] Using the ClustalW program to analyze the conservation among the homologous gene promoter sequences
Phylogenetic footprinting FootPrinter [22] Identifying the best conserved motifs the homologous regions
3.2.2 Transcriptional Regulatory Features Annotation
After determining the promoter region, general regulatory features such as transcription factor binding sites, CpG islands, repeats, TATA-box,
CCAAT-box, GC-box, and over-represented sequences are annotated. Furthermore, the Single Nucleotide Polymorphism, DNA stability, microRNA target sites, and GC-content of the promoter region are provided for advanced analysis in gene transcription. Table 3.1 shows the system integrates numerous methods for analyzing regulatory features in the promoter regions. The transcription start site (TSS) is an initiation site of the production of mRNA molecules. The important regulatory elements usually located near the TSS, which is the so called gene promoter region. Users can input not only the gene name/symbol, Ensembl gene ID, RefSeq gene ID, chromosomal location, and sequence to be searched in the known genes collected from Ensembl, but also can input a novel sequence to be annotated the putative TSS by three promoter prediction programs such as Eponine [50], McPromoter [56] and NNPP2.2 [49]. Eponine detects the transcriptional initiation site near the TATA box together with the flanking regions of G-C enrichment. A parameter of score threshold should be set (0 ~ 1.0), the value is set to 0.8 with the highly prediction accuracy (53.5% sensitivity and 73.5% specificity). A lower score threshold will make much TSS predictions, and increase the false positive problem. McPromoter used a statistical method to look for eukaryotic polymerase II TSSs in genomic DNA. The neural network for promoter prediction (NNPP2.2) program incorporated the time-delay neural network model with the structural and
compositional properties of a eukaryotic core promoter region [49]. When tested in the Adh region of 2.9 Mbases of the Drosophila genome, NNPP2.2 gives a recognition rate of 75% (69/92) with a false positive rate of 1/547 bases.
In vertebrate genomes, the CpG Islands (CGIs) are involved in DNA methylation of gene transcription. 50-60% of the human genes exhibit a CGI over the transcription start site (TSS) but not all the CGIs are associated with promoter regions [52]. The CGIs associated with promoters can be, a priori, identified from their structural characteristics (greater size and higher G+C content and CpG o/e ratio). CpGProD [51] can detect the CGIs in the promoter region with prediction specificity ~ 70%, which is integrated by RegProM to search the CGIs for input sequence. The CGIs are defined as DNA regions longer than 500 nucleotides, with a moving average C+C frequency above 0.5 and a moving average CpG observed/expected (o/e) ratio greater than 0.6. CpGProd was integrated to annotate the CpG islands for the input sequence and improve the prediction of gene promoter regions for a novel sequence. Furthermore, the system provides the G + C content which represents a frequency of nucleotide G and C occurrence in a given window, and the default window size is 15 nt sliding 1 nt each time. The representation of G + C content can help observing the CpG islands and GC box in the promoter region. It is found that most genes had high G +
C content in promoter regions.
Gene transcription is regulated by transcription factors (TFs) binding mostly and specifically to the promoter region which is the so called transcription factor binding sites (TFBSs). The experimentally identified TF bind sites were obtained from TRANSFAC (professional 8.1), which contains 5,711 transcription factors and 14,406 binding sites. In the system, 4,206 known binding sites are matched to upstream regions of human, mouse, rat, chimpanzee, and dog genes. A program, namely MATCH [28], was implemented to scans the transcription factor binding site in an input sequence using the transcription factor binding profiles of TRANSFAC. Two important parameters of MATCH, core score and matrix score, represent the sequence matching score of core region and whole region of binding site, respectively. For high specificity of transcription factor binding site matching, the system set 1.0 (perfect match) for core score and 0.95 for matrix score. The known TF binding sites are used to scan the input sequence in both strands, and the positions of each known site homolog are then displayed in the graphical visualization.
Narang et al. [59] used computational method to reveal several important core and proximal promoter elements such as TATA box, CCAAT box, GC box, etc., along with their expected locations around the TSS. These oligonucleotides are kinds of transcription factor binding site
and located near the transcription start site.
Table 3.2 The lists of TATA box, CCAAT box and GC box with positional densities [59]. Consensus Preferred Position Corresponding oligonucleotides Window Position Probability TATA box -35 to -25 TATAAA TATAAC TATAAG TATATA TAAAAG TAAAGG TAAATA TGTATA ATAAAA ATAAAG ATAAAT ATATAA CCTATA CTATAA CTATAT GCTATA GTATAA GTATAT -40 to -20 -40 to -20 -40 to -20 -40 to -20 -40 to -20 -40 to -20 -40 to -20 -40 to -20 -40 to -20 -40 to -20 -40 to -20 -40 to -20 -40 to -20 -40 to -20 -40 to -20 -40 to -20 -40 to -20 -40 to -20 0.564 0.25 0.473 0.365 0.364 0.299 0.275 0.307 0.299 0.348 0.285 0.394 0.437 0.597 0.413 0.543 0.568 0.331
CCAAT box -165 to -40 (-90 mean)
ACCAAT CAATGG CCAATC CCAATG GACCAA GCCAAT -140 to -80 -140 to -80 -140 to -80 -140 to -80 -140 to -80 -140 to -80 0.259 0.201 0.201 0.279 0.209 0.232 GC box -164 to +1 GGCGGG GGGCGG GGGGCG CGGCGG CGGGGC GCGCCG GCGGCG GCGGGC GCGGGG GGCGGG GGGGCG CGGCGG GCGGCG GGCGGC -140 to -80 -140 to -80 -140 to -80 -80 to -20 -80 to -20 -80 to -20 -80 to -20 -80 to -20 -80 to -20 -80 to -20 -80 to -20 -20 to +40 -20 to +40 -20 to +40 0.203 0.208 0.218 0.201 0.256 0.203 0.201 0.211 0.253 0.275 0.266 0.249 0.251 0.254
As shown in Table 3.2, the lists of TATA box, CCAAT box, and GC box with positional densities are used by RegProM to help the annotation of promoter region. The repeats such as SINE, LINE, Alu, L1, and so on, are extracted from Ensembl database by using Ensembl core libraries.
Previous study (Batzer et al.) found that repeats such as Alu and L1 elements can alter the distribution of methylation in the genome, and possibly in gene transcription [61, 62]. These repeats are represented only for known gene promoter sequences. To find the tandem repeats in promoter region, the system integrates a program namely tandem repeat finer (TRF) [58]. The parameters such as period size, copy number, consensus size, score, etc. are set corresponding to the default value of tandem repeat finer.
The system applies a statistical method to discover statistically significant oligonucleotides in promoter region, the so called over-represented (OR) Oligonucleotide, which is identified by comparing their frequencies of occurrence in the promoter regions to their background frequencies of occurrence throughout whole genome. If Pb(S) is the background occurrence probability of oligonucleotide S in whole genomic sequence, then the oligonucleotide S would be expected to occur
u = T × Pb(S) times in the promoter regions of genes, where T represents
the total number of possible matching positions of an oligonucleotide with length w across both strands of the sequence set. Using the binomial distribution model, the standard deviation of oligonucleotide occurrences
becomes . Let n be the frequency of the
considered oligonucleotide S occurring in the promoter regions; the Z-score is given by Z = (n - u) / σ. The probability of observing at least n
2 / 1 )]} ( 1 [ ) ( {T×Pb S × −Pb S = σ
successes, as given by Chebyshev’s theorem, is less than or equal to . If Z > 0, then a lower p-value corresponds to a more over-represented oligonucleotide. If Z < 0, then a lower p-value corresponds to a more under-represented oligonucleotide. Based on statistical significance, this work chooses the oligonucleotide with a
Z-Score > 5 as the OR sequence.
2 ] / ) [( − − = n u σ p
Aditi Kanhere et al. [16] devised a novel regulatory feature, DNA stability, for prokaryotic promoter prediction. The DNA stability is the structural property of the fragment of the DNA duplex, which is calculated based on the minimum free energy created by the hydrogen bond of the A-T and C-G pairs. SantaLucia et al. [17] use the unified standard free energy of ten di-nucleotides duplexes, such as AA/TT, AT/TA, TA/AT, CA/GT, GT/CA, CT/GA, GA/CT, CG/GC, GC/CG, and GG/CC [17] (see Table S1), to calculate the standard free energy change of a DNA oligonucleotide based on dinucleotid e composition. The standard free energy change ( ) corresponding to the melting transition of an ‘n’ nucleotide (or ‘n-1’ dinucleotides) long DNA molecule, from double strand to single strand, is calculated as follows [7]:
0 37 G Δ
∑
− = + Δ + Δ + Δ − = Δ 1 1 0 1 , 0 0 0( ) ( ) n i i i sym ini G G G total Gwhere, denotes two types of initiation free energy : “initiation with terminal G⋅C” and “initiation with terminal A⋅T”; is +0.43
0 ini G Δ 0 sym G Δ
kcal/mol and is applicable if the duplex is self-complementary, and
represents the standard free energy change for type ij dinucleotide. Table S1 lists the standard free energy changes for ten Watson-Crick types ij. In the present calculation, each promoter sequence is divided into overlapping windows of 15 bp (or 14 dinucleotide steps), and for each window the free energy is calculated as shown above. This study applied the equation of standard free energy change (mentioned in the supplementary materials) to calculate the stability of DNA duplex with window size = 15 nt, sliding from -1000 to +201 of TSS in the DBTSS human and mouse experimentally determined promoters. Figure 3.2 shows the distributions of average free energy of DNA duplex formation, and reveals a peak near the TSS, lying between -10 and -30 region, which corresponds to the TATA box in the eukaryotic promoter sequences. Aditi Kanhere et al. [16] demonstrated that the change in DNA stability appears to provide a much better clue than the usual sequence motifs. Therefore, this work provides the DNA stability of the promoter region to enhance the promoter identification.
0 , j
i
G
Figure 3.2 Distributions of average free energy of DNA duplex formation in human and mouse promoters.
Morris et al. [18] found that small interfering RNA (siRNA) and microRNA (miRNA) silencing gene transcription associated with DNA methylation of the target sequence, and demonstrated that siRNA-directed transcriptional silencing is conserved in mammals, enabling the inhibition of mammalian gene function. The miRNA gene profiles are extracted from miRBase [20], and been used to detect the miRNA target sites. The system integrates miRanda [12] to detect the microRNA target sites associated with two major parameters, the Minimum Free Energy (MFE) cutoff and score cutoff. For obtaining high prediction specificity, the cutoff values of MFE and score cutoff are set to -20 kcal/mol and 150, respectively.
3.2.3
Comparative Gene Promoter Analysis
To analyze the cross-species conservation of homologous gene promoter sequences, the Ensembl core libraries [57] were used to identify homologous genes among human, mouse, rat, chimpanzee, and dog. These homologous genes are analyzed based on gene sequence similarity, and the paired homologous genes with both sequence coverage and sequence identity exceeding 80% are further analyzed in homologous gene promoter sequences. The statistics of pair of homologous genes among five species considered in this work are given in Table 3.3. Following the determination of the paired homologous gene sequences among those five mammals, the multiple sequences alignment tool, CLUSTALW, was used to analyze the promoter sequences of the paired homologous genes. This work found that certain pairs of promoter sequences were not conserved while their homologous gene sequences were highly conserved. Based on the conservation of homologous gene promoter sequences among the five mammals, the conserved regulatory features should have a greater influence on gene transcriptional regulation.
Table 3.3 Statistics of homologous genes.
Species Human Mouse Rat Chimpanzee Dog Human 10,047 9,129 14,082 11,006
Mouse 1,4510 6,883 8,842
Rat 6,365 8,048
Chimpanzee 7,384
Dog
In particular, phylogenetic footprinting is a method that identifies putative regulatory elements in DNA sequences that are unusually well conserved across a set of orthologous sequences. The idea underlying phylogenetic footprinting is that selective pressure causes regulatory elements to evolve at a slower rate than the non-functional surrounding sequence [22]. This method focuses on the discovery of novel regulatory elements in orthologous sequences. Therefore the best conserved motifs in a set of homologous regulatory regions are excellent candidates as regulatory elements. This work integrates a program, namely FootPrinter, was designed specifically for phylogenetic footprinting. Given a set of homologous input sequences and the phylogenetic tree T relating them, FootPrinter identifies a set of k-mers, one from each input sequence, that have parsimony score at most d with respect to T, where k and d are parameters specified by the user (the parsimony score is the minimum number of nucleotide substitutions along the branches of T that explain the set of identified k-mers) [22]. By default, the parameters k (motif size,
valid range: 4 to 16) and d (maximum parsimony score, valid range: 0 to 20) are set to 10 and 2, respectively.
3.2.4
Graphical Visualization of Regulatory Features
Following the annotation, the regulatory features of the promoter are represented via graphical visualization, which is implemented using the GD library of the PHP programming language. To simplify graphical visualization, regulatory features with numerous entries, including transcription factor binding sites and microRNA target sites, are initially represented in overview form. The regulatory features were displayed in detail if users clicked on the URL link labeled “detailed view”. Additionally, the detailed information of the regulatory features is listed in table form. Furthermore, the conserved regions of homologous gene promoters are displayed, and the conserved regulatory features can observed in the promoter regions. The graphical visualization of regulatory elements can facilitate the analysis of the promoter regions.
Chapter 4 Results
4.1 The Statistics of Regulatory Features in RegProM
As show in Table 4.1, the number of known genes in human, mouse, rat, dog and chimpanzee are 26,351, 27,211, 23,912, 20,469 and 22,475, respectively. Besides, the number of pesudogenes in human, mouse, rat and dog are 7919, 1,383, 1,448 and 2,238, respectively. However, there is no record of chimpanzee pesudogenes in Ensembl genome database. Moreover, there are 424 human miRNA genes, 221 mouse miRNA genes, 208 rat miRNA genes, 209 dog miRNA genes and no records for chimpanzee miRNA genes.
Table 4.1 The statistics of known genes, pseudogenes, and miRNA genes.
Species Human Mouse Rat Dog Chimp No. of known genes 26,351 27,211 23,912 20,469 22,475
No. of pesudogenes 7,919 1,383 1,448 2,238 N/A No. of miRNA genes 424 221 208 209 N/A Total 34,270 28,594 25,360 22,707 22,475
The statistics of transcription start sites of human, mouse, rat, chimpanzee, and dog genes is shown in Table 4.2.They are collected from Ensembl, DBTSS, EPD respectively. Ensembl stories 45,921 TSSs belonging to 37,420 human genes, 39,452 TSSs belonging to 39452 mouse genes, 35,951 TSSs belonging to 25360 rat genes, 34814 TSSs
belonging to dog genes, and 43000 TSSs belonging to 22475 chimp genes. DBTSS TSSs only stories 30694 TSSs belonging to 14,628 human genes and 19,023 TSSs belonging to 14,628 mouse genes and not any entry belonging to rat, dog, and chimpanzee. EPD stories only 1,871 TSSs belonging to 1685 human genes, 196 TSSs belonging to 155 mouse genes and 119 TSSs belonging to 98 rat genes.
Table 4.2 Statistics of experimentally transcription start sites from Ensembl, DBTSS and EPD.
Species Human Mouse Rat Dog Chimp Ensembl TSS
( No. of TSSs
/ No. of known genes)
45,921 / 34,270 39,452 / 28,594 35,951 / 25,360 34,814 / 22,707 43,000 / 22475 DBTSS TSS ( No. of TSSs
/ No. of known genes)
30,964 / 14,628
19,023
/ 13,704 N/A N/A N/A EPD TSS
( No. of TSSs
/ No. of known genes)
1,871 / 1685 196 / 155 119 / 98 N/A N/A
The Statistics of TFBSs, TFs, and genes encoding TFs in human, mouse, rat, chimpanzee, and dog is as shown in Table 4.3. TRANSFAC gene entries can be cross reference to Ensembl ones in human, mouse, and rat but dog and chimpanzee can not. After filtering by cross reference to Ensembl, for example, there are 1,482 TFBSs within 378 human gene promoters, and the number of TFBSs per gene ranges from 1 to 39 and averages from 3 to 4 sites. Besides, there are 358 human genes controlled
by 656 TFs and each gene is controlled by from 1 to 2 TFs on average. In addition, there are 642 human genes able to encode TF, and the number of TFs encoded by one gene ranges from 1 to 7 and averages from 1 to 2 sites.
Table 4.3 Statistics of TFBSs, TFs, and genes encoding TFs.
Species Human Mouse Rat Dog Chimp TFBSs ( No. of TFBSs / No. of genes ) 1482 / 378 890 / 261 505 / 125 N/A N/A
Mean, Min, Max TFBSs per gene Mean : 3~4 , Min : 1 , Max : 39 Mean : 3~4 , Min : 1 , Max : 25 Mean : 4~5 , Min : 1 , Max : 32 N/A N/A TFs ( No. of TFs / No. of genes ) 656 / 358 475 / 241 312 / 115 N/A N/A Mean TFs per gene 1~2 1~2 1~2 N/A N/A TFs-encoded genes ( No. of TFs / No. of genes ) 837 / 642 491 / 426 116 / 90 N/A N/A
Mean, Max, Min TFs per gene Mean : 1~2 , Min : 1 , Max : 7. Mean : 1~2 , Min : 1 , Max : 6. Mean : 1~2 , Min : 1 , Max : 7. N/A N/A
Table 4.4 shows the statistics of CpG islands located within gene promoter region of each species. There are 14,537 for human, 7,237 for mouse, 7,646 for rat, 8,761 for dog genes with CpG islands located within promoters but no records for chimpanzee genes.
Table 4.4 Statistics of CpG islands.
Species Human Mouse Rat Dog Chimp No. of genes with
CpG islands located within promoters
14,537 7,237 7,646 8,761 N/A
Table 4.5 shows the statistics of repeats located within gene promoter region of each species. There are 218,109 repeats within 30,100 human gene promoters, and the number of repeats per gene ranges from 1 to 44 and averages from 7 to 8 sites. There are 212,430 repeats within 27,328 mouse gene promoters, and the number of repeats per gene ranges from 1 to 48 and averages from 7 to 8 sites. There are 162,432 repeats within 23,002 rat gene promoters, and the number of repeats per gene ranges from 1 to 47 and averages from 17 to 18 sites. There are 181,677 repeats within 22,314 dog gene promoters, and the number of repeats per gene ranges from 1 to 39 and averages from 8 to 9 sites. There are 138,055 repeats within 21,542 chimpanzee gene promoters, and the number of repeats per gene ranges from 1 to 444 and averages from 6 to 7 sites.
Table 4.5 Statistics of Repeats in human, mouse, rat, chimpanzee, and dog.
Species Human Mouse Rat Dog Chimp Repeats ( No. of Repeats 218,109 / 30,100 212,430 / 27,328 162,432 / 23,002 181,677 /22314 138,055 /21542
![Figure 1.2 Transcription factors and the basal machinery [5].](https://thumb-ap.123doks.com/thumbv2/9libinfo/8365266.177121/11.892.133.823.267.986/figure-transcription-factors-basal-machinery.webp)
![Figure 1.3 Covalent modification of histone tails and Regulation of gene transcription [6]](https://thumb-ap.123doks.com/thumbv2/9libinfo/8365266.177121/13.892.137.809.441.904/figure-covalent-modification-histone-tails-regulation-gene-transcription.webp)
![Figure 1.4 Chromatin-remodeling enzymes facilitate multiple steps during gene activation [9]](https://thumb-ap.123doks.com/thumbv2/9libinfo/8365266.177121/15.892.211.725.105.486/figure-chromatin-remodeling-enzymes-facilitate-multiple-steps-activation.webp)
![Figure 1.5 DNA methylation and regulation of gene transcription [10].](https://thumb-ap.123doks.com/thumbv2/9libinfo/8365266.177121/16.892.134.812.97.438/figure-dna-methylation-regulation-gene-transcription.webp)
![Figure 1.6 CpG island and Regulation of gene transcription [15].](https://thumb-ap.123doks.com/thumbv2/9libinfo/8365266.177121/19.892.147.750.109.1025/figure-cpg-island-regulation-gene-transcription.webp)