i
國
立
交
通
大
學
光電工程研究所
碩 士 論 文
提昇膽固醇液晶顯示器亮度之
光學薄膜設計
Optical Film Design for
Brightness Enhancement of Cholesteric LCDs
研 究 生:黃靖堯
指導教授:黃乙白 博士
田仲豪 博士
ii
提昇膽固醇液晶顯示器亮度之光學薄膜設計
Optical Film Design for
Brightness Enhancement of Cholesteric LCDs
研 究 生: 黃靖堯 Student:Ching-Yao Huang
指導教授: 黃乙白 Advisor:Dr. Yi-Pai Huang
田仲豪
Dr. Chung-Hao Tien
國 立 交 通 大 學
光 電 工 程 研 究 所
碩 士 論 文
A Thesis
Submitted to Institute of Electro-Optical Engineering College of Electrical and Computer Engineering
National Chiao Tung University in partial Fulfillment of the Requirements
for the Degree of Master
In
Electro-Optical Engineering July 2009
Hsinchu, Taiwan, Republic of China
iii
提昇膽固醇液晶顯示器亮度之
光學薄膜設計
碩士研究生:黃靖堯 指導教授:黃乙白助理教授
田仲豪副教授
國立交通大學 光電工程研究所
摘 要
反射式液晶顯示器擁有許多優點,像是重量輕、低功率消耗以及可在陽光下 閱讀,因而相當適合應用在電子書以及電子看板的市場上。但是反射式顯示器還 是有許多問題需要解決,例如低亮度、低對比以及視角小,導致在應用性來講受 限很多。微光學元件擁有設計彈性,低價位等優點,所以適合應用於提昇反射式 顯示器的光學表現。已經有許多方法提出並有不錯的效果,但是它們都有各自的 缺點,例如製作複雜度、價格、或是應用限制性。 在這篇論文中,提出了菱鏡陣列薄膜並驗證用於膽固醇液晶顯示器提昇對比 以及亮度之效果。提出的光學薄膜可以簡單的貼在顯示器之表面上,藉由微結構 將反射光的角度偏移炫光的角度以提昇對比。另外,薄膜的製程可以使用卷對卷 技術,便於使用在大型看板上。藉由評估反射角度以及實驗驗證,提出的菱鏡陣 列薄膜有潛力應用於膽固醇液晶電子看板上。 菱鏡設計是根據鏡面反射而設計的,我們驗證在電溼潤顯示器上菱鏡薄膜可 以提昇一定的亮度。所以除了膽固醇顯示器外,它也有潛力可以應用在其他反射 式顯示器上。iv
Optical Film Design for
Brightness Enhancement of Cholesteric LCDs
Student: Ching-Yao Huang Advisor: Dr. Yi-Pai Huang Dr. Chung-Hao Tien
Institute of Electro-Optical Engineering National Chiao Tung University
Abstract
The reflective liquid crystal displays which have many remarkable advantages, such as light weight, low power consumption, and sunlight readable, have become very popular devices for mobile and billboard applications. Nevertheless, there are still several issues like low brightness, poor contrast, and small viewing angle. Microoptics which have the advantages of design flexibility and low cost are well developed and applied to increase the optical performance of the reflective type LCDs.
In this thesis, the prism array film (PAF) was demonstrated for improving the contrast ratio and brightness of the cholesteric liquid crystal display. The optical film can be easily laminated on the top surface of the Ch-LCD to separate the reflected image from glare position, hence, improving the image quality. Moreover, the fabrication process can adapted to the roll to roll process for billboard application. The proposed optical film can be applied to other reflective LCDs based on specular reflection. The performance on Electrowetting display was improved using PAF. Therefore, PAF has potential to be applied to both E-book and E-banner application.
v
致謝
不知不覺間已經過了兩年,回想這兩年在實驗室中的生活,得到許多人的幫 助,也學會了一些作人處事應有的態度。首先,要感謝黃乙白教授及田仲豪教授 的指導,讓我能夠順利完成這篇論文。也感謝工研院所提供的計畫,謝謝所有工 研院指導幫助過我的前輩。另外,也很感謝許多學長的幫助,包括仁宇學長,均 合學長,健翔學長,友群學長以及仁杰學長。 同時我也要感謝一起奮鬥的同學們,大頭、致維、宜如、佑禎、TJ、大白、 科科、浩彣、俊賢、宜伶等,有你們這些夥伴的陪伴,才能讓新竹這個無趣的地 方變得有趣起來。 感謝實驗室裡其他的學長姐們,鄭博、YK、舜哥、奕智、芳正、精益、國振、 凌嶢等平時的照顧。還有碩一學弟妹們的幫忙以及帶給實驗室的歡樂,讓我們得 以在枯燥的研究生活中,得到紓解。 最後,要特別感謝我的家人,女友以及朋友們的支持與鼓勵,讓我可以專心 在研究上。謝謝父母不辭辛勞的付出與關心,讓我能無憂無慮的求學,在此獻上 我最誠摯的感謝。vi
Table of Contents
Abstract (Chinese)……….………...i Abstract (English)………...ii Acknowledgement………..iii Table of Contents………...iv Figure Caption………..viChapter 1 Introduction ... 1
1.1 Liquid-crystal Displays ... 1 1.1.1 Transmissive LCDs ... 2 1.1.2 Reflective LCDs... 4 1.2 Micro-optics in Reflective LCDs ... 9 1.2.1 Reflector type ... 101.2.2 Optical film type ... 11
1.3 Motivation and Objectives ... 13
1.4 Organization ... 14
Chapter 2 Principle of Microoptics of Optical Film ... 15
2.1 Ray-tracing Method ... 15
2.2 Radiometry and photometry... 16
2.2.1 Radiometry ... 16
2.2.2 Photometry ... 17
2.3 Optics of Cholesteric LCDs ... 20
2.4 Summary ... 24
Chapter 3 Fabrication Technology and Measuring Instruments ... 25
3.1 Fabrication-Diamond Turning ... 25
3.2 Measurement-Conoscope System ... 28
3.3 Summary ... 30
vii
4.1 Design of Asymmetrical Microlens Array ... 31
4.2 Simulation Model of Microlens Array Film ... 37
4.3 Simulation Result of Microlens Array Film ... 39
4.4 Simulation Result of Prism Aarray Film ... 41
4.5 Summary ... 44
Chapter 5 Experimental results and Discussions ... 45
5.1 Experimental result of Ch-LCD with PAF ... 45
5.2 Other Displays with PAF ... 51
5.3 Summary ... 55
Chapter 6 Conclusions and Future work ... 56
6.1 Conclusions ... 56
6.2 Future work ... 57
References ... 60
viii
Figure Captions
Fig 1-1. The cross-sectional view of a LCD ... 2
Fig 1-2. Schematic configuration of the transmissive LCDs of (a) direct-emitting (b) side-emitting backlight system ... 3
Fig 1-3. The photos of a transmissive type LCD at the indoor and outdoor circumstance ... 4
Fig 1-4. The schematic configuration of reflective type LCDs using ambient light as a light source. ... 5
Fig 1-5. Schematic of the working principle of MTN LCD[11] ... 6
Fig 1-6. A general STN display emloying polarizer, retardation film, and reflector ... 7
Fig 1-7. Water droplet on a hydrophobic surface (a) with and (b) without applied voltage ... 8
Fig 1-8. Electrowetting display principle[14] ... 9
Fig 1-9. Typical reflected light distribution of the reflective type LCD ... 10
Fig 1-10. (a) Rough surface reflector[15], (b) micro slant reflector[16], and (c)
Microreflector structures[17] ... 11
Fig 1-11. (a)The light distribution of passing through the light control film laminated on the reflective display and (b) modified as a multidirectional AMA-LCF for collecting light from multi-illumination ... 12
ix
Fig 2-1. Schematic diagram of projection area ... 17
Fig 2-2. Human visual response function ... 18
Fig 2-3. The Schematic of BSDF ... 19
Fig 2-4. Diagram of the definition of BRDF[26] ... 20
Fig 2-5. Schematic diagram showing the cholesteric structure ... 21
Fig 2-6. The structures of cholesteric textures ... 22
Fig 2-7. The operation principle of Ch-LCD at (a) Voltage-off and (b) Voltage-on state. ... 23
Fig 2-8. (a) Matsushita sigma book[29] and (b) Magink E-billboard[30] ... 23
Fig 3-1. Diamond turning fabrication steps ... 26
Fig 3-2. Schematic overview of ruling ... 27
Fig 3-3. Diagram of diamond cutting ... 28
Fig 3-4. Functionalities of finger in Conoscope system ... 29
Fig 3-5. Schematic of the Conoscope in reflective mode ... 29
Fig 3-6. Schematic of the Conoscope in transmissive mode ... 30
Fig 4-1. Schematic of (a) MAMA-LCF and (b) MAF ... 32
Fig 4-2. Schematic of Ch-LCD e-banner ... 32
Fig 4-3. The related position of the display and viewers ... 33
x
Fig 4-5. The contour of reflection angle for light incident on (a) top, (b) middle, and (c)
bottom of the display ... 36
Fig 4-6. The weighting of curved surface to the wavefront of incident light ... 37
Fig 4-7. Measured BRDF of Ch-LCD ... 38
Fig 4-8. Schematic diagram of Ch-LCD configuration ... 38
Fig 4-9. Schematic of microlens ... 39
Fig 4-10. Ray-tracing of MAF ... 39
Fig 4-11. Schematic of uniformity detection point ... 40
Fig 4-12. The simulation parameters for uniformity... 41
Fig 4-13. Simulation results of (a) spacing (b) pitch for uniformity ... 41
Fig 4-14. Schematic of light propagation with prism ... 42
Fig 4-15. Simulation results of (a) prism angle variation and (b) group spacing ... 43
Fig 4-16. Designed result of PAF ... 43
Fig 5-1. (a) Plane view of the asymmetrical prism array and (b) tube-shaped PAF .... 45
Fig 5-2. Measured reflectance of Ch-LCD as a function of viewing angle under -30°illumination from, compared with (a) the simulation result and (b) bare Ch-LCD ... 46
Fig 5-3. The difference of design and fabrication result of 10°, 13°, and 16° prisms . 47 Fig 5-4. Samples photographs of (a) color Ch-LCD and (b) bent Ch-LCD. The display images with PAF clearly show better image quality. ... 48
xi
Fig 5-5. Examination of PAF on 25cm by 15cm color Ch-LCF ... 49
Fig 5-6. The scattering ability of different hazes ... 49
Fig 5-7. The display images of 0°, 20°, and 40° horizontal viewing angle ... 50
Fig 5-8. The coordinates of polar plot ... 51
Fig 5-9. The polar plots of with and without haze adhesive under collimated illumination from -30° ... 51
Fig 5-10. Measured reflectance of (a) Ch-01 and (b) Ch-02 with and without H-PAF52 Fig 5-11 The photographs of (a) Ch-01 and (b) Ch-02 with and without H-PAF ... 53
Fig 5-12. The EWD reflected image with and without H-PAF ... 54
Fig 5-13. Measured reflectance of EWD with and without PAF under a -30° illumination ... 54
Fig 6-1. The correlation between Ch-01 and Ch-02 ... 57
Fig 6-2. Oblique light and viewing caused color shift ... 58
1
Chapter 1
Introduction
1.1 Liquid-crystal Displays
Liquid-crystal displays (LCDs)[1],[2] are now applied to electric products, such as LCD TVs and portable displays. The advantages of LCDs include light weight, slim volume, high resolution and low power consumption. The liquid crystal cannot emit light by itself. In general, in the viewpoint of light sources there are two types of LCDs. The first type is the transmissive LCD which needs backlight to emit light. The LCDs configuration is show in Fig 1-1[3]. The LC plays the role of an electro-optical shutter to modulate incident light transmission. The LC is placed between two glass substrates which are coated with an indium tin oxide (ITO) electrode. Applied voltage can then control LC twist angle, and amount of transmitted light can be modulated. The second type is reflective LCD which does not need backlight but uses ambient light, such as sunlight. Typically, the transmissive LCD provides higher brightness and better contrast indoors. However, washout lowers contrast when seeing outdoors. On the contrary, the reflective LCD has higher contrast when seeing outdoors, but while seeing indoors the brightness of reflected image is not high enough. A supplemental light source solves this problem. Nevertheless, the optical characteristics of most reflective LCDs which will be described in section 1.2 affect the viewing angle and contrast ratio, hence, limited reflective LCDs application.
2
Fig 1-1. The cross-sectional view of a LCD
1.1.1 Transmissive LCDs
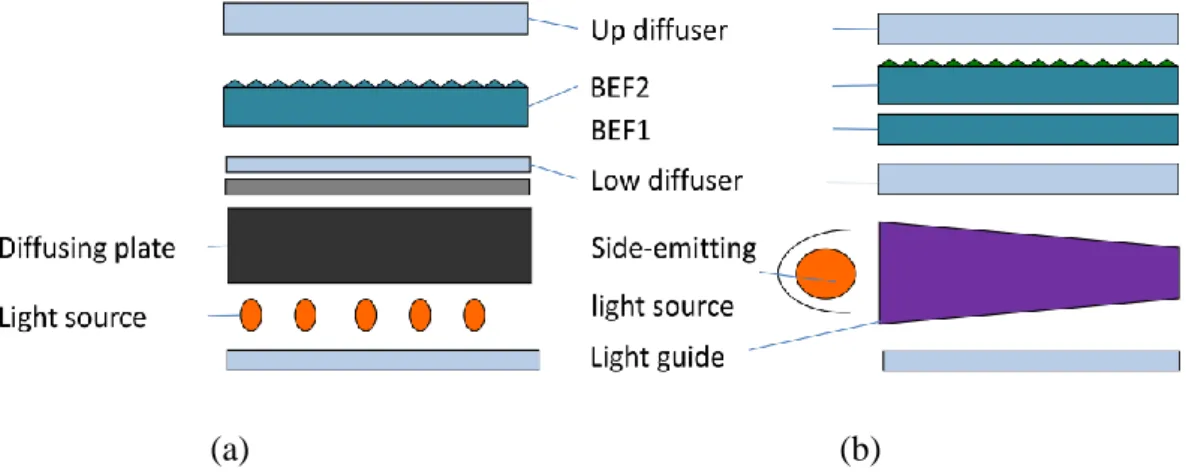
A transmissive type color LCD was demonstrated by Sharp Corporation in 1989[4]. Since the LC does not emit light by itself, a backlight system is required to provide light. In general, the backlight system can be classified into two types which depend on the position of the light source. The light source that may be cold cathode fluorescent lamp (CCFL) or light emitting diode (LED). The backlight is directly behind LCD is called direct-emitting and at the edge of LCD is called side-emitting backlights, The direct-emitting backlight which is shown in Fig 1-2(a) is typically used in large size LCD applications because of its higher brightness and larger viewing angle. However, bulk and higher power consumption disadvantages make it unsuitable for mobile products. The side-emitting backlight is usually applied mobile products. The schematic construction is shown in Fig 1-2(b).The light source position makes the side-emitting backlight thinner, but the light distribution is not uniform. To solve this issue, one or more layers of diffuser sheets are required and two brightness
3
enhancement films (BEFs)[5] are put on the LCD module to enhance the normal brightness.
(a) (b)
Fig 1-2. Schematic configuration of the transmissive LCDs of (a) direct-emitting (b) side-emitting backlight system
Trasmissive LCDs consume high power because of backlight system requirements. Furthermore, the devices in the LCD module such as the color filter, polarizer, LC cell, pixel electrode, and analyzer will absorb and block light transmittance. Therefore, a typical transmissive LCD device transmits only about 8% of total light. To yield adequate brightness, the backlight must operate high voltage what leads to high power consumption. Moreover, transmissive LCDs are diffucult to observe while under bright ambient light, which is termed “wash-out” phenomenon. Surface reflection intensity is much stronger than LCD transmitted light. Thus, an image appears wash-out as shown in Fig 1-3.
4
Fig 1-3. The photos of a transmissive type LCD at the indoor and outdoor circumstance
1.1.2 Reflective LCDs
Previous section mentions the power consumption of transimissive type LCDs are as an important factor in portable devices, such as mobile phones, laptops, and vehicle displays. They require low power consumption to achieve long term consistent use without charging. Consequently, reflective type LCDs were proposed.
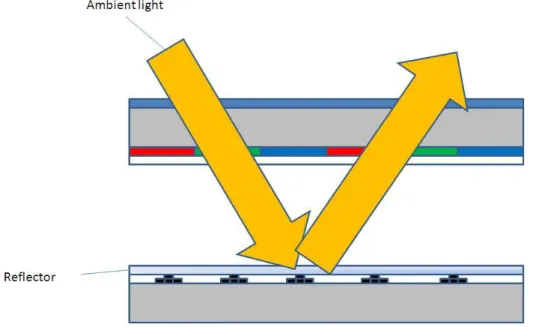
A schematic configuration of the reflective LCD is illustrated in Fig 1-4[6], where ambient light is reflected by the reflector and shown as a reflected image. Hence wash-out will not happen under bright ambient light. Without a backlight system, reflective type LCDs have the advantages of light weight and low power consumption [7]
.
5
Fig 1-4. The schematic configuration of reflective type LCDs using ambient light as a light source.
There are currently several technologies to create the reflective type LCDs. For example, super-twisted nematic LCDs (STN-LCDs)[8] for cellular phones, mixed-mode twisted nematic LCDs (MTN-LCDs)[9] for personal digital assistants, Cholesteric LCDs (Ch-LCDs) for e-papers and billboards, and electrowetting display for e-books.
Mixed-mode twisted nematic LCDs (MTN-LCDs)
The MTN cell has been shown to exhibit a high contrast ratio, low voltage, and weak color dispersion under the single polarizer configuration[10],[11]. A typical MTN reflective display consists of a polarizer, ideal λ/4 retardation film, and a twisted LC cell with a reflector embedded on the inner side of the rear substrate. The incident light traverses the linear polarizer, λ/4 film and LC layer, and is reflected back by the embedded mirror in the inner side of the rear substrate, as shown in Fig 1-5. Under the crossed-polarizer configuration, to obtain high refelctance in the voltage-off state the
6
LC cell needs to function as an achromatic λ/4 plate. Therefore, the incoming linearly
polarized light passes the two cascaded λ/4 plate twice upon reflection and is transmitted by the polarizer.
Fig 1-5. Schematic of the working principle of MTN LCD[11]
Super-twsited nematic LCDs
A super-twisted nematic (STN) cell is defined as one in which the LC twist angle is greater than 90o. In order to make the twist angle larger than 90o, a small percentage of chiral agent needs to be doped into the LC mixture. A STN display is known to exhibit a much steeper electro-optic curve than MTN display so that the simple low-cost passive matrix addressing method can be applied[12].
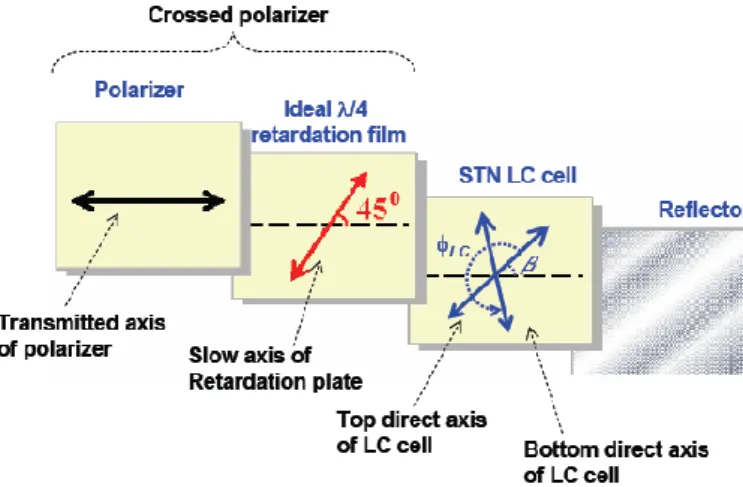
A general reflective STN display is depicted in Fig 1-6. It consists of a polarizer, one or two phase retardation films, and a twisted cell with a reflector deposited in the inner side of the rear substrate. For simplicity, the front rubbing is taken to be in the horizontal direction. The axis of the polarizer condition, the phase retardation is a quarter-wave film, and its axis is at 45° to the linear polarizer. At null-voltage, the normalized reflectance of such a STN cell can be calculated by the Jones matrix method.
7
Fig 1-6. A general STN display emloying polarizer, retardation film, and reflector
Electrowetting display
Elctrowetting display (EWD) is a new display technology developed by Rob Hayes and Johan Freenstra in 2002[13]. With electrowetting a voltage is used to modify the wetting properties of a solid material. An example is shown in Fig 1-7. Fig 1-7(a) shows a droplet on a hydrophobic surface. The droplet does not like to be in contact with such area, thus minimize the contact area. A voltage difference is applied between the electrode in the water and a substrate electrode underneath the hydrophobic insulator in Fig 1-7(b). As a result, the droplet spreads. Therefore, electrowetting display was developed based on this property.
8
Fig 1-7. Water droplet on a hydrophobic surface (a) with and (b) without applied voltage
In Fig 1-8 the principle of a reflective EWD is shown. Fig 1-8(a) shows the optical stack, comprising a transparent electrode, a hydrophobic insulator, a color oil layer and water[14]. In equilibrium the color oil naturally forms a continuous film between the water and the hydrophobic insulator due to the fact that this is the lowest energy state of the system. The surface tension force is more than 1000 times stronger than gravitational force at the typical length used in display (pixel size around or below 200 μm). As a result, the oil film is stable in all orientations. When a voltage is applied across the hydrophobic insulator, an electrostatic term is added to the energy balance and the stacked state is no longer energetically favorable. The system can lower its energy by moving the water into contact with the insulator, thereby displacing the oil and exposing the underlying reflecting surface as illustrated in Fig 1-8(b).
9
Fig 1-8. Electrowetting display principle[14]
However, these technologies still have inadequate brightness and contrast ratio in indoor environments, which is a critical issue in these applications. To improve these issues, reflected light should be redistributed to viewing zones to increase brightness. Besides, surface reflection can be avoided by index matching or separate reflected light from glare. Thus, the following section presents the micro-optics in reflective LCDs and methods for solving the issues.
1.2 Micro-optics in Reflective LCDs
10
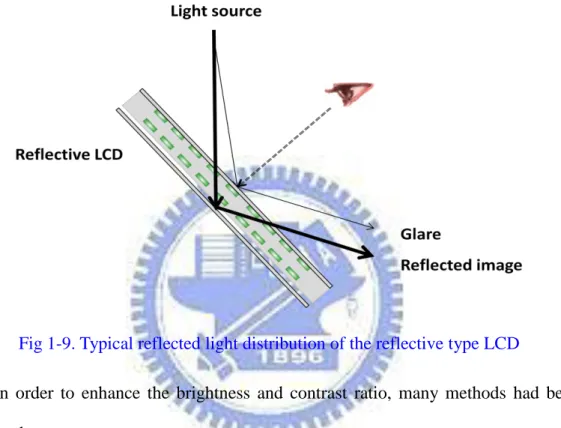
for viewing. Under oblique illumination metal-reflector reflects the oblique incident light to its corresponding reflection angle. Consequently, the viewers cannot perceive the brightest image at the viewing position as shown in Fig 1-9. Also the surface reflection will interfere with the image at the specular direction, hence lower the contrast.
Fig 1-9. Typical reflected light distribution of the reflective type LCD
In order to enhance the brightness and contrast ratio, many methods had been proposed.
1.2.1 Reflector type
Some methods were to improve the diffusing ability by changing the reflector
surface, such as rough surface reflector[15], micro slant reflector[16], and microreflector structures[17] as shown in Fig 1-10. Rough surface reflector can scatter the light to wider viewing angle by its rough surface, thus, viewers can observe the brighter image near normal direction. Micro slant reflector can shift the peak of the reflected light away from the specular reflection so that enhance the contrast ratio. Microreflector structures, implemented on the inner side of the rear substrate, can
11
steer and focus the reflected light to the desired viewing direction with viewing cone. However, the above methods work with the reflective type LCD with metal-reflector, so the type without reflector like cholesteric LCD (Ch-LCD) which will be introduced in section 2.3 cannot be applied.
Fig 1-10. (a) Rough surface reflector[15], (b) micro slant reflector[16], and (c) Microreflector structures[17]
1.2.2 Optical film type
To simplify the fabrication process and be applied to reflector-free display, Our group have proposed asymmetrical microlens array light control film (AMA-LCF)[18] to solve this issue as illustrated in Fig 1-1(a). An array of asymmetrical microlens cut along its diametric direction to form an off-axis microlens array device is a LCF. The AMA-LCF is laminated to the front surface of reflective LCDs. The ambient light
(a)
(b)
12
incident on the reflective LCDs is focused by the mircorlens. The focuses light will then be reflected toward the adjacent half-microlens by the flat reflector on the bottom substrate of the reflected LCDs. Due to the oblique incident light, the focus point of each microlens is shifted from the respective optical axis to that of the adjacent microlens. For the adjacent lens, the light reflected from the reflector can be regarded as light from a point source located in the focal plane near the optical axis, and the reflected light is refracted toward the normal direction by the asymmetrical microlens.
(a)
(b)
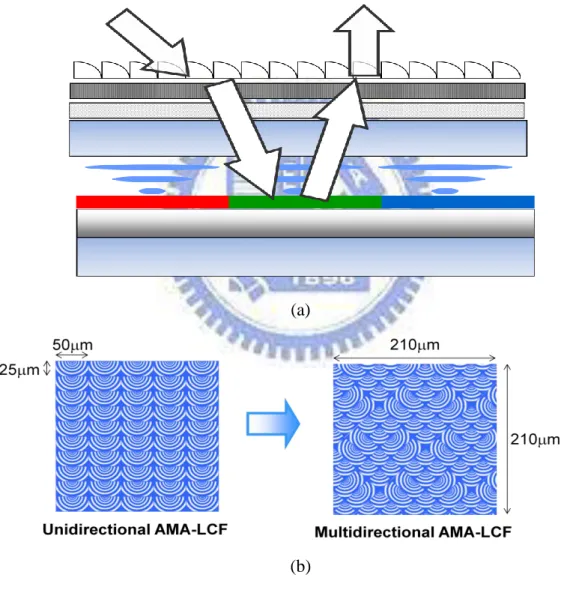
Fig 1-11. (a)The light distribution of passing through the light control film laminated on the reflective display and (b) modified as a multidirectional AMA-LCF for collecting light from multi-illumination
13
This concept was extended to multidirectional asymmetrical microlens-array light control film (MAMALCF)[20],[21] in order to collect light from different direction to further enhance the brightness and contrast ratio as depicted in Fig 1-11. (b). However, MAMA-LCF was designed for portable devices. The appropriate display size was about 1.5 to 2 inch. Therefore, the reflected image was non-uniform when applied to larger display as shown in Fig 1-12. Furthermore, MAMA-LCF was for collecting ambient light. For a supplemental light source and a larger display, the enhancement by MAMA-LCF will be not obvious.
Fig 1-12. Schematic of MAMA-LCF issue
1.3 Motivation and Objectives
Tranmissive type LCDs are currently a mature product. The larger display, backlight system material cost and the power consumption is also higher. Reflective type LCDs can have a lower cost and consume less power. So reflective LCDs are suitable for mobile and billboard applications.
As the prior methods, such as the rough surface reflector and the micro slant reflector, can enhance brightness and contrast ratio of reflective LCDs. However, the fabrication processes were complex and resulted in high cost when extended in size. Based on this premise, our group proposed MAMA-LCF to simplify fabrication and
14
reduce cost. However, the LCF was designed for portable device.
The brightness and CR were limited by optical properties of Ch-LC as mentioned in section 1.2. Moreover, the reflective image was non-uniform due to the light source position.
In this thesis, the objective was to design an optical film for Ch-LCD E-banner. The Mircrolens Array Film (MAF), Prism Array Film (PAF) and design method was proposed to solve the Ch-LCDs issues under indoor environments with a supplemental light source. The fabrication process can be applied to diamond tuning and roll-to-roll process, which can be easily applied to large billboards. Furthermore, the optical film should be able to apply to flexible display and maintain the performance when display is bent.
1.4 Organization
This thesis includes 6 chapters, as follows: In chapter 2, the ray-tracing method, BSDF, and Ch-LCD are introduced. In chapter 3, the fabrication method, and the instruments for measuring optical properties are described. In chapter 4, design method and simulations are presented. In chapter 5, the experimental results and discussions are described. Finally, conclusions and future work are presented in chapter 6.
15
Chapter 2
Principles of Micro-optics of Optical Film
and Cholesteric LCDs
In this chapter, several optical principles, such as Snell’s Law, radiometry, photometry, and bidirectional scatting distribution function (BSDF)[22], are described for designing the optical film. The ray-tracing method could simplify the light propagation behavior as a ray. However, the optical property of the cholesteric liquid crystal is difficult to describe by ray-tracing method. BSDF was adapted to characterize the optical property of the cholesteric liquid crystal, and BSDF were then measured. The measured BSDF data were input into the ray-tracing software, Lighttools[23] . For building the model of LC structure. The following is characterizing the working principle of cholesteric liquid crystal. Finally, a brief summary will be given.
2.1 Ray-tracing Method
Ray-tracing method is based on the geometric optics, Fresnel’s Law, and other principles. Geometric optics is used to describe the light propagation through a lens systems or optical instrument, allowing image-forming properties system to be modeled. There are many effects, such as dispersion, polarization, and thin film interference, can be integrated into a ray tracer in a straightforward fashion. The special case to consider is that of the interference of wavefronts which is approximated as planes. When the ray come close or even cross, the wavefront
16
approximation breaks down. Thus, the diffraction at an aperture cannot be calculated by ray-tracing. The geometric optics is a convenient way to analyze the action of the optical systems. Therefore, some optical software, such as LighttoolsTM, ZeemaxTM, and TrazeProTM, apply the ray-tracing method to build the simulated environment.
2.2 Radiometry and photometry
The optical characteristic of Ch-LC was difficult to be described by ray-tracing method only. Accordingly, the BSDF based on radiometry and photometry is described and utilized to characterize the reflective characterization of Ch-LC.
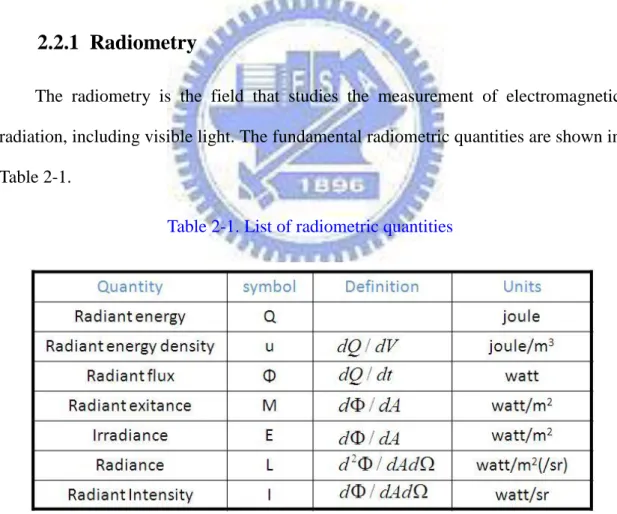
2.2.1 Radiometry
The radiometry is the field that studies the measurement of electromagnetic radiation, including visible light. The fundamental radiometric quantities are shown in Table 2-1.
Table 2-1. List of radiometric quantities
There are some quantities should be emphasized.
Q is the radiant energy of collection of photons whose energy of a single one is hν.
17
E and M pertains to radiation incident on a surface and leave a surface, respectively.
A is the area element that is perpendicular to the light of sight. [Fig 2-1]
Fig 2-1. Schematic diagram of projection area Radiometry introduces the following equation,
2 ( , ) d L d A d (4)
where
is solid angle. Therefore, the conservation is hold during lossless propagation, and for many sources such as Lambertian, radiance is independent of viewing angle.2.2.2 Photometry
Photometry is the science of measurement of light, in terms of its perceived brightness to the human eye[25]. It is distinct from radiometry which is interns of absolute power; rather, in photometry, the radiant power at each wavelength is weighted by a luminosity function that models human brightness sensitivity. The basic photometric unit of radiant power is lumen that is defined as a luminous flux emitted into a solid of one steradian by a point source whose intensity is 1/60 of 1 cm2 of a blackbody at the solidification temperature of platinum (2042K). One lumen corresponds by definition to 1/683 W of a monochoromatic light of λm=555nm which
18
is the wavelength where V(λ) has its maximum value of unity as shown in Fig 2-2. Therefore, the luminous flux emitted by a source with a radiant flux is given by
6 8 0
V ( ) ( )d (5)Fig 2-2. Human visual response function
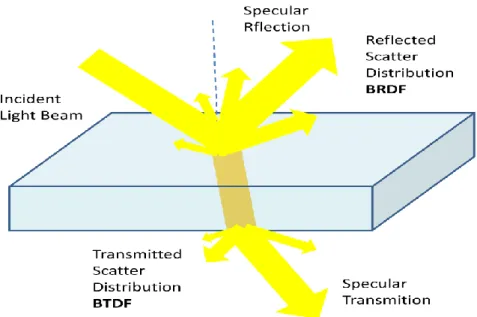
Based on the radiometry and photometry, the bidirectional scattering distribution function (BSDF) which was introduced by Paul Heckbert in 1991[22] is often used to describe the scatter light distribution. In this thesis, the structure of cholesteric liquid crystal was very difficult and complex to build in the optical simulation software. Therefore, the bidirectional reflectance distribution function (BRDF) was adopted to characterize the optics of the cholesteric liquid crystal. BRDF is one branch of BSDF family as shown in Fig 2-3.
19
Fig 2-3. The Schematic of BSDF
The diagram of BRDF is shown in Fig 2-4, and the definition of BRDF is the following equation. ( , , , ) ( , ) ( , ) s s s i i s s i i i dL BRDF dL
(6)Where
i and
i are the angle between the incident direction and the normal direction in the vertical and horizontal planes, respectively.
s and
s are the angle between the reflected scatting direction and the normal direction in the vertical and horizontal planes, respectively. The reflected luminance and the incident luminance can be obtained by measuring instrument so that the BRDF is then obtained. Thus, BRDF can characterize the reflective specifications of samples that enable designers, manufacturers, and users to simplify and check the requirements.In this thesis, the BRDF of cholesteric liquid crystal was measured by Conoscopes[26] in reflective mode. Then the measured data was imported to the optical software, LightTools, to build the optical models of LC structure.
20
Fig 2-4. Diagram of the definition of BRDF[26]
2.3 Optics of Cholesteric LCDs
It has been some 40 years since cholesteric liquid crystal (Ch-LC) were considered as a candidate for an electro-optic flat-panel display. The cholesteric phase is a liquid crystal phase exhibited by chiral molecules or mixtures containing chiral components[7]. A cholesteric liquid crystal is similar to a nematic liquid crystal. It has, however, one property that is different from the nematic liquid crystal, in that it has helical structure as shown in Fig 2-5. The distance along the helical axis for the director to rotate 2π is called the pitch and is denoted by P0. For a given pitch, the optical characteristic of cholesteric liquid crystal is depending on the helical axis as shown in Fig 2-6. In the planar texture, the helical axis is perpendicular to the cell surface as shown in Fig 2-6(a). The material reflects light centered at the wavelength given by λ0=n P0, where n is the average refractive index. If λ0 is in the visible light region, the cell has a bright colored appearance. In the focal conic texture, the helical axis is more or less parallel to the cell surface, as shown in Fig 2-6 (b). When the pitch is short, the choleteric liquid crystal can be regard as a layered structure, which is a multiple domain structure and the material is scattering. When the applied field is
21
larger than a critical fieldEc, the helical structure is unwound with the liquid with the
liquid crystal director aligned in the cell normal direction as shown in Fig 2-6(c), This texture is called the homeotropic texture. With the appropriate surface anchoring condition or dispersed polymer, both the planar texture and the focal conic texture can be stable at zero field.
22
Fig 2-6. The structures of cholesteric textures
The operation principles of Ch-LCDs are illustrated inFig 2-7. In the voltage-off state, the planar texture reflects brilliant colored light if the Bragg reflection condition is satisfied[27]. The circularly polarized light with the same handedness as the helical structure is reflected strongly because of constructive interference. On the contrast, the circularly polarized light with opposite handedness to the helical structure is not reflected because of destructive interference. If the incident light is unpolarized, the light will decomposed into right and left circularly polarized components with one component reflected and the other transmitted. The transmitted one is absorbed by the black paint coated over the rear substrate, as shown inFig 2-7(a). When the voltage is applied, the periodic helical structures are changed to focal conic. Thus, the Bragg
23
condition is destroyed and a dark state is then obtained as show in Fig 2-7 (b).
Fig 2-7. The operation principle of Ch-LCD at (a) Voltage-off and (b) Voltage-on state. Ch-LCDs have advantages of low power consumption, bistable structures, and color filter less. Therefore, Ch-LCDs are suitable for portable devices and E-banner[28], as shown in Figure However, the specular reflection and the surface reflection lower the viewing angle and contrast. Moreover, the color appearance is related to the incident angle from the light source, hence, restricting the practicability of Ch-LCD.
(a) (b)
24
2.4 Summary
The ray-racing method which is based on geometric optics was used to design the proposed method to improve the reflected image quality of reflective Ch-LCD and other reflective displays based on the specular reflection. The optical software, LightTools, was then used to build the simulated environment. Next, the BRDF of cholesteric liquid crystal was measured and imported to the software to simplify the simulation. The basic principle of Ch-LCD is also introduced in this chapter. The Ch-LCDs have the advantages of non-polarizer, non-color filter, and bendable. However, the specular, surface reflection and color shift restrict the applications of Ch-LCD at indoor environment even with the additional light source to enhance the brightness. Therefore, in this thesis, the optical film for improving the brightness and widen the viewing range with additional light source at indoor is proposed.
25
Chapter 3
Fabrication Technology and Measuring
Instruments
The proposed microstructure was a prism structure with specific angles, suitable for diamond micromachining combining and was combined with the roll to roll process. Additionally, the Conoscope system can obtain Ch-LCD BRDF data and evaluate prism array film (PAF) performance. In the following sections, the fabrication process and measurement instruments are presented.
3.1 Fabrication-Diamond Turning
To fabricate the designed microstructures, the diamond turning with a roll to roll process was provided by ITRI, was utilized. A single point diamond tool (SPDT) can be used to fabricate a finished optical component on a precision machine under precisely controlled[31]. Although diamond turning application for optical components started in the 1960s, the technology attracted wider attention in the mid-70s. The process step is as the following:
26
Fig 3-1. Diamond turning fabrication steps
Diamond turning is a multi-stage process. Initial stages of machining are carried out using a series of CNC lathes of increasing accuracy. A diamond-tipped lathe tool is used in the final stage of the manufacturing process to achieve a sub-nanometer level surface. The process finishes with sub-micrometer form accuracies. The surface finish quality is measured as the peak-to-valley distance of the grooves left by the lathe. The form accuracy is measured as a mean deviation from the ideal target form. Finally, the quality and accuracy is monitored throughout the manufacturing process using equipment such as laser profilometers, laser interferometers, optical and electron-microscopes.
The best quality natural diamonds are used as a single-point cutting element
CNC lathes
Diamond-tipped lathe tool
Sub-micrometer
27
during the final stage of the machining process. A CNC SPDT rests atop a high quality granite base, which is placed on air suspension on a solid foundation to keep its working surface strictly horizontal, creating a quality micrometer surface. The machine tool components are placed on top of the granite base and can be moved with high degree of accuracy using a high-pressure air cushion or hydraulic suspension. The machine element is attached to an air chuck that is separated from the electric motor which spins it to another air cushion.
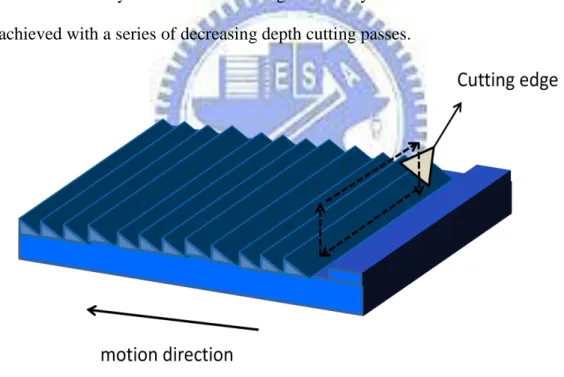
The cutting tool is moved with nanometer precision using a combination of electric motor piezoelectric actuators, as illustrated in Fig 3-2[32]. The motion of the tool is controlled by a list of coordinates generated by a CAD model. The final surface is achieved with a series of decreasing depth cutting passes.
Fig 3-2. Schematic overview of ruling
Additionally, the inclination angle of the cutting edge can be controlled so that the degrees of freedom are enhanced as depicted in Fig 3-3. Therefore, the angle of prisms can be realized by tilting the cutting edge. Moreover, the optical film length can be expanded using a roller design. Cutting edge shape can be a cone, triangle, tetragon, and others.
28
Fig 3-3. Diagram of diamond cutting
3.2 Measurement-Conoscope System
In order to measure the BRDF data of Ch-LCD and evaluate the variation of brightness, the conoscope was utilized in this thesis. The Conoscope system applies Fourier transform lens to transfer light beams and emitted from the test area to a CCD array. Therefore, the angular properties can be easily measured on the CCD sensor plane. The CCD array consists of various directional CCD sensors which detect brightness, color, and angular distribution of transmissive light. Besides, not only tramissive type but also reflective type can be measured through the operation mode. The BRDF can be measured using the finger functionality of illumination as illustrated in Fig 3-4. Furthermore, the finger can also detect the spectrum and provide a photomultiplier function. For reflective mode shown in Fig 3-5, finger is at the Fourier transform plane to illuminate the samples. This collimated light strikes upon the sample surface and be reflected back the system. Thus, the angular distribution can be detected by the CCD-array. BRDF of samples are then be obtained by changing the finger position at the Fourier plane.
29
Fig 3-4. Functionalities of finger in Conoscope system
Fig 3-5. Schematic of the Conoscope in reflective mode
The working principle of transmissive mode is depicted in Fig 3-6, where the first lens provides a Fourier transform image of the display surface. Each light emitted from the test area at incident angle, θ, will be focused on the focal plane at the same azimuth and at a position x=F(θ). The sample angular characteristics are thus measured simply and quickly, without any mechanical movement.
Test sample
Fourier lens
Fourier transform plane (Finger)
30
Fig 3-6. Schematic of the Conoscope in transmissive mode
3.3 Summary
In order to simplify the simulation and evaluate the designed optical film performance, the Conoscope system, which can measure the test sample BRDF and reflected angular luminance distribution, was adopted. Then the measurement result was imported into simulation software to build the corresponding model.
Additionally, the process method for fabricating the PAF was introduced. The method of diamond turning provides high accuracy and high efficiency what are required for optical films.
31
Chapter 4
Design Method and Simulation
The design method for solving the issues of Ch-LCDs specular reflection with the supplemental light source is described in this chapter: asymmetrical microlens array and prism array were used to refract and redirect the specific incident light to the desired viewing zones. By using simulation software, the simulation models of designed optical film were built and the results are shown in this chapter as well.
4.1 Design of Asymmetrical Microlens Array
As section 1.2 and 2.3 mentioned that the general issues of reflective type LCDs with metal-reflector and the characteristic of Ch-LC planar state were specular reflection and surface reflection, the optical film was an efficient way to solve these issues. Because our objective was to apply Ch-LCD to indoor billboard, the ambient light might not provide adequate light to illuminate. Thus, the supplemental light source was necessary. Our group has proposed MAMA-LCF for portable reflective displays to enhance the brightness and contrast ratio near normal viewing direction. However, the design was not suitable for billboard application. As shown in Fig 4-1, MAMA-LCF was designed for the portable devices, thus, the viewing zone was narrow. Furthermore, the multi-direction of microlens was for ambient illumination. For a specific light source, the enhancement of one direction will higher. The idea for new design continued using the asymmetrical microlens array due to the oblique incident light. The function of micro-lens was not just focusing, but to spread the reflected light to the desired viewing zone. Therefore, the slope set of microlens was
32
the key point of this design. The schematic of Ch-LCD is shown in Fig 4-2 and the viewing angle is shown in Fig 4-3 according to the position of viewers and display, so the reflected light should redirect to the range, which is 0 to 25 degree.
(a) (b) Fig 4-1. Schematic of (a) MAMA-LCF and (b) MAF
Fig 4-2. Schematic of Ch-LCD e-banner Ambient light MAMA-LCF Light source MAF Light source 2m 30cm 5° 14°
33
Fig 4-3. The related position of the display and viewers
To evaluate the suitable slope that could redirect light to viewers, the relationship of incident angle, reflection angle and microlens slope, were analyzed as illustrated in Fig 4-4. Assume lens-A is where the light incidents on the optical film and lens-B is where the light exits. The incident angle is ρ and the reflection angle is σ with respect to the normal direction of the optical film. α and β are the angle between the lens curve slope and horizontal axis of lens-A and lens-B respectively. The Ch-LC reflective characteristic is near specular reflection that can be treated as a mirror. Thus, the relationship can be analyzed by ray tracing method as the following equation.
1s i n1 ( 1
film
n sin( )) (7) s i n1(nfilm(1 )) (8)
34
Fig 4-4. The condition of incident and reflection angle
The analysis result is shown in Fig 4-5. Because the application was for billboard, the uniformity was taken consider to avoid non-uniform reflected image due to the light source position. Therefore, the display was divided into three divisions. The color variation is the related reflection angle of different α and β. The mark areas in Fig 4-5 are the desired reflection angle according to the viewers, hence, the suitable prism angle range of each area can be obtained.
σ ρ α β Lens-A Lens-B Microlens Ch-LCD θ1 θ2
35 (a) (b)
α (degree)
β
(degree)
σ (degree)
ρ
σ
36 ^ ^ sin ) ( cos ) ( ) ( r i r j r ^ ^ ' '
( ) d r [ ( ) cos ( ) sin ] [ ( ) sin ( ) cos ]
T r r i r r j d ^ ^ ^ cos sin i j n
(c)Fig 4-5. The contour of reflection angle for light incident on (a) top, (b) middle, and (c) bottom of the display
Furthermore, the shape of curved surface was also considered. Assume the angle between the incident light wavefront and the normal direction of the substrate is , and the curved surface can be expressed as
(9) which is illustrated in Fig 4-6. Then its tangent vector is
(10) The wavefront unit vector of incident light is
(11) Therefore,the curve surface weighting with respect to the incident light wavefront is (12) ) ( ) ( ) , ( ^ T T n W
37
According to Eq. (10), the higher the weighting is, the higher the related slope to the incident light. Therefore, the lens shape can be determined.
Fig 4-6. The weighting of curved surface to the wavefront of incident light
4.2 Simulation Model of Microlens Array Film
The simulation software, LightTools, was adopted to design the microlens array film (MAF) in this thesis. LightTools follows the ray-tracing method and can model real objects in simulation. The Ch-LCD BRDF which was measured using the collimated light source in Conoscope is shown in Fig 4-7. The profile of BRDF shows similar distribution compared with specular reflection. The peak at 50 degree was lower due to a bit of scatter by Ch-LC. Thus, the value around 50 degree was higher than the value around 40 and 60 degree. Besides, the simple configuration of Ch-LCD as depicted in Fig 4-8 was created using LightTools and the Ch-LC was substituted by the measured BRDF.
38
Fig 4-7. Measured BRDF of Ch-LCD
Fig 4-8. Schematic diagram of Ch-LCD configuration
The lens shape, which was determined by the curved surface weighting with respect to the incident light wavefront, was a parabolic curve. The formula of the parabola is: 2 2 cx z (13) where z is the vertical distance from the optical film substrate, x is the horizontal position, and c is the curvature of the parabola as shown in Fig 4-9.
0 20 40 60 80 100 -100 0 100 200 300 400 500 600 700 800 900 1000 1100 1200 1300 1400 B RDF (a.u) Viewing angle Incident angle 0 10 20 30 40 50 60 70 ° ° ° ° ° ° ° ° (°)
39
Fig 4-9. Schematic of microlens
Ray-tracing results were used to examine redirected light direction of mircolens, as shown in Fig 4-10. The incident light first refracted by the microlens and then reflected by Ch-LC. Finally, the reflected light refracted by the microlens again. Therefore, the light can be redirected to the desired viewing zone by optimizing the pitch and spacing between the microlens.
Fig 4-10. Ray-tracing of MAF
4.3 Simulation Result of Microlens Array Film
To ensure the reflected light do redirect to the desired viewing zone and avoid non-uniform reflected image, the uniformity was taken consider. The uniformity was defined by the lowest reflected luminance over highest one among 5 point as shown in Fig 4-11. Detection point spot size was 2mm as same as Conoscope spot size. On the
Microstructure Substrate
Ch-LC
40
other hand, the uniformity of horizontal direction was not considered due to the microlens array direction. Since the microlens array was one direction for redirecting the vertical light distribution, the horizontal light distribution was related to the light source length.
Fig 4-11. Schematic of uniformity detection point
The parameters were optimized by evaluating the uniformity. One was the spacing between the microlens structures, and the other was microlens pitch as illustrated in Fig 4-12. Spacing was regard as zero curvature. If spacing increased, the main reflected light distribution redirected to larger angles and then affected uniformity. Microlens pitch controlled the weighting to the incident light wavefront. The simulation results are shown in Fig 4-13. Therefore, the spacing and pitch should be 5μm and 30μm.
41
Fig 4-12. The simulation parameters for uniformity
(a) (b)
Fig 4-13. Simulation results of (a) spacing (b) pitch for uniformity
However, the cost for fabricating such division microlens with different slope range was expensive. To lower the cost and fabrication complexity, prism structure substituted for microlens. The prism design will be described the following section.
4.4 Simulation Result of Prism Aarray Film
The design rule followed section 4.1 because the curved surface slope could be regard as prism angle as shown in Fig 4-14. Thus, the prism angles should cover the
42
range from 0 to 30 degree. However, prism is not a curved surface and the period will be very large to let human eyes perceive moiré phenomenon if manufacturing every degree from 0 to 30 degree. Moreover, prism is hard to fabricate under such precision angle. Therefore, the prism was designed based on the angle of cutting edges which were provided by ITRI. To simplify the fabrication complexity, each prism angle variation was simulated including 3, 4, and 5 degree as shown in Fig 4-15 (a). By examining the desired viewing zone, the result showed that the smaller prism angle variation, the smoother reflected angular distribution becomes. To look at both side of the designed angle range and microstructure period, the angle variation was chose 3 degree. Group spacing was introduced to improve uniformity, since the prism angle, which was lower than 10 degree, couldn’t be fabricated using the equipment. Fig 4-15 (b) shows that when the spacing was 75 μm, the uniformity was about 80%. Thus, the optimized spacing was obtained. The peak at smaller spacing was caused by the peak shift of reflected distribution, which was greatly affected by spacing, since the viewing angle of each position on display was different. The PAF designed result is shown in Fig 4-16.
43
(a) (b)
Fig 4-15. Simulation results of (a) prism angle variation and (b) group spacing
Fig 4-16. Designed result of PAF
0 10 20 30 40 -10 0 10 20 30 40 50 60 70 80 90 Refl ec ted l umi nan c e (ni ts ) Viewing angle 3 4 5 ° ° ° (σ) 0 20 40 60 80 100 0 10 20 30 40 50 60 70 80 U n if o rm it y (% ) Group spacing(um) 10 ° 13 ° 16 ° 19 ° 22 ° 25° 10 ° 13 ° 16 ° 19 ° 22 ° 25° 75um
44
4.5 Summary
The asymmetrical microlens array was designed for redirecting light to desired viewing zone by ray-tracing method, and the designed profile was parabola because of the weighting to the incident light wavefront. The optimized parameters were pitch and spacing for obtaining best uniformity to avoid non-unifrom reflected image. For optimizing the microlens, Ch-LCD configuration model was built in LightTools. In the simulation, when pitch and spacing was 30 μm and 5 μm respectively, uniformity exceeded 80% in 0 to 25 degree viewing zone. However, such microlens resulted in high cost and difficult to realize. The prism structure then substituted for microlens. Based on the available cutting edge angles, prism was designed by optimizing the spacing and prism angle variation. To ensure prism angle range cover 0-30 degree and avoid visible period, group spacing and each prism angle variation was chosen as 75 μm and 3 degree, respectively. Finally, the designed optical film was fabricated using diamond turning provided by ITRI. The experimental results of Ch-LCD with PAF and combination with other reflective displays will be then presented in next chapter.
45
Chapter 5
Experimental results and Discussions
Experimental results will be presented in this chapter, such as the fabricated PAF, comparison of bare Ch-LCD and structure with PAF, and with 50 haze optical adhesive. Additionally, PAF was applied to other reflective type LCDs, which are based on specular reflection. In addition, a brief discussion and summary will be described.
5.1 Experimental result of Ch-LCD with PAF
A muti-angle prism array film was fabricated. Fig 5-1 shows the photo taken using optical microscope with a magnification of 40X and the fabricated PAF. The pitches of each prism structure were 30 μm and the spacing between the prism structures was 75 μm. The fabrication error of horizontal axis was about 3μm.
(a) (b)
Fig 5-1. (a) Plane view of the asymmetrical prism array and (b) tube-shaped PAF
75um 30um
46
The configuration of Ch-LCD with PAF was measured and compared to the simulation result and the bare test panel. The measured angular-dependent reflectivity of the cholesteric panel is shown in Fig 5-2. Simulation and experimental curves were similar as shown in Fig 5-2 (a). The difference might cause by the orientation of prism position in fabrication as shown in Fig 5-3. Under a collected illumination of -30 degree, specular reflection occurred at 30°. The reflectance was high, but contrast ratio was poor at this angle. The laminated PAF not only shifted the reflected distribution to 0 to 25 degree, but also enhanced the reflectance to about 2.5 times MgO at normal viewing direction. Additionally, CR was improved to about 14.
(a) (b)
Fig 5-2. Measured reflectance of Ch-LCD as a function of viewing angle under -30° illumination from, compared with (a) the simulation result and (b) bare Ch-LCD
0 10 20 30 40 50 0 5 10 15 20 25 30 Refl ectance ( x Mg O ) Viewing angle() Bare Ch-LCD Ch-LCD-PAF 0 10 20 30 40 50 0.0 0.2 0.4 0.6 0.8 1.0 1.2 N orm aliz ed ref lec ted bright nes s Viewing angle () Simulation Experiment 1
47
Fig 5-3. The difference of design and fabrication result of 10°, 13°, and 16° prisms The photographs of displayed image using PAF on a color flexible Ch-LCD were taken under illumination from a lamp as shown in the Fig 5-4. The displayed image shows red, blue, and green colors with and without PAF as shown in Fig 5-4(a). Obviously, the NCTU characters have higher reflectance than the area without PAF. The optical mechanism also works when the display is bent as illustrated in Fig 5-4(b). Therefore, higher reflectance by PAF was clearly demonstrated.
(a) 0.00 0.02 0.04 0.06 0.08 0.10 0.000 0.002 0.004 0.006 0.008 0.010 0.012 Hei ght (mm) Position (mm) Ideal prism Fabricated prism 10 ° 13 ° 16 °
With PAF
W/o PAF
48 (b)
Fig 5-4. Samples photographs of (a) color Ch-LCD and (b) bent Ch-LCD. The display images with PAF clearly show better image quality.
For our target whose size was 200cm by 30cm, the reflected angular distribution showed higher reflectance in 0 to 25 degree viewing zone. The viewing angles from 2 meters away were 0 to 20 degree. In Fig 5-5 the sample size was 25cm by 15cm and PAF did effectively enhance the reflectance of whole coverage region under a RGB LED illumination system. Therefore, the PAF has potential to be applied for Ch-LCD E-banner.
49
Fig 5-5. Examination of PAF on 25cm by 15cm color Ch-LCF
Haze adhesive with PAF
However, since the prism array direction is one dimension, the horizontal viewing angle was not enhanced by PAF and it was related to light source length. The optical adhesive with haze value was an efficient way to improve this issue. The scattering ability could widen light distribution as illustrated in Fig 5-6. The higher haze value, the widen scattering becomes. Therefore, by combing suitable haze, the total viewing angle could be further enhanced.
Fig 5-6. The scattering ability of different hazes
For instance, the haze of test sample was 50 and compared with the configuration
25cm
15cm
With PAF
50
only with PAF as shown in Fig 5-7. The normal viewing direction brightness was about the same in both two cases. However, the differences appeared when viewing at larger angles. Fig 5-7 (b)(c) shows the horizontal viewing angle at 20 and 40 degree, respectively. Apparently, haze shows higher reflectance than only with PAF. This effect can be clearly seen from the polar plot as shown in Fig 5-9. The latitude is vertical viewing angle and the longitude is horizontal viewing angle as shown in Fig 5-8. As the marked area shows, the distribution was expended using the haze adhesive. Although the brightness at the brightest area decreased, the available viewing zone increased. Consequently, the scatter effecting using haze adhesive was demonstrated.
(a) (b) (c) Fig 5-7. The display images of 0°, 20°, and 40° horizontal viewing angle
0 °
20°
40°
Ch-LCD + Haze + PAF
Ch-LCD + PAF
B
G
R
51
Fig 5-8. The coordinates of polar plot
Fig 5-9. The polar plots of with and without haze adhesive under collimated illumination from -30°
5.2 Other Displays with PAF
Ch-LCD of different rubbing directions52
larger than E-book. Therefore, PAF also can be applied to portable devices. For the test samples in hand, the rubbing directions of Ch-01 and Ch-02 were perpendicular and parallel to the bank structure direction, respectively. Fig 5-10 shows the measured result of Ch-01 and Ch-02 with and without haze adhesive and PAF (H-PAF) under a -30 degree collimated illumination. Comparing Ch-01 and Ch-02 without H-PAF, Ch-01 had slightly higher scatting. Thus, rubbing direction affected reflective characteristic of Ch-LC. Using H-PAF Ch-01 and Ch-02 were enhanced the brightness about 11 times and 40 times at normal viewing angle compared to bare cases and the reflectance were both about 3 times MgO at zero degree. The enhancement reached several times may be because when rubbing direction is parallel to bank structure direction, Ch-LC acts like a mirror. Therefore, the brightness of normal direction was extremely low under oblique illumination as shown in Fig 5-11(a). The CR of Ch-01 and Ch-02 with H-PAF was 15 and 11.
(a) (b)
Fig 5-10. Measured reflectance of (a) Ch-01 and (b) Ch-02 with and without H-PAF
(°) 0 10 20 30 40 0 1 2 3 4 5 6 7 8 9 10 Refl ectance( x Mg O ) Viewing angle Bare Ch-02 With H-PAF (°)
MgO standard line MgO standard line
0 10 20 30 40 0 1 2 3 4 5 6 7 8 9 10 Refl ectance( x Mg O ) Viewing angle Bare Ch-01 With H-PAF
53
(a) (b)
Fig 5-11 The photographs of (a) Ch-01 and (b) Ch-02 with and without H-PAF
Electrowetting display
EWD can be operated in three modes: transmissive, reflective, and transflective modes. Therefore, electrowetting display is suited for use in mobile applications such as e-paper, mobile phone, GPS devices.
However, the reflective characteristic of EWD is based on the reflector behind the transparent electrode. Therefore, PAF and haze adhesive was introduced to enhancing the normal brightness. The photographs shown in Fig 5-12 is the EWD with and without PAF under illumination from a table lamp. The aluminum reflector reflected light to the corresponding reflection angles. Hence, the brightness was low at normal direction. Fig 5-13 plots the measured reflectance with and without PAF under 30 degree collimated illumination. The structure using PAF shows a higher refleance in the 0°-20° viewing zone and enhanced the average display brightness by a factor 2.2 to that of MaO standard white. Therefore, the light redistribution of PAF on EWD was demonstrated.
54
Fig 5-12. The EWD reflected image with and without H-PAF
Fig 5-13. Measured reflectance of EWD with and without PAF under a -30° illumination With H-PAF W/o H-PAF 0 10 20 30 40 0 1 2 3 4 5 Viewing angle () Refl ec tan c e (x Mg O ) Bare EWD With H-PAF
55
5.3 Summary
PAF was fabricated and combined with configuration of a color flexible Ch-LCD. The experimental results showed that the reflected light angular distribution ranged from 0 to 25 degree under a collimated illumination of -30 degree using PAF. Compared with bare Ch-LCD, the reflectance was 5 times higher at normal viewing and CR was 14. To verify that whether PAF can be applied for our target, PAF covered half of test sample whose size is 25cm by 15cm. The result showed that PAF successfully enhanced the reflectance of entire covering region. On the other hand, the horizontal viewing angle was not enhanced using PAF due to prisms orientation. The optical adhesive with haze value was introduced to improve this issue. From the polor plot, the horizontal angular distribution was extended using haze adhesive and the photos also agreed with this result.
Moreover, PAF can be applied to the different robbing directions. From experimental results, the brightness at 0 degree was highly increased using PAF under a 30 degree illumination and CR was over 10.
In addition, the enhancement using PAF with haze adhesive on an electroweeting display was demonstrated. The average brightness using PAF was 2.2 times MgO in 0°-20° viewing zone, which was enough for reading.
However, the enhancement will decrease when applied to stronger scattering of reflector. Since the light redistribution mechanism of PAF will be destroyed by the scattering. Therefore, PAF cannot be applied to the reflective displays which are highly scattering.
56
Chapter 6
Conclusions and Future work
6.1 Conclusions
To reduce power consumption and readable under sunlight, reflective type LCDs are apply to portable devices and E-banner market. However, specular reflection and surface reflection result in limited viewing angles and low CR, which restrict reflective LCDs applications.
In this thesis, the optical film was designed for solving the issues of Ch-LCDs, which was applied as indoor billboard with supplemental light source. The simulation model was built to optimize the parameters due to fabrication limitation. The microlens array was designed by analyzing the relationship of microlens slope, incident angle, and reflection angle for three divisions. Lens shape was determined by the weighting of curved surface to the wavefront of incident light. From simulation result, when spacing between each lens was 5μm and lens pitch was 30μm, the uniformity was about 80%. However, such microlens was expensive to fabricate. Therefore, prism structure was substituted for microlens. The design idea was the same. Simulation was built based on the provided angles of cutting edge. The design result was including six prisms and each prism angle variation was 3 degree. Roll-to-roll process was applied to fabricate the prism film. The experimental results indicate that the brightness enhancement was 5.5 times higher than bare Ch-LCD under illumination from a lamp at normal direction and CR was 14. From the verification of test sample, PAF has potential to be applied for Ch-LCD E-banner.
57
Furthermore, the horizontal viewing angle can also be enhanced by combining optical adhesive with haze value. Therefore, the high reflectance by PAF was demonstrated.
Additionally, PAF was also tested on different rubbing directions Ch-LCDs and EWD. The performances using PAF were improved. Therefore, PAF also has potential to be applied for portable devices.
6.2 Future work
The optical haze adhesive can improve the viewing angle, but it will lower the contrast ratio due to the scattering ability. To improve this, the different robbings of Ch-LC may be an efficient way. In section 5.2, the reflected distributions of different robbing directions of Ch-LCD were measured, as shown in Fig 6-1. Obviously, robbing direction affects the scattering ability of Ch-LC. The contrast ratio of Ch-01 and Ch-02 using haze PAF were 15 and 11 at 0 degree, respectively. Thus, the viewing zone can be further improved without lowering contrast ratio.
0 10 20 30 40 0.0 0.1 0.2 0.3 0.4 0.5 0.6 0.7 0.8 0.9 1.0 Refl ec tan c e (x Mg O ) Viewing angle Ch-01 Ch-02

![Fig 1-5. Schematic of the working principle of MTN LCD [11] Super-twsited nematic LCDs](https://thumb-ap.123doks.com/thumbv2/9libinfo/8494123.184835/17.892.141.748.263.721/fig-schematic-working-principle-super-twsited-nematic-lcds.webp)