This content has been downloaded from IOPscience. Please scroll down to see the full text.
Download details:
IP Address: 140.113.38.11
This content was downloaded on 28/04/2014 at 10:08
Please note that terms and conditions apply.
Nanosurface design of dental implants for improved cell growth and function
View the table of contents for this issue, or go to the journal homepage for more 2012 Nanotechnology 23 335703
(http://iopscience.iop.org/0957-4484/23/33/335703)
Nanotechnology 23 (2012) 335703 (11pp) doi:10.1088/0957-4484/23/33/335703
Nanosurface design of dental implants for
improved cell growth and function
Hsu-An Pan
1, Yao-Ching Hung
2,3, Jin-Chern Chiou
4, Shih-Ming Tai
1,
Hsin-Hung Chen
5and G Steven Huang
11Graduate Program for Nanotechnology, Department of Materials Science and Engineering, National Chiao Tung University, Hsinchu, 300, Taiwan, Republic of China
2College of Medicine, China Medical University, Taichung, 40402, Taiwan, Republic of China 3Department of Obstetrics and Gynecology, China Medical University Hospital, Taichung, 40402, Taiwan, Republic of China
4Institute of Electrical Control Engineering, National Chiao Tung University, Hsinchu, 300, Taiwan, Republic of China
5Fame Dental Clinic, 1F, No. 6, Aly 4, Ln 27, Sec. 4, Ren-ai Road, Da-an District, Taipei City 106, Taiwan, Republic of China
E-mail:gstevehuang@mail.nctu.edu.tw
Received 12 April 2012, in final form 12 July 2012 Published 3 August 2012
Online atstacks.iop.org/Nano/23/335703 Abstract
A strategy was proposed for the topological design of dental implants based on an in vitro survey of optimized nanodot structures. An in vitro survey was performed using nanodot arrays with dot diameters ranging from 10 to 200 nm. MG63 osteoblasts were seeded on nanodot arrays and cultured for 3 days. Cell number, percentage undergoing apoptotic-like cell death, cell adhesion and cytoskeletal organization were evaluated. Nanodots with a diameter of approximately 50 nm enhanced cell number by 44%, minimized apoptotic-like cell death to 2.7%, promoted a 30% increase in microfilament bundles and maximized cell adhesion with a 73% increase in focal adhesions. An enhancement of about 50% in mineralization was observed, determined by von Kossa staining and by Alizarin Red S staining. Therefore, we provide a complete range of nanosurfaces for growing osteoblasts to discriminate their nanoscale environment. Nanodot arrays present an opportunity to positively and negatively modulate cell behavior and maturation. Our results suggest a topological approach which is beneficial for the design of dental implants.
S Online supplementary data available fromstacks.iop.org/Nano/23/335703/mmedia (Some figures may appear in colour only in the online journal)
1. Introduction
For dental implants, surfaces are moderately roughened to promote osseointegration [1, 2]. Studies have shown that osteoblast-like cells favor microstructured surfaces [3–6]. Roughened surfaces enhance focal adhesion and guide cy-toskeletal assembly and membrane receptor organization [7, 8]. Moreover, rough implant surfaces have been shown in in vitroexperiments to enhance the adsorption of fibronectin and albumin [9, 10], which are important extracellular matrix molecules for cell focal adhesion. Methods including acid-etching, plasma-spraying, grit-blasting, vapor
deposi-tion, anodizadeposi-tion, and other coating technologies that have been developed to fabricate micro- and nanostructures. These different modifications, which result in a variety of surface chemistries and topographies, have led to ambiguous responses by osteoblasts [11–13]. There are considerable disagreements concerning the optimal physicochemical prop-erties and surface geometries for the endosseous portion of a dental implant.
Identifying the optimal surface for a bio-implant interface is an important task in tissue engineering [14, 15]. Many studies indicate that various nanostructured surfaces can influence the in vitro adhesion [16–18], morphology [19–21],
proliferation [22], and gene expression [23] of different cell types. The cellular response to a nanostructured substrate depends on the size arrangement of the topographic features and cell type [24,25]. Nanostructures such as nanofibers [26], sharp tips [16], and nanotubes [27] interact with cells and direct proliferation. The topological design of implant surfaces is one of the important factors for the fabrication of medical implants [28,29].
Nanoscale modification of the implant surface may alter the surface reactivity of endosseous implants. The surface roughness influences the production of growth factors, cytokines and mRNAs, suggesting that the substrate modulates the activity of the cells that are adjacent to an implant; this roughness subsequently affects the response of the adjacent skeletal tissue and the success of the implant [30, 31]. Moreover, surface topography affects the amount of bone that is deposited adjacent to the implant and bone, and its formation can be guided by the specific implant topography [32]. Thus, surface topography plays a critical role in the interaction of dental implants with adjacent tissues [33, 34]. Nanoscale topography may provide biomimetic surfaces that support hydroxyapatite mineral formation [35] and the related organic phase guidance of bone mineralization [36].
Nanotopographical surface affects cellular behavior in a wide range of cell types including epithelial cells, fibroblasts, myocytes, and osteoblasts [37]. Nanoscale features alter osteoblastic attachment, proliferation, differentiation, and ma-trix production [38,39]. Up-regulation of osteoblast prolifera-tion is observed on the nanoscaled surface of materials such as alumina, titania, and calcium phosphate [40]. An interesting feature of nanoscale topographic surfaces is the selectivity for cell adhesion. Several investigators have demonstrated the relative diminution of fibroblast adhesion compared to osteoblast adhesion when nano- and micro-structured surfaces were evaluated [41, 42]. Nanotopography-induced cellular response has been explored using nanoislands [43]. Osteoblastic cells respond differentially to nanoislands with height varying between 11 and 85 nm. However, until recently, no attempt has been made to utilize a systemic nanoscale environment to investigate the optical range of nanostructure for cell growth.
This study is based on the hypothesis that nanotopog-raphy may modulate and control the growth, proliferation, and biological function of osteoblasts. Arrays of nanodots with defined diameters and depths can be fabricated using aluminum nanopores as a template during the oxidation of tantalum thin films. The dot size and depth of the dots are well controlled. We previously demonstrated that an integrated nanodevice containing nanodot arrays with dot diameters ranging from 10 to 200 nm can be used to evaluate cell behavior. Nanodevices may be used as a detecting platform for the rapid modulation of proliferation, apoptosis, invasive ability, and cytoskeletal reorganization in different cell types [44]. The application of an assembly containing a range of nanostructures should be capable of obtaining parameters that are useful in the design and evaluation of artificial implants for tissue engineering.
2. Materials and methods
2.1. Fabrication of nanodot arraysThe nanodot arrays were fabricated as described [45]. A tantalum nitride (TaN) thin film (200 nm thick) was deposited onto a 6-inch silicon wafer; a 400 nm thick aluminum layer was then deposited onto the TaN layer. Anodization was conducted in 1.8 M sulfuric acid at 5 V for the 10 nm nanodot arrays, in 0.3 M oxalic acid at 25 V for the 50 nm nanodot arrays, in 0.3 M oxalic acid at 100 V for the 100 nm nanodot arrays, and in 5% (w/v) phosphate acid (H3PO4) at 100 V for the 200 nm nanodot arrays. In the first instance, the upper aluminum layer oxidized to alumina, accompanied by the outward migration of Al3+and inward diffusion of O2−driven by the applied electric field, leading to vertical pore channel growth. The dissolution of alumina at the alumina/electrolyte interface is in equilibrium with the growth of alumina at the Al/Al2O3 interface. As the oxide barrier layer at the pore bottom approaches the TaN/Al interface, the O2− migrating inwards through the alumina barrier layer are continuously injected into the Ta layer and form tantalum oxide. The underlying tantalum oxide layer is formed by O2− transported through/from the barrier layer of the initially formed porous alumina without direct contact of tantalum with the electrolyte. The anodic reaction of TaN results in the formation of tantalum oxide accompanied by formation of hemispherical structures due to volume expansion. Eventually, the aluminum is completely transformed into alumina accompanied the end of the anodic process. The porous alumina was removed by immersion in 5% (w/v) H3PO4 overnight. A thin layer of platinum (about 5 nm) was sputtered onto the structure to improve its biocompatibility. The dimensions and homogeneity of the nanodot arrays were measured and calculated from images taken with a JEOL JSM-6500 TFE-scanning electron microscope (SEM). The sizes of the nanodots were found using ImageJ software and expressed in terms of diameter. We randomly picked 30 nanodots from each substrate field and calculated the diameter of the dots. Three random substrate fields were measured per sample and three separate samples were measured for each surface.
2.2. Cell culture
MG63 osteoblast-like cells were originally isolated from a human osteosarcoma. The cell culture experiments were performed with the osteoblastic cell line MG63 (BCRC no. 60279, Bioresources Collection and Research Center, Taiwan). The cells were seeded in substrates and cultured in Eagle’s minimum essential medium with 2 mM L-glutamine and Earle’s BSS adjusted to contain 1.5 g l−1 sodium bicarbonate, 0.1 mM non-essential amino acids, and 1.0 mM sodium pyruvate. The Eagle’s minimum essential medium was supplemented with 10% fetal bovine serum (Gibco Invitrogen) at 37◦C in 5% CO2.
2.3. Scanning electron microscopy
The harvested cells were fixed with 1% glutaraldehyde in phosphate-buffered saline (PBS) at 4◦C for 20 min, and then treated in 1% osmium tetroxide for 30 min. Dehydration was performed with a series of ethanol concentrations (5 min incubations each in 50, 60, 70, 80, 90, 95, and 100% ethanol) followed by air drying. The specimen was sputter-coated with platinum and examined with a JEOL JSM-6500 TFE-SEM at an accelerating voltage of 10 keV.
2.4. Measurement of cell number by cell density
Cells were double stained using 40 ,6-diamidino-2-phenylin-dole (DAPI) and phalloidin. MG63 cells were harvested and fixed using 4% paraformaldehyde diluted in PBS for 30 min, followed by three washes in PBS. Cell membranes were permeabilized during 10 min incubation in 0.1% Triton X-100, followed by three PBS washes. MG63 cells were incubated with phalloidin and nuclei counterstained with DAPI for 15 min at room temperature. Samples were mounted and imaged using a Leica TCS SP2 confocal microscope. Cell number was counted using ImageJ software and expressed in terms of cell density. Six different substrate fields were measured per sample and three separate samples were measured for each surface.
2.5. Immunostaining of vinculin and the microfilament bundles
The cells were harvested and fixed with 4% paraformaldehyde in PBS for 15 min and then washed three times in PBS. The membranes were permeabilized by an incubation in 0.1% Triton X-100 for 10 min, washed three times in PBS, blocked with 1% bovine serum albumin (BSA) in PBS for 1 h, and then washed three times in PBS. The samples were incubated with an anti-vinculin antibody (properly diluted in 0.5% BSA) and phalloidin for 1 h, incubated with Alexa Fluor 488-conjugated goat anti-mouse antibody for 1 h, and then washed three times in PBS. Immunostaining with anti-vinculin antibody and phalloidin were performed. For each experimental condition, the number of vinculin plaques and microfilament bundles per cell were counted and compared to that for cells that were cultured on a flat surface. The diameter of the actin filament is ∼8 nm which is beyond the resolution of our microscope. The fibrous structure that we observed is apparently microfilament bundles. Actin filaments are assembled in two general types of structures: bundles and networks. These structures are regulated by many other classes of actin-binding proteins. With confocal microscopy, an estimation for the number of microfilament bundles can be obtained by building a three-dimensional cell superimposed image. Since the length and exact diameter of microfilament bundles are difficult to quantify the measurement of microfilament number is meant to be semi-quantitative to estimate the cytoskeleton organization of cultured osteoblasts. Twelve cells were measured per sample and three separate samples were measured for each surface. The plots were fitted using Origin software (Northampton, USA).
2.6. von Kossa staining
MG63 cells were harvested and fixed with 95% ethanol for 1 h and then washed three times with deionized (DI) water. The samples were treated with a 5% silver nitrate solution, exposed to UV light for 20 min, and then washed three times with DI water. The samples were treated with a 5% thiosulfate solution for 5 min and then washed three times with DI water [46,47]. The phosphate ion precipitation was demonstrated following dark brown colored nodular staining, confirming the formation of minerals in the osteoblast cultures. The mineralized nodules were counted under a microscope. Three random substrate fields were calculated per sample and three separate samples were measured for each surface.
2.7. Alizarin Red S staining
The MG63 cells on the substrates were washed with PBS and fixed with 4% paraformaldehyde for 10 min. The fixed cells were soaked in 0.5% Alizarin Red S in PBS for 10 min at room temperature and then washed with water to remove the remaining stain [48, 49]. The extent of mineralized nodule formation based on the number of nodules was determined by Alizarin Red S staining at 7 days. The mineralized nodules were counted under a microscope. Three random substrate fields were calculated per sample and three separate samples were measured for each surface.
2.8. Statistics
The experimental data were expressed as the mean ± standard deviation. One-way analysis of variance followed by a Tukey post-test was used for statistical analysis (SPSS 13.0 software, Chicago, USA), and the level of significance was set at∗P< 0.05.
3. Results
3.1. Nanotopology of dot arrays
Nanodot arrays were fabricated on tantalum-coated wafers by anodic aluminum oxide (AAO) processing. Tantalum oxide nanodot arrays with dot diameters of 10, 50, 100, and 200 nm were constructed on silicon wafers (figure S1 available from stacks.iop.org/Nano/23/335703/mmedia). To provide a biocompatible and unique interacting surface, platinum with a thickness of about 5 nm was sputter-coated onto the top of the nanodots. SEM images showed diameters of 10 ± 3, 52 ± 6, 102 ± 9, and 212 ± 19 nm for the 10, 50, 100, and 200 nm dot arrays, respectively (figure 1); the dot-to-dot distances were 22.8 ± 4.6, 61.3 ± 6.4, 108.1 ± 2.3, 194.2 ± 15.1 nm, and the average heights were 11.3 ± 3, 51.3 ± 6, 101.1 ± 10, and 154.2 ± 28 nm, respectively. The dimensions of the nanodots were well controlled and highly defined.
Figure 1. SEM images of the nanodot arrays that are used in the topological survey. The images are arranged from left to right: the 10 nm nanodot array (10 nm), the 50 nm nanodot array (50 nm), the 100 nm nanodot array (100 nm), and the 200 nm nanodot array (200 nm).
3.2. The topology controlled the cell number, percentage of cells undergoing apoptotic-like cell death, and adhesion of MG63 osteoblasts
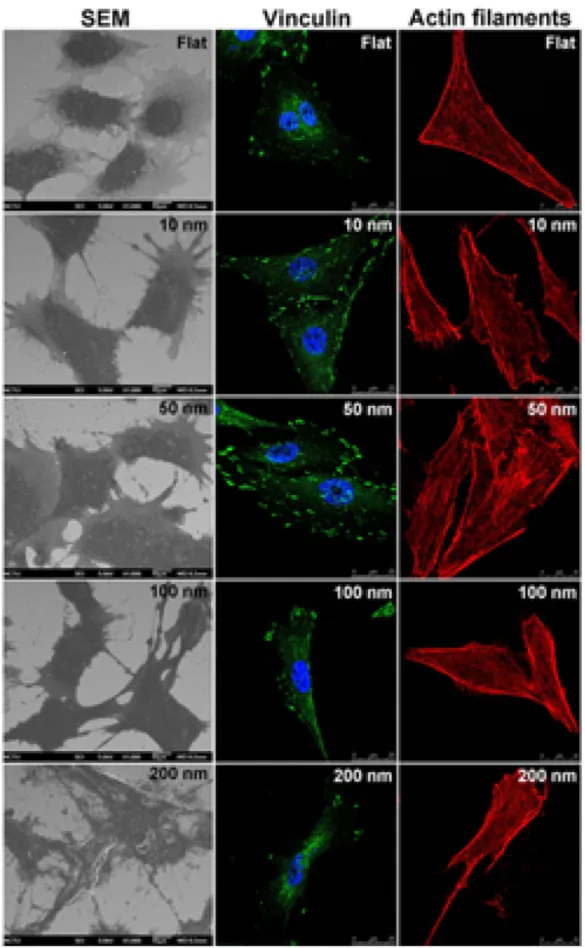
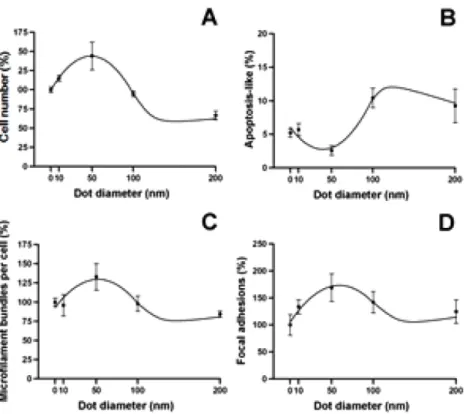
MG63 osteoblasts were cultured on fabricated nanodot arrays at densities of 1000 cells per square centimeter. The cells were harvested 3 days after seeding. SEM was performed to examine the cell number and apoptotic-like morphology of the cells (figure2). The number of focal adhesions is the hallmark for cell attachment and can be evaluated by immunostaining against vinculin. The organization of the cytoskeleton was visualized by immunostaining for the microfilament bundles (figure3). To evaluate the size effect of the nanodot arrays, the per cent cell number, the percentage of apoptotic-like cells, the number of focal adhesions, and the number of microfilament bundles were drawn against the dot diameters (figure4).
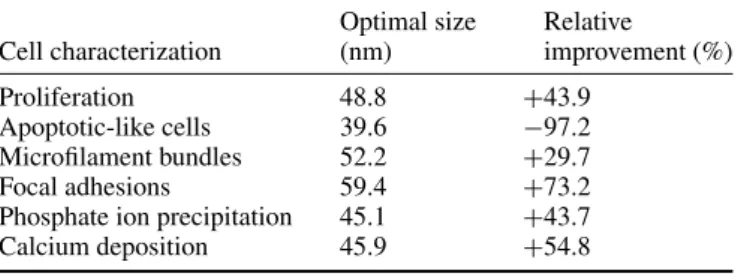
The cell growth was closely associated with the surface topology. The number of MG63 cells initially increased when the diameter of the nanodots increased. The cell number reached a maximum at a nanodot diameter of approximately 50 nm but dropped dramatically for the 100 and 200 nm nanodot arrays. The cell number reached a maximum of +143.9% at a dot diameter of 48.79 nm (figure4(A), table1). A significant decrease in cell number was observed for the cells grown on the 200 nm nanodots (65% cell number).
A decreased cell number was found with MG63 cells seeded on larger nanodots. The decrease in cell number is very likely due to programmed cell death. Cells that underwent apoptosis exhibited an abnormal morphology that was identified in the SEM images. The percentages of apoptotic-like cells versus dot diameter were plotted for the MG63 cells. Minimal apoptotic-like cells occurred when the dot diameter approached 50 nm (figure4(B)). The cells started to show thickening and mounting when the dot size was larger
Table 1. Summary of the optimal size of nanodots and relative improvements derived from the in vitro survey of nanotopography. (Note: ‘+’ indicates the amount of enhancement relative to cells grown on a flat surface and ‘−’ indicates the amount of reduction relative to cells grown on a flat surface.)
Cell characterization Optimal size (nm) Relative improvement (%) Proliferation 48.8 +43.9 Apoptotic-like cells 39.6 −97.2 Microfilament bundles 52.2 +29.7 Focal adhesions 59.4 +73.2 Phosphate ion precipitation 45.1 +43.7 Calcium deposition 45.9 +54.8
than 100 nm; considerable thickening and mounting were observed when the dot size was 200 nm. On the contrary, cells grown on a flat surface and on 10 nm and 50 nm nanodot arrays were flat and extended. Cells grown on 50 nm nanodots exhibited the most extended morphology.
The abnormality of apoptotic-like events was observed in the apoptotic-like cell morphology of SEM images. Nanotopography-induced apoptosis shares some common features with anoikis, the apoptosis induced by the loss of cell adhesion. Both events were initiated at the bio-nano interface. The loss of focal adhesions and lamellipodial collapse were key features of both phenomena. However, anoikis is triggered by forcing epithelial cells to grow in suspension, and signaling is detectable in minutes to hours. Nanotopography-induced apoptotic-like events became evident only after days of incubation.
The organization of the cytoskeleton is an important index for cell growth. Although there is no quantitative measurement for cytoskeletal organization, the number of cytoskeletal fibers is a well-recognized estimation. Cells
Figure 2. Modulation for the growth of and the formation of focal adhesions by MG63 cells by nanodot arrays. On the left are SEM images of cells seeded on the nanodot arrays for 3 days. Immunostaining against vinculin is performed to evaluate the formation of focal adhesions. Actin filament staining is performed to visualize the organization of the cytoskeleton by phalloidin. The fluorescence images are taken with a confocal microscope.
Figure 3. Vinculin (green), actin filament (red), and cell nucleus (blue) high magnification fluorescence image of MG63 cells after 3 days of culture on a 50 nm nanodot array. Cells exhibited well-defined actin filaments and focal adhesion with vinculin in the cytoplasm.
grown on a flat surface and on 10, 50, and 100 nm nanodots exhibited well-defined microfilament bundles in the cytoplasm. However, there was a visible loss of microfilament bundles in cells grown on the 200 nm nanodots (figures2, 4(C)).
The formation of focal adhesions is a hallmark for the proper attachment of cells and can be estimated by the degree of vinculin staining. The formation of focal adhesions versus the dot diameter exhibited a trend that was similar to that for the cell number versus the dot diameter. There was an initial increase in focal adhesion formation that gradually decreased when the nanodot diameter exceeded 50 nm (figure 4(D)). The maximum number of focal adhesions occurred with a dot diameter of 59.4 nm; at this diameter, there was a 73.2% increase in the number of focal adhesions compared to those formed by cells cultured on a flat surface (table1).
3.3. The mineralization of MG63 cells was associated with the nanotopology
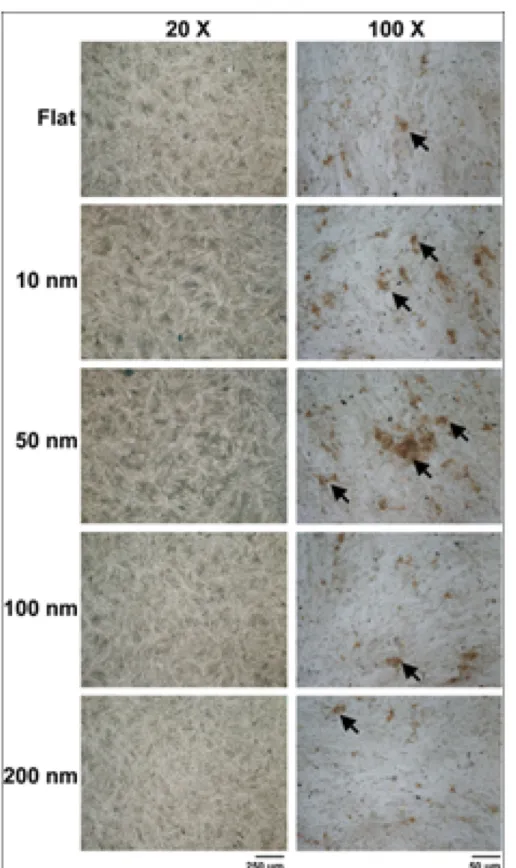
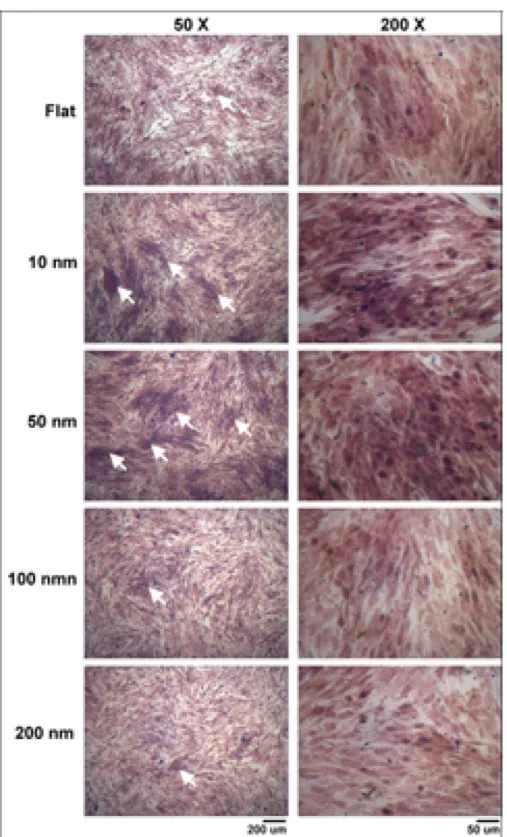
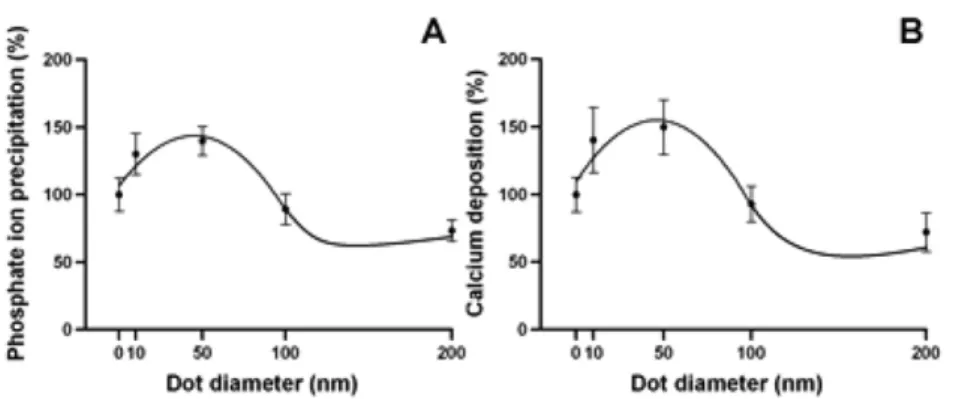
The mineralization process is a hallmark for the function of osteoblasts. To investigate the modulation of the mineralization process, MG63 cells were cultured on the integrated nanodot array device for 7 days. Mineralization in cell culture monolayers was determined using quantitative methods with von Kossa and Alizarin Red S staining. The phosphate ion precipitation was visualized as dark crystals following von Kossa staining (figure5). The calcium deposition was stained bright red following Alizarin Red S staining (figure 6). By von Kossa staining, a high density of nodular phosphate ion precipitation was identified in cells grown on the 50 nm nanodots (figure 7). A 43.7% increase
Figure 4. The cell characteristics versus dot diameters for cells cultured on nanodot arrays. Cells were cultured on the nanodot arrays for 3 days. The percentage values relative to the cells that were cultured on a flat surface (0 nm) were calculated and plotted against the nanodot diameter. (A) The percentage proliferation versus the dot diameter. (B) The percentage of apoptotic-like cells versus the dot diameter. (C) The percentage of microfilament bundles versus the dot diameter. (D) The percentage of focal adhesions versus the dot diameter.
Figure 5. Phosphate ion precipitation to detect the mineralization of cultured MG63 cells using von Kossa staining. MG63 cells were seeded onto nanodots and grown for 7 days. Phosphate ion precipitation of the cultured monolayer was observed following the nodules of dark brown crystals. Black arrows indicate mineralized nodules.
in phosphate ion precipitation occurred in cells cultured on 45.1 nm nanodots compared to cells grown on a flat surface (table 1). By Alizarin Red S staining, a high density of nodular calcium deposition was identified in cells grown on 10 and 50 nm nanodots (figure 7). The quantification of
mineralization by Alizarin Red S staining indicated a 54.8% increase in mineral content in cells cultured on 45.9 nm nanodots (table 1). The nanotopography should provide biomimetic surfaces that support mineral formation and guide bone mineralization [37].
Figure 6. The mineral calcium deposition of cultured MG63 cells visualized with Alizarin Red S staining. MG63 cells were seeded onto nanodots and grown for 7 days. The calcium deposition was demonstrated following purple red colored nodular staining confirming the formation of minerals in the osteoblast cultures. White arrows indicate mineralized nodules.
4. Discussion
Nanotopography affects cell growth and function; however, the control of cell growth or function is still not well defined. The topology of titanium oxide nanopores affects human mesenchymal stem cell (hMSC) adhesion and differentiation.
Larger nanopores (70–100 nm in diameter) induce elongation and differentiation into osteoblast-like cells [50]. The analysis of hMSC culture on nano-patterned polystyrene and polydimethylsiloxane [51] indicated that the nanotopography may modulate cell behavior by altering the expression profiles of integrins and the assembly of focal adhesions, which
Figure 7. The correlation between the mineralization and the size of the nanodot arrays. (A) The percentage phosphate ion precipitation is correlated with systemic nanodots by von Kossa staining. The optimal size was obtained at 45.1 nm with a maximal calcium deposition of 43.7%. (B) The calcium deposition is correlated with systemic nanodots by Alizarin Red S staining. The optimal size was obtained at 45.9 nm, and the maximal degree of calcium deposition is 54.8%.
can lead to changes in the cytoskeletal organization and the mechanical properties of the cell. However, nanostructures do not always promote cell growth and function. In our previous studies, we have shown the differential growth of NIH-3T3 cells on nanodot arrays with dot diameters ranging from 10 to 200 nm [52]. Cells grew normally on the 10 nm arrays and on flat surfaces. However, the 100 and 200 nm nanodot arrays induced apoptotic-like events. The occurrence of apoptosis is due to the loss of focal adhesions. The nanotopographic surface, similar to other substrates including polystyrene and silicon, enhances focal adhesion formation, proliferation and the spreading of various adherent cell types [53, 54]. In vitroevidence indicates that the topological design may have additional benefits in addition to the conventional implant design [44,55].
It should be noted that the description of the three-dimensional topology is complicated. Our system used the dot diameter as a variable owing to the monotonous variation and the homogeneity of the structure and thus should be treated as a simplified version of topology. When plotting the cell number versus the dot diameter, maximal growth is identified with nanodots having a diameter of approximately 50 nm and decayed for diameters larger than 100 nm. It has been proved that the distance between the microfilaments adhering to focal adhesions is approximately 50–70nm [56, 57]. The 50 nm dot-to-dot distance may have provided anchoring points that were the most suitable for the assembly of focal adhesions in migrating cells [58]. Consequently, 100 and 200 nm nanodots, which have dot-to-dot distances that are much longer than 50 nm, do not support the formation of properly spaced focal adhesions. A flat surface and a 10 nm nanodot surface should provide anchoring points for osteoblasts. Our results showed a minor increase in growth and function for 10 nm nanodots compared to a flat surface. The enhancement was maximized for a 50 nm dot surface. Apparently, topological effects other than anchoring distance, such as physical stress caused by different topologies, might play a role in the current study. This finding suggests that carefully designed nanostructures should provide a better environment for cell growth.
Our structure is one of the rare topographies that promotes growth and induces cell death within the same
structure by varying the dimensions. This method will assist the design and fabrication of nanostructures on artificial implants that may perform contrasting functions on different surfaces. The molecular mechanism that underlies the optimal dot size that stimulates maximum growth and mineralization for osteoblasts is not clear. The range between 50 and 80 nm is a universal length scale for integrin clustering and activation in cell adhesion [59]. The 50 nm dot surfaces coincidently provide a biocompatible environment for the formation of focal adhesion and the subsequent intracellular organization of the microfilaments. The results indicate that nanotopography may direct cell behavior via pathways not completely overlapped with surface coating. The hydroxyapatite or β-tricalcium phosphate coating with a 50 nm nanodot structure may further improve the surface biocompatibility and promote cell maturation for dental implants.
5. Conclusion
In this study, we evaluated the topological effects on the growth and function of osteoblastic cell line MG63. MG63 cells were grown on nanodot arrays ranging in diameter from 10 to 200 nm. The cell number, morphology, adhesion, cytoskeleton, and mineralization were evaluated. Nanodot diameters ranging from 46 to 60 nm provided the optimized condition for the cell number, cell adhesion, and mineralization of MG63 cells. Nanodots larger than 100 nm retarded the growth and suppressed the functional expression of the cells. Here, we propose a strategy for the topological design of dental implants based on an in vitro survey of optimized nanodot structures. The nanostructure is capable of modulating the in vitro growth and function of osteoblasts and is optimal with a nanodot size of approximately 50 nm in diameter. These results will contribute to designing functional surfaces that control cell behavior and promote cell maturation for dental implants.
The heights and distance between two dots were used to define topology in the current study. However, height is an important parameter that needs to be considered for topology, because the surface tension applied on the cells is
normally based on how the surfaces elongate the cells by two adhesion sites. Due to the limitation of the current fabrication, additional study is required to explore whether the distance between two dots is more critical than the diameter of the dots (or the heights). However, 50 nm nanodots provided the optimized growth environment for osteoblasts, both in growth and function. Application of this topology in dental implants is expected.
Acknowledgments
This study was supported in parts by the ‘Aim for the Top University Plan’ of the National Chiao Tung University and Ministry of Education, Taiwan, ROC and the National Science Counsel grant 100-2923-B-009-001-MY3. The authors also acknowledge funding support from the Air Force Office of Scientific Research (AFOSR, FA2386-11-1-4094).
References
[1] Price R L, Ellison K, Haberstroh K M and Webster T J 2004 J. Biomed. Mater. Res.A70 129–38
[2] Wall I, Donos N, Carlqvist K, Jones F and Brett P 2009 Bone
45 17–26
[3] Borsari V, Giavaresi G, Fini M, Torricelli P, Salito A, Chiesa R, Chiusoli L, Volpert A, Rimondini L and Giardino R 2005 J. Biomed. Mater. Res. B Appl. Biomater.
75 359–68
[4] Borsari V, Giavaresi G, Fini M, Torricelli P, Tschon M, Chiesa R, Chiusoli L, Salito A, Volpert A and Giardino R 2005 Biomaterials26 4948–55
[5] Le Guehennec L, Lopez-Heredia M A, Enkel B, Weiss P, Amouriq Y and Layrolle P 2008 Acta Biomater.4 535–43
[6] Schwartz Z, Olivares-Navarrete R, Wieland M,
Cochran D L and Boyan B D 2009 Biomaterials30 3390–6
[7] Jager M, Zilkens C, Zanger K and Krauspe R 2007 J. Biomed. Biotechnol.2007 69036
[8] Stevens M M and George J H 2005 Science310 1135–8
[9] Francois P, Vaudaux P, Taborelli M, Tonetti M, Lew D P and Descouts P 1997 Clin. Oral Implants Res.8 217–25
[10] Taborelli M, Jobin M, Francois P, Vaudaux P, Tonetti M, Szmukler-Moncler S, Simpson J P and Descouts P 1997 Clin. Oral Implants Res.8 208–16
[11] Khang D, Lu J, Yao C, Haberstroh K M and Webster T J 2008 Biomaterials29 970–83
[12] Silva T S, Machado D C, Viezzer C, Silva A N and Oliveira M G 2009 Acta Cir. Bras.24 200–5
[13] Webster T J, Siegel R W and Bizios R 2000 Scr. Mater.
44 1639–42
[14] Mu˜noz-Casado M J, Romance A I and
Garcia-Recuero J I 2009 Neurocirugia20 255–61
[15] Toljanic J A, Baer R A, Ekstrand K and Thor A 2009 Int. J. Oral Maxillofac. Implants24 518–26
[16] Choi C H, Hagvall S H, Wu B M, Dunn J C, Beygui R E and Kim C J 2007 Biomaterials28 1672–9
[17] Dalby M J, McCloy D, Robertson M, Wilkinson C D W and Oreffo R O C 2006 Biomaterials27 1306–15
[18] Wan Y, Wang Y, Liu Z, Qu X, Han B, Bei J and Wang S 2005 Biomaterials26 4453–9
[19] Dalby M J, Riehle M O, Sutherland D S, Agheli H and Curtis A S G 2004 Biomaterials25 5415–22
[20] Peng L, Eltgroth M L, LaTempa T J, Grimes C A and Desai T A 2009 Biomaterials30 1268–72
[21] Rebollar E, Frischauf I, Olbrich M, Peterbauer T, Hering S, Preiner J, Hinterdorfer P, Romanin C and Heitz J 2008 Biomaterials29 1796–806
[22] Dolatshahi-Pirouz A, Pennisi C P, Skeldal S, Foss M, Chevallier J, Zachar V, Andreasen P, Yoshida K and Besenbacher F 2009 Nanotechnology20 095101
[23] Lovmand J, Justesen J, Foss M, Lauridsen R, Lovmand M, Modin C, Besenbacher F, Pedersen F and Duch M 2009 Biomaterials30 2015–22
[24] Dalby M J, Gadegaard N, Tare R, Andar A, Riehle M O, Herzyk P, Wilkinson C D W and Oreffo R O C 2007 Nature Mater.6 997–1003
[25] Dalby M J, Riehle M O, Johnstone H J H, Affrossman S and Curtis A S G 2002 Tissue Eng.8 1099–108
[26] Patel S, Kurpinski K, Quigley R, Gao H, Hsiao B S, Poo M M and Li S 2007 Nano Lett.7 2122–8
[27] Park J, Bauer S, von der Mark K and Schmuki P 2007 Nano Lett.7 1686–91
[28] Flemming R G, Murphy C J, Abrams G A, Goodman S L and Nealey P F 1999 Biomaterials20 573–88
[29] Kriparamanan R, Aswath P, Zhou A, Tang L and Nguyen K T 2006 J. Nanosci. Nanotechnol.6 1905–19
[30] Boyan B D, Sylvia V L, Liu Y, Sagun R, Cochran D L, Lohmann C H, Dean D D and Schwartz Z 1999 Biomaterials20 2305–10
[31] Lohmann C H, Sagun R Jr, Sylvia V L, Cochran D L, Dean D D, Boyan B D and Schwartz Z 1999 J. Biomed. Mater. Res.47 139–51
[32] Chehroudi B, McDonnell D and Brunette D M 1997 J. Biomed. Mater. Res.A34 279–90
[33] Matsuo M, Nakamura T, Kishi Y and Takahashi K 1999 J. Periodontol.70 1330–8
[34] Ong J L, Carnes D L, Cardenas H L and Cavin R 1997 Implant Dent.6 19–24
[35] Ward B C and Webster T J 2006 Biomaterials27 3064–74
[36] Zhu B, Lu Q, Yin J, Hu J and Wang Z 2005 Tissue Eng.
11 825–34
[37] Mendonca G, Mendonca D B, Aragao F J and Cooper L F 2008 Biomaterials29 3822–35
[38] Cooper L F, Masuda T, Whitson S W, Yliheikkil¨a P and Felton D A 1999 Int. J. Oral Maxillofac. Implants14 37–47
[39] Mustafa K, Wroblewski J, Hultenby K, Lopez B S and Arvidson K 2000 Clin. Oral Implants Res. 11 116–28 [40] Webster T J, Schadler L S, Siegel R W and Bizios R 2001
Tissue Eng.7 291–301
[41] McManus A J, Doremus R H, Siegel R W and Bizios R 2005 J. Biomed. Mater. Res.A72 98–106
[42] Price R L, Gutwein L G, Kaledin L, Tepper F and Webster T J 2003 J. Biomed. Mater. Res. A67 1284–93
[43] Lim J Y, Hansen J C, Siedlecki C A, Runt J and Donahue H J 2005 J. R. Soc. Interface2 97–108
[44] Hung Y C, Pan H A, Tai S M and Huang G S 2010 Lab Chip
10 1189–98
[45] Wu C T, Ko F H and Hwang H Y 2006 Microelectron. Eng.
83 1567–70
[46] Jager M, Feser T, Denck H and Krauspe R 2005 Ann. Biomed. Eng.33 1319–32
[47] Wolf N S, Penn P E, Rao D and McKee M D 2003 Exp. Cell Res.290 346–57
[48] Koch T G, Heerkens T, Thomsen P D and Betts D H 2007 BMC Biotechnol.7 26
[49] Venugopal J, Low S, Choon A, Kumar A and
Ramakrishna S 2008 J. Biomed. Mater. Res. A 85 408–17 [50] Oh S, Brammer K S, Li Y S, Teng D, Engler A J, Chien S and
Jin S 2009 Proc. Natl Acad. Sci. USA106 2130–5
[51] Yim E K, Darling E M, Kulangara K, Guilak F and Leong K W 2010 Biomaterials31 1299–306
[52] Pan H A, Hung Y C, Su C W, Tai S M, Chen C H, Ko F H and Huang G S 2009 Nanoscale Res. Lett.4 903–12
[53] Bajaj P, Akin D, Gupta A, Sherman D, Shi B, Auciello O and Bashir R 2007 Biomed. Microdevices9 787–94
[54] Turner N, Armitage M, Butler R and Ireland G 2004 Cell biol. Int.28 541–7
[55] Pan H A, Hung Y C, Sui Y P and Huang G S 2012 Biomaterials33 20–8
[56] Arnold M, Cavalcanti-Adam E A, Glass R, Blummel J, Eck W, Kantlehner M, Kessler H and Spatz J P 2004 Chem. Phys. Chem.5 383–8
[57] Cavalcanti-Adam E A, Volberg T, Micoulet A, Kessler H, Geiger B and Spatz J P 2007 Biophys. J.92 2964–74
[58] Arnold M et al 2008 Nano Lett.8 2063–9
[59] Geiger B, Spatz J P and Bershadsky A D 2009 Nature Rev. Mol. Cell Biol.10 21–33
