Optical filter requirements in an EML-based
single-sideband PAM4 intensity-modulation
and direct-detection transmission system
H
SING-Y
UC
HEN,
1,2,*N
ORIAKIK
ANEDA,
1J
EFFREYL
EE,
1J
YEHONGC
HEN,
2AND
Y
OUNG-K
AIC
HEN11Nokia Bell Laboratories, 600-700 Mountain Avenue, Murray Hill, 07901, New Jersey, USA 2Department of Photonics, National Chiao-Tung University, Hsinchu 300, Taiwan
Abstract: The feasibility of a single sideband (SSB) PAM4 intensity-modulation and
direct-detection (IM/DD) transmission based on a CMOS ADC and DAC is experimentally demonstrated in this work. To cost effectively build a >50 Gb/s system as well as to extend the transmission distance, a low cost EML and a passive optical filter are utilized to generate the SSB signal. However, the EML-induced chirp and dispersion-induced power fading limit the requirements of the SSB filter. To separate the effect of signal-signal beating interference, filters with different roll-off factors are employed to demonstrate the performance tolerance at different transmission distance. Moreover, a high resolution spectrum analysis is proposed to depict the system limitation. Experimental results show that a minimum roll-off factor of 7 dB/10GHz is required to achieve a 51.84Gb/s 40-km transmission with only linear feed-forward equalization.
©2017 Optical Society of America
OCIS codes: (060.2330) Fiber optics communications; (060.0060) Fiber optics and optical communications.
References and links
1. A. Dochhan, H. Griesser, M. Eiselt, and J. P. Elbers, “Solutions for 80 km DWDM systems,” in Proceedings of Optical Fiber Communication Conference (2015), paper Th3A.1.
2. L. Zhang, E. Zhou, and Q. Zhang, x. xu, G. N. Liu, and T. ZUO, “C-band Single Wavelength 100-Gb/s IM-DD Transmission over 80-km SMF without CD compensation using SSB-DMT,” in Proceedings of Optical Fiber Communication Conference (2015), paper Th4A.2.
3. H.-Y. Chen, C.-C. Wei, I.-C. Lu, Y.-C. Chen, H.-H. Chu, and J. Chen, “EAM-based high-speed 100-km OFDM transmission featuring tolerant modulator operation enabled using SSII cancellation,” Opt. Express 22(12), 14637–14645 (2014).
4. C.-C. Wei, H.-Y. Chen, H.-H. Chu, Y.-C. Chen, C.-Y. Song, I.-C. Lu, and J. Chen, “32-dB loss budget high-capacity OFDM long-reach PON over 60-km transmission without optical amplifier,” in Proceedings of Optical Fiber Communication Conference (2014), paper Th3G.1.
5. N. Kikuchi, R. Hirai, and T. Fukui, “Practical implementation of 100-Gbit/s/lambda optical short-reach transceiver with Nyquist PAM4 signaling using electroabsorptive modulated laser (EML),” in Proceedings of Optical Fiber Communication Conference (2015), paper Th3A.2.
6. T. Chan and W. Way, “112 Gb/s PAM4 Transmission Over 40km SSMF Using 1.3 µm Gain-Clamped Semiconductor Optical Amplifier,” in Proceedings of Optical Fiber Communication Conference (2015), paper Th3A.4.
7. Z. Xu, M. O’Sullivan, and R. Hui, “Spectral-efficient OOFDM system using compatible SSB modulation with a simple dual-electrode MZM,” in Proceedings of Optical Fiber Communication Conference, (2010), OMR2. 8. M. Sieben, J. Conradi, and D. E. Dodds, “Optical single sideband transmission at 10 Gb/s using only electrical
dispersion compensation,” J. Lightwave Technol. 17(10), 1742–1749 (1999).
9. J. Lee, N. Kaneda, and Y. K. Chen, “112-Gbit/s Intensity-Modulated Direct-Detect Vestigial-Sideband PAM4 Transmission over an 80-km SSMF Link,” in Proceedings of European Conference on Optical Communication, (2016), paper M.2.D.3.
10. S. X. Chew, X. Yi, S. Song, L. Li, P. Bian, L. Nguyen, and R. Minasian, “Silicon-on-insulator dual-ring notch filter for optical sideband suppression and spectral characterization,” J. Lightwave Technol. 34(20), 4705–4714 (2016).
11. D.-Z. Hsu, C.-C. Wei, H.-Y. Chen, W.-Y. Li, and J. Chen, “Cost-effective 33-Gbps intensity modulation direct detection multi-band OFDM LR-PON system employing a 10-GHz-based transceiver,” Opt. Express 19(18), 17546–17556 (2011).
#284891 https://doi.org/10.1364/OE.25.005852
12. A. Villafranca, J. Lasobras, and I. Garces, “Precise characterization of the frequency chirp in directly modulated DFB lasers,” in Proceedings of Spanish Conference on Electron Devices (2007), pp. 173–176.
13. C. Heras, J. Subías, J. Pelayo, and F. Villuendas, “High resolution light intensity spectrum analyzer (LISA) based on Brillouin optical filter,” Opt. Express 15(7), 3708–3714 (2007).
14. N. Yulianto, B. Widiyatmoko, and P. S. Priambodo, “Temperature Effect towards DFB Laser Wavelength on Microwave Generation Based on Two Optical Wave Mixing,” Int. J. Optoelectron. Eng. 5(2), 21–27 (2015). 15. W. R. Peng, I. Morita, and H. Tanaka, “Enabling high capacity direct-detection optical OFDM transmissions
using beat interference cancellation receiver,” in Proceedings of European Conference on Optical Communication (2010), pp. 1–3.
16. S. Randel, D. Pilori, S. Chandrasekhar, G. Raybon, and P. Winzer, “100-Gb/s discrete-multitone transmission over 80-km SSMF using single-sideband modulation with novel interference-cancellation scheme,” in Proceedings of European Conference and Exhibition on Optical Communication (2015), paper Mo.4.5.2. 17. Z. Li, M. S. Erkilinc, R. Maher, L. Galdino, K. Shi, B. C. Thomsen, P. Bayvel, and R. I. Killey, “Two-stage
linearization filter for direct-detection subcarrier modulation,” IEEE Photonics Technol. Lett. 28(24), 2838–2841 (2016).
18. L. Zhang, T. Zuo, Y. Mao, Q. Zhang, E. Zhou, G. N. Liu, and X. Xu, “Beyond 100-Gb/s transmission over 80-km SMF using direct-detection SSB-DMT at C-band,” J. Lightwave Technol. 34(2), 723–729 (2016). 19. N. Kaneda, J. Lee, and Y.-K. Chen, “Nonlinear Equalizer for 112-Gb/s SSB-PAM4 in 80-km Dispersion
Uncompensated,” in Proceedings of Optical Fiber Communication Conference (2017), paper Tu2D.5. 20. O/E Land Inc, “25G/50G/100G/200G DWDM Division Multiplexer”,
http://www.o-eland.com/FiberGratingProducts/FiberGrating_wdm_multiplexer.htm.
21. Finisar Co, “40 channels 100G DWDM MUX/DEMUX Module”, https://www.finisar.com/roadms-wavelength-management/fwsf-d-40-md-r-lc.
22. Flyin Optronics Co, 80ch 50G Athermal AWG, http://www.flyinoptronics.com/80ch-50g-athermal-awg.html.
1. Introduction
Recently, a significant amount of research has been dedicated to investigate optical interconnect solutions to achieve ≥50-Gbps data rate as well as ≥20-km distance [1–4] in order to support rapid increases in networking traffic. To cost effectively reach a data rate ≥50 Gbps and a transmission distance ≥20 km, the intensity-modulated and direct-detection (IM/DD) scheme is still preferred [2–4]. Four-level pulse amplitude modulation (PAM4) is a promising modulation format to achieve better spectrum efficiency than on-off keying (OOK) without increasing the complexity of the transceiver [5,6]. Even though a PAM4 signal needs only half the optical bandwidth to send the same bit rate as an OOK signal, its transmission distance is still limited by dispersion-induced power fading. To compensate for power fading without using dispersion compensating fiber (DCF), the single sideband (SSB) technique is proposed [7–9]. Generally, two main methods, complex modulation with a Hilbert transform and intensity modulation with a vestigial-sideband (VSB) filter, can generate a SSB signal. To generate a SSB signal with a Hilbert transform, a typical approach is to use a Mach-Zehnder modulator (MZM) based optical IQ modulator and high resolution Digital to analog converters (DACs) to modulate the complex signal on optical carrier. Both IQ modulator and the high resolution DACs can increase the complexity and cost of the transmitter [7,8]. On the other hand, an intensity modulated SSB signal can be generated by a low cost electro-absorption modulated laser (EML) in conjunction with a passive optical filter, where the EML and optical filter can be integrated into a single device [9,10]. Nevertheless, a high roll-off factor of the optical filter is required to achieve a high sideband suppress ratio (SSR).
In this study, we systematically investigate the relationship between EML-induced chirp, dispersion-induced power fading and the requirements of the SSB filter. To practically discuss the feasibility of an EML-based SSB PAM4 IM/DD transmission system, we use a CMOS-based digital to analog convertor (DAC) and analog to digital convertor (ADC) in place of an instrument-based arbitrary waveform generator (AWG) and high speed real-time scope. To further discuss the required SSR and roll-off factor of the SSB filter at different transmission distance, a high resolution spectrum analyzer is utilized to measure the shape and distributions of sideband power of the SSB signal. Moreover, to show the tolerance of SSR at different transmission distance without being affected by the variation of carrier to signal power ratio (CSPR), SSB filters with different roll-off factors are employed. This study realizes 51.84-Gb/s 40-km standard single mode fiber (SSMF) transmission under the FEC
limit (BER = 3.8x10⁻³) with only a LMS-based linear equalizer as well as a minimum filter roll-off of 7 dB/10GHz.
2. Experimental setup
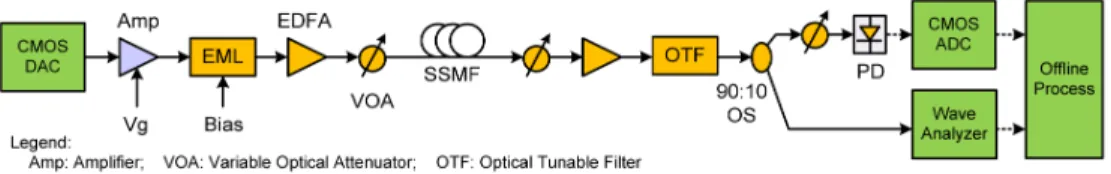
The experimental setup used in this study is shown in Fig. 1. A 51.84-Gb/s (25.92-GBaud/s) baseband electrical PAM4 signal was generated by a CMOS-based DAC, featuring a 51.84-GSa/s sampling rate and 8-bit resolution. A gain-adjustable electrical amplifier was inserted to adjust the driving power of an EML at the wavelength of 1540 nm. The EML is biased at a voltage of −1.9 V with an output power of 0.6 dBm. Then, the PAM4 signal was intensity modulated by the EML, followed by an Erbium-doped fiber amplifier (EDFA) and a variable optical attenuator (VOA) to enable the fiber launch power of 7.5 dBm. After SSMF transmission, the OSNR is controlled by a second EDFA and VOA on the receiver side. An optical wave shaper (Finisar, WaveShaper 4000S) is employed as a SSB filter as well as an amplified spontaneous emission (ASE) noise filter. Then, the signal was direct-detected by a 28-GHz PIN-TIA receiver and captured by a CMOS-based ADC featuring a sampling rate of 80 GSa/s. A 90:10 optical splitter was inserted after the second EDFA to tap out 10% of the optical power to a spectrum analyzer (Finisar, WaveAnalyzer) to monitor the optical spectrum. The captured digital signal was demodulated using an offline DSP program and a least mean squares (LMS) based linear feed-forward equalization (FFE) filter with 20-taps is used for equalization. Finally, the errors were determined to calculate the bit error rate (BER).
Fig. 1. Experimental setup of an EAM-based SSB PAM4 IMDD transmission.
3. Chirp effect in the SSB system
Unlike an MZM, the EML-based intensity modulation induces additional phase modulation because of the bias-dependent chirp [3]. The chirp not only causes an unsymmetrical optical spectrum but also worsens power fading, thereby affecting the requirements of the SSB filter. Firstly, considering the chirp induced phase modulation, the normalized power of a double sideband signal (DSB) after fiber transmission and direct detection can be represented [11] as follow: 2 (1 ) cos t n Pr α 2 π β2 Lf2 a −1α 2 ≅ + ⋅ (2 − ) (1)
where α is the chirp factor, and L , β2 and f are the fiber length, dispersion parameter and
frequency of the signal, respectively [11]. The cosine term in the Eq. (1) determines the periodic fading in signal power over frequency. The main signal lobe bandwidth will become narrower when the transmission distance L increases or the positive chirp factor increases.
Figures 2(a) and 2(b) show the received electrical spectrum of a DSB PAM4 signal at 40 km and 80 km, respectively. According to Eq. (1), a chirp factor of ~0.76 at the EML’s bias of
−1.9V can be calculated by using either the first dip frequency of the spectrum at 40 km or 80 km. Figure 2 also shows the corresponding simulated frequency responses with and without chirp. To compensate the power fading, a SSB filter should achieve a certain SSR at the faded frequencies. However, the positive chirp worsens the power fading, thus increasing the roll-off requirement of the SSB filter. In Fig. 2, the frequencies of the first dips with chirp are 2.3 GHz and 1.6 GHz smaller than those without chirp at 40 km and 80 km, respectively.
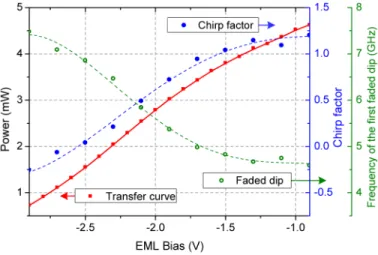
Figure 3 shows the transfer curve of the EML and the corresponding first faded dips’ frequency at 80 km as well as the calculated chirp factors. Similar to a typical EML, a negative chirp can be obtained by lowering bias voltage at the price of nonlinear distortion. Note that the transfer curve as well as the relationship between the chirp factor and the bias voltage varies among different models. For example, a negative chirp can be obtained by adjusting the bias voltage to less than −0.55 V in [3] while less than −2.5 V bias voltage is used in this work. Since we use linear equalizer only in this work, −1.9 V bias voltage is the optimized condition under the tradeoff between dispersion and nonlinear distortion.
Fig. 2. The received signal spectrum and the simulated responses with chirp factors of 0.76 and 0 at (a) 40 km and (b) 80 km.
Fig. 3. Transfer curve of the EML and the corresponding first faded dips’ frequency at 80 km as well as the calculated chirp factors as 80 km.
Secondly, the chirp induces an asymmetric optical spectrum [12,13]. The optical spectrum measured by the spectrum analyzer with a RBW of 150 MHz as shown in Fig. 4(a). In Fig. 4(a), the frequency of the optical carrier is fixed at 194.868 THz, and the filter center is set to 194.845, 194.875 and 194.895 THz to generate lower sideband (LSB), DSB and upper sideband (USB) signal, respectively. Because of the chirp, the optical power close to the carrier has ~5dB difference between LSB and USB of the DSB signal. Moreover, after employing the SSB filter, the USB signal suffers from severe power loss at the frequency close to the carrier, thus inducing severe distortion after direct detection. Figure 4(b) shows the received spectrums of LSB and USB signal at 80 km, respectively. The USB signal obviously suffers from more distortion than LSB signal. Thus, the LSB signal is chosen in the following discussions.
Fig. 4. (a) the optical spectrum of signal with DSB, LSB and USB filter, and (b) the corresponding received spectrum at 80 km.
4. OSNR, CSPR and SSR in the SSB system
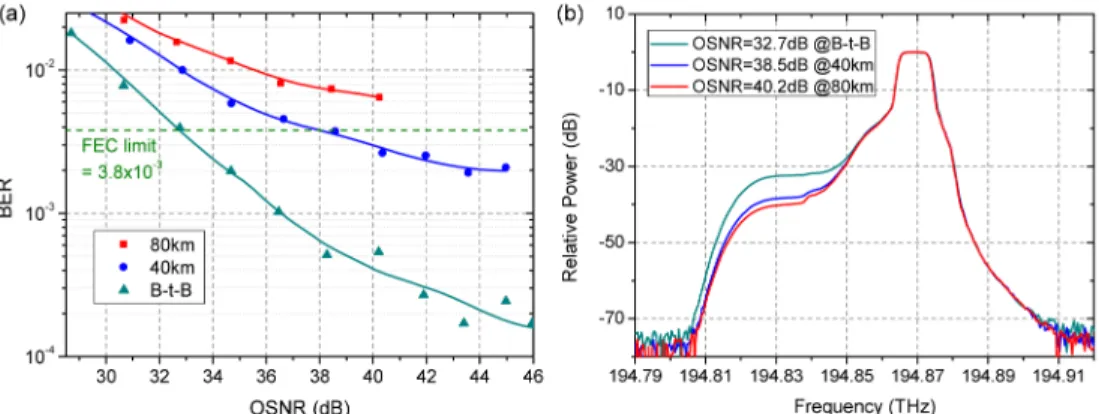
Since the SSB signal sacrifices half of the side band power to compensate the power fading, optical amplifiers are most likely required to increase the transmission distance to 80 km and beyond and to support wavelength-division multiplexing (WDM) transport systems. Thus, the OSNR becomes an important parameter in the SSB system. Figure 5(a) shows the BER of LSB signal as a function of OSNR at back-to-back (B-t-B), 40 km and 80 km, respectively. The OSNR is measured by an optical spectrum analyzer with resolution bandwidth (RBW) of 0.1 nm, and the OSNR can be controlled by adjusting the input power of the second EDFA as shown in Fig. 1. Three of the corresponding normalized optical spectrum at the BER of about 3.8x10⁻³ are shown in Fig. 5(b) as references. According to the BER results at 40 km, transmission induced nonlinear distortion limits the BER when the OSNR is over 42 dB. Moreover, the fiber launch power of 7.5 dBm is determined by the tradeoff between the linear ASE-noise of EDFA and fiber nonlinearity, so the highest launch power of the second EDFA is of 9.2 dBm at 80 km, namely the highest OSNR of 40.2 dB. To compare the performance under different settings among different transmission distance, the launch power of the second EDFA is fixed to 9.2 dBm in the following discussion.
Fig. 5. (a) the BER of LSB under different OSNR at B-t-B, 40 km and 80km, and (b) the corresponding normalized optical spectrum at the BER of about 3.8x10⁻³.
In a SSB system, in addition to the OSNR, two main parameters, sideband suppression ratio (SSR) and carrier to signal power ratio (CSPR), affect the performance. A spectrum analyzer is utilized to measure optical spectrum with RBW of 150 MHz, and the RBW can be rescaled by the convolution of the measured spectrum with a rectangular pulse. Relative to the frequency of the optical carrier, the LSB power and USB power are measured at 12.5 GHz
with a rescaled RBW of 21 GHz, and the SSR is defined as the power ratio between LSB and USB. Since the LSB is the selected sideband, the CSPR is defined as the power ratio between optical carrier and LSB. To select the LSB signal, the center frequency of the 40-GHz optical filter is fixed at 194.845 THz, and the optical signal is operated at the frequency around 194.875 THz. The relative frequency between the optical carrier and the filter is optimized by adjusting the temperature of laser. Similar to the characteristic of a typical DFB laser [14], the wavelength variation of the EML used in this work is about 1 GHz/0.1°C.
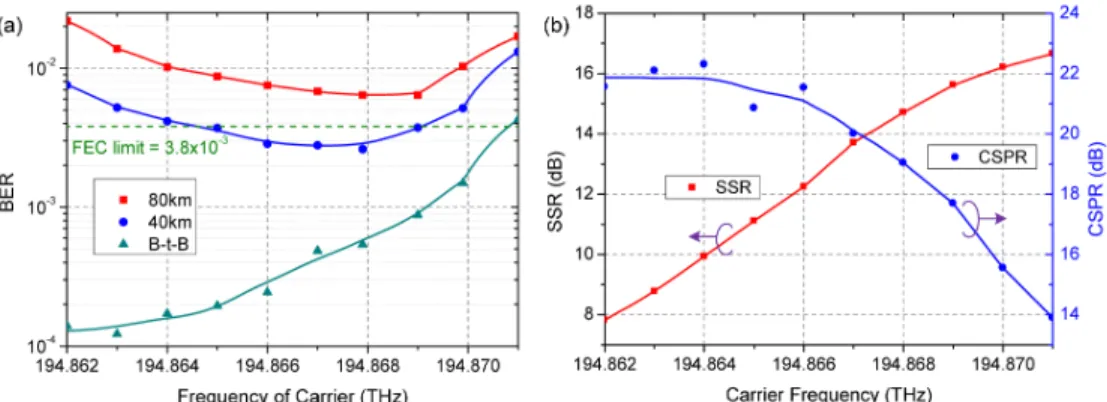
Figure 6(a) shows the BER results as a function of carrier frequency at the received power of 0 dBm and Fig. 6(b) shows the corresponding SSR and CSPR. The high CSPR can be observed in Fig. 4(a), and the optimized CSPR is mainly limited by the nonlinearity of EML as well as the signal-signal beating interference (SSBI) induced by the SSB signal. Since there are no dispersion and power fading at B-t-B, both LSB and USB contribute power after direct detection. Thus, adjusting the carrier to lower frequency to increase signal power of the USB improves the performance as shown in Fig. 6(a). After fiber transmission, severe power fading limits the signal bandwidth as shown in Fig. 2, so increasing SSR can compensate the power fading and improve the BER. As shown in Fig. 6(a), the BER continuously reduces as the SSR increases to 14.7 dB and 15.6 dB at 40 km and 80 km, respectively. However, since the spectrum response of the filter does not have an ideal square edge, adjusting carrier frequency to higher frequency does not only increase SSR but also reduce CSPR as shown in Fig. 6(b). Low CSPR induced SSBI dominates the performance after compensating the power fading [15], so the BER increases quickly as the CSPR decreases. There exists a system performance tradeoff between SSR and CSPR. Note that there are several SSBI cancellation as well as nonlinear distortion compensation techniques that have been proposed [9,15–19] and it is evident that such techniques can improve some of the results presented here. Nevertheless, the primary purpose of this work is to contribute to the basic understanding of the requirements and limitations of a VSB filter approach without resorting to often impractical nonlinear compensation schemes.
Fig. 6. (a) the BER results under different carrier position at B-t-B, 40 km and 80 km, respectively, and (b) the corresponding SSR and CSPR.
5. Filter roll-off requirement analysis
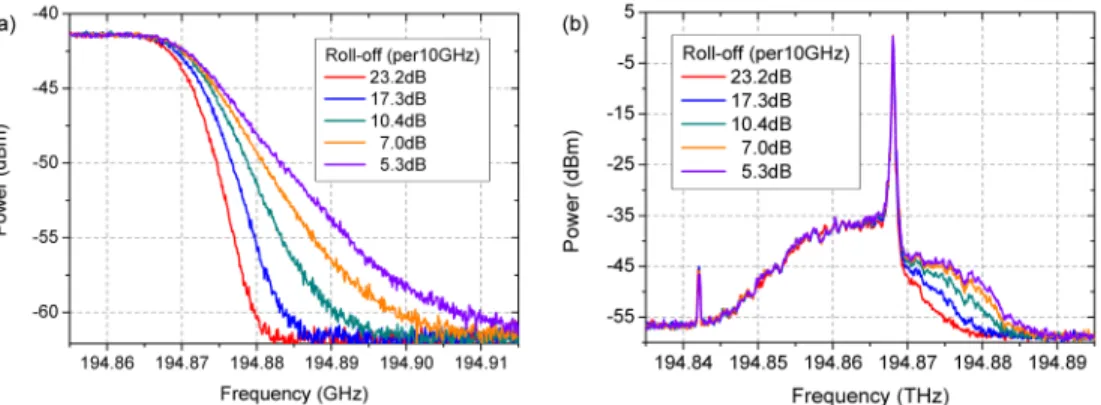
To further discuss the required SSR of the filter at different transmission distances, the carrier frequency is fixed at 194.868 THz and then five different filter roll-off factors of 23.2, 17.3, 10.4, 7.0 and 5.3 dB/10GHz, as shown in Fig. 7(a), are applied to achieve different SSR as shown in Fig. 7(b). Thus, the carrier power as well as the CSPR can be maintained within a small range. The optical spectrums in Fig. 7(a) and 7(b) are measured by the spectrum analyzer with a RBW of 150 MHz. As discussed in Fig. 2, the locations of the faded dips depend on the transmission distance as well as the amount of chirp, and the SSR is relatively important at these frequencies. Figure 8(a) shows the SSR as a function of the relative
frequency and roll-off factor, where the SSR is measured by the high resolution spectrum analyzer. Figures 8(b) and 8(c) show the corresponding power loss of the received electrical signal at 40 km and 80 km, respectively. Due to the high resolution of the optical spectrum, the relationship between filter roll-off, SSR and compensated ratio at each faded frequency can be clearly observed. Cross comparing the SSR in Fig. 8(a) and the power loss in Figs. 8(b) and 8(c), at least 9-dB SSR is required to achieve a power loss less than 3 dB, that is to say, the minimum roll-off of 16 and 19 dB/10GHz are required at 40 and 80 km, respectively. Although there are several faded dips within the signal bandwidth, the first faded dip is the most critical and requires the highest roll-off factor of filter to compensate it. Note that we used the wave shaper to generate the VSB filter without adding phase response. So, if a filter edge correlated with phase change, the relationship between SSR and transmitted loss as shown in Figs. 8(a) and 8(c) would be different due to the additional phase rotation. Moreover, as references to commercialized filters such as WDM multiplexer (MUX) / demultiplexer (DeMUX) / arrayed waveguide grating (AWG), the roll-off factors of these products can be roughly estimated from their specification. For example, a commercialized ITU 100-GHz grid WDM MUX/DEMUX/AWG typically features a 3-dB bandwidth of ~0.3 nm and an adjacent channel isolation of > 25dB [20–22]. Therefore, the roll-off factor can be estimated as >3.7 dB/10GHz. Likewise, the roll-off factors of 50-GHz (3-dB bandwidth of ~0.3nm) and 25-GHz (3-dB bandwidth of ~0.2nm) grid WDM MUX/DEMUX/AWG can be estimated as >8 dB/10GHz and >19 dB/10GHz.
Fig. 7. (a) the optical spectrum of filters with different roll-off, and, and (b) the corresponding optical spectrum of the optical signal after applying the filters.
Fig. 8. (a) the SSR as a function of filter’s roll-off and relative frequency of carrier, and the corresponding transmitted loss of the received signal at (b) 40 km and (c) 80 km.
Figure 9(a) shows BER results at the received power of 0 dBm under different filter roll-off factors at B-t-B, 40 km and 80 km, respectively. Figure 9(b) shows the corresponding aggregate SSR and CSPR. Similar to the results in Fig. 6, the BER at B-t-B continuously worsens as the filter roll-off increases, while the BERs for 40 km and 80 km results continuously improvement until the power fading is fully compensated. However, contrary to the results in Fig. 6, we do not have trade-off between SSR and CSPR such that CSPR stays
almost the same at about 20 dB while SSR increases. Therefore the change in BER is mostly from the change in SSR. It is important to note that SSR should be measured with proper integral bandwidth. The aggregate SSR should include the frequency band affected by the first faded dip, to properly account for the penalty caused by power fading. For example, if the integral bandwidth is reduced from 21 GHz to 3 GHz while the center frequency remains at 12.5 GHz from the carrier, SSR can be saturated as shown in the dotted line in Fig. 9(b), before the lowest BER at 80 km is reached.
Fig. 9. (a) the BER results under different roll-off of filter at B-t-B, 40 km and 80 km, respectively, and (b) the corresponding SSR and CSPR.
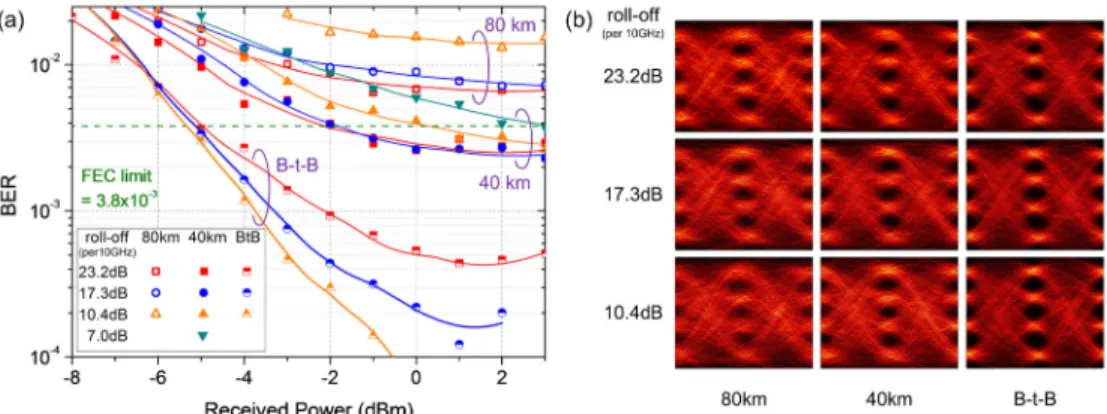
Finally, BER curves as a function of received power under different roll-off factors and transmission distances are shown in Fig. 10(a). The corresponding eye diagrams at the received power of 0 dBm are shown in Fig. 10(b) as a reference. Decreasing the SSR improves the performance at B-t-B. Since the CMOS ADC used in this work does not contain an embedded automatically gain controlled amplifier, we adjust the gain of TIA to fit the ADC’s input range. However, the TIA gain is not sufficient for the received power less than
−4dBm, such that the receiver sensitivity is limited at about −5 dBm under the FEC limit (BER = 3.8x10⁻³) at B-t-B. At 40 km, the sensitivity with roll-off factors of 23.2, 17.3, 10.4 and 7.0 dB/10GHz are −2.1, −2.0, 0.2 and 1.0 dBm, respectively. Namely, a 40-km transmission can be achieved with the minimum roll-off factor of 7 dB/10GHz, and the best sensitivity with 3-dB improvement can be achieved with the minimum roll-off factor of 17.3 dB/10GHz. The interference at 80-km is severe, causing the BER to not be able to reach the FEC limit with only linear equalization, even if the power fading is fully compensated by a filter with 23.2 dB/10GHz roll-off.
Fig. 10. (a) The BER curves under different filter roll-off at B-t-B, 40 km and 80 km, respectively, and (b) the corresponding eye diagrams at the received power of 0 dBm.
6. Conclusion
In this work, we systematically investigate the feasibility of an EML-based SSB PAM4 IM/DD transmission system based on CMOS ADC and DAC. The EML-induced chirp not only worsens the dispersion-induced power fading but also breaks the symmetry of the optical spectrum. These issues limit the freedom of sideband choice as well as increase the SSB filter requirements. Moreover, the system exhibits a tradeoff between SSR and CSPR while optimizing the relative frequency of signal and filter. To separate the effect of SSR and CSPR, we employ filters with different roll-off factors to demonstrate the performance tolerance at different transmission distances. An SSR analysis based on a high resolution spectrum is also proposed to depict SSB system’s fundamental limitation. Experimental results show that at B-t-B both signal power and SNR decrease when the roll-off factor increases. On the contrary, a minimum roll-off factor of 7 dB/10GHz is required to compensate power fading and to achieve a 51.84-Gb/s 40-km transmission with only linear feed-forward equalizer. In our experiment, however, the signal cannot reach 80 km because of the limited OSNR and nonlinear distortion.