Space-Time Correlation for Narrow- and Wideband MIMO
Fading Signals in Macro- and Microcells
Po-Ying Chen and Hsueh-Jyh Li
Graduate Institute of Communication Engineering National Taiwan University
Taipei 106, Taiwan (R.O.C.)
[email protected]; [email protected] Abstract—In this paper, we present the theoretical space-time
correlation (STC) of fading signals in macro- and microcell environments for frequency-flat and -selective channels. To calculate the theoretical STC, it may require high complexity in computation such as double integrals. In this paper we use the geometry of effective scatterers to derive the simplified STC expressions, which can lead to a closed-form expression or need only a single integral. The simplified STC is also used to generate the MIMO fading signals with the vector autoregressive (VAR) method. It is found that the correlations calculated by the simplified expressions can be relatively close to the theoretical values except in the case of narrowband microcell channels. The consistency between the results obtained by the simplified expressions and by the Monte Carlo method verifies the effectiveness of the VAR approach.
Keywords- space-time correlation; MIMO
I. INTRODUCTION
As the number of subscribers in the wireless communications is explosively increasing, various techniques have been proposed to enhance the system capacity with limited power and bandwidth. The most common ones are the use of multi-antennas at the transmitter, such as space-time codes [1], to provide transmit diversity; or the use of beamformer at the receiver to cancel the interfering signals [2]; or at both ends to utilize the multiple-input-multiple-output (MIMO) channels, which has been shown to offer large gains in capacity [3].
In [4], it has been investigated that to what extent the MIMO capacity can reach depends on the spatial correlation between sub-channels. When the user’s mobility is taken into account, the time-varying channel may also degrade performance. As a result, the spatial and temporal correlation characteristics of channels are essential for evaluating the MIMO communication systems. Traditionally, the spatial and the temporal correlations were modeled as separated effects; that is, for generating a sequence of random vectors with specific space and time correlations, the desired channel is acquired by spatial transforming the independent temporally filtered Gaussian random sequences [5]. In fact, it was shown that for the scatterers of ring model, the auto- or cross-correlation of the vector channels should be jointly affected by the spatial and the temporal separation [6]. Abdi and Kaveh [7] generalized this result to MIMO channels with nonisotropic scattering around the mobile station (MS) and derived a closed-form expression of space-time correlation (STC). In [8], the model with scatterers of ring was considered at both the MS and the base station (BS) and the effect of STC on MIMO capacity was also investigated.
The previous works, however, assumed the channel is frequency-flat, i.e. all the multipath signals arrive at the receiver within a time-bin (the inverse of transmission bandwidth). Up to now, the STC for each time-bin signals in frequency-selective fading channels has not been discussed as authors’ knowledge.
In this paper, the scatterers are assumed to be located on the circular ring around the MS for the macrocell environment, which has been used in [9] for deriving the space-time -frequency correlation of fading signals. We further generalize it to the model with scatterers on an elliptical ring enclosing the MS and the BS to stand for microcell environments. These two models can respectively approximate the well-known geometry -based-single-bounce circular model (GBSBCM) and elliptical model (GBSBEM) proposed by Liberti and Rappaport [2]. In both cases, we derive the exact STC for narrowband (NB) and wideband (WB) transmission; and give a simplified expression by introducing the concept of effective scatterers. The derived STC is used to generate the MIMO fading channel with specific geometry by the vector autoregressive (VAR) method [10].
The remainder of the paper is organized as follows. The signal modeling and the STC expressions for NB and WB signals in macro- and microcell environments are presented in section II. We use these results to generate MIMO fading channels in section III. The numerical results are shown in IV followed by the conclusion in section V.
II. SPACE-TIME CORRELATIONS FOR MIMOFADING
SIGNALS
In macrocell environments, where the antenna height at the BS is relatively high, the scatterers are usually assumed to be uniformly distributed inside the circle around the MS; while in microcell environments, the multipath scattering is as likely near the BS as it is near the MS, hence scatterers are assumed to be randomly distributed within an ellipse with the BS and the MS as its foci. This ellipse implicitly indicates the maximum delay spread of all multipath signals. In the following, we assume the scatterers are uniformly distributed inside a circular ring or an elliptical ring for macro- or microcells repectively, as shown in Fig. 1. These two models are reduced to GBSBCM and GBSBEM when the area of the inner circle or the inner ellipse becomes very small.
With the same notations as in [7], the baseband fading signal between the lth antenna element at the MS and the pth antenna element at the BS can be represented as by (1). The line-of-sight (LOS) component is neglected here, though it can be easily generalized.
( )
(
)
(
)
(
)
− + + − ⋅ ⋅ =∑
= − ∞ → γ φ π ξ ξ λπ ϕ ξ ξ U 1 2 U BS cos 2 2 exp 1 lim i D li ip i N i n i i i N lp t f j j j D g N t h . (1) In (1){ }
N i ig =1 are independent positive random variables with
finite variance;
{ }
N i i =1ϕ are independently, identically and uniformly distributed over
[
0,2π]
; n is the path loss exponent;D
f is the maximum Doppler frequency; and the term
(
)
n i i D − ⋅ U BS ξξ accounts for the path loss relative to the distance between the MS and the BS, D. The total power of this link is
denoted as
{ }(
)
∑
= − ∞ → ⋅ = Ω N i n i i i N lp E g D N 1 U BS 2 1 lim ξ ξ .Now we define the normalized space-time cross-correlation coefficient between the two pairs of channels, l to p and m to q, as
( )
{
( ) ( )
}
mq lp mq lp mq lp t h t h E Ω Ω − = τ τ ρ , * . (2)Replacing (1) into (2) and assuming equal power for all radio links, i.e. Ωlp=Ωmq =Ω . Also using the fact of
{ }
g N f( )
s dsE i =
2 , for large N; where f
( )
s is the probabilitydensity function (pdf ) of the area where the scatterers located; we can arrange the normalized STC as in (3) at the bottom of the page.
A. STC for NB Signals in Macrocells
As indicated in Fig. 1(a), the scatterers are uniformly distributed inside the circular ring with radius R1 and R2 respectively. We can reasonably assume D>>R2>>R1>>
{
pq,dlm}
maxδ in macrocells, thus yields the normalized STC by integrating a modified Bessel function represented in (4) where
τ π
τ fD
a =2 , blm =2πdlm λ, cpq=2πδpq λ ; and the 0
th order
modified Bessel function is defined as
(
)
(
2 2)
0 2 cos sin expx z+y zdz= I x +y∫
− π π π .For simplicity, we use “effective” scatterers uniformly distributed around the ring with radius R2 to represent the effect
of many scatterers within the region [2]. Further, the path loss effect is neglected. Then the integral in eq. (4) can be removed and lead to the compact, closed-form shown in (5), which is the same as the equation (12) derived in [7] with Klp=Kmq=0 and
0 =
κ . ∆ is the angular spread at the BS defined as ∆=R2 D. B. STC for NB Signals in Microcells
In microcells, we assume the scatterers are distributed within the elliptical ring as shown in Fig. 1(b). The half lengths of the major axes of the inner and outer ellipses are a1 and a2, which
are related to the minimum and maximum delay time among all multipaths as a1=
(
D+c⋅τmin)
2 and a2=(
D+c⋅τmax)
2respectively. The corresponding minor axis half lengths are 4 2 2 D a bi = i − , i=1, 2.
( )
(
D)
j(
ip iq li mi)
j fD(
i)
f( )
s ds n i i mq lp − − + − + − ⋅ ⋅ Ω =∫
− ξ ξ ξ ξ π τ φ γ λπ ξ ξ τ ρ UScatterersArea with The U BS , 2 cos 2 exp 1 (3)
( )
{
}
( )
[
]
U 2 1 2 2 U 0 2 1 2 2 1 U , 2 1 cos cos sin sin sin 2 cos exp ξ β γ α ξ β γ ξ α τ ρ R R I aτ b D c aτ b d jc R R lm lm pq pq lm lm n pq pq mq lp∫
+ − + + − ⋅ − Ω ≈ + − (4)( )
{
}
{
[
]
[
]
}
+ − ∆ + + − ⋅ Ω ≈ 2 1 2 2 0, sin sin sin cos cos
cos exp lm lm pq pq lm lm pq pq mq lp I a b c a b jc β γ α β γ α τ ρ τ τ (5)
( )
[
(
(
)
)
]
( ) ( )[
(
)
]
(
)
[
]
[
(
)
]
θ θ β β θ γ γ θ θ α θ α π θ τ ρ τ π π θ θ dRd D DR R D R jb D R ja D DR R D R jc b a b a R D D R R D lm lm lm pq pq pq r r n n mq lp + − − − + − − + + + + − ⋅ − − + Ω ≈∫ ∫
− − 4 cos cos 2 cos cos 2 cos 4 cos cos 2 cos exp cos 4 2 2 2 2 1 1 2 2 2 2 2 2 2 2 2 , 2 1 (6)( )
[
(
)
]
[
(
)
]
[
(
)
]
θ θ γ γ θ β β θ θ α θ α τ ρ π τ π d z z z ja z jb z z z jcpq pq pq lm lm lm mq lp + − − − + − − + + + + − Ω ≈∫
− 2 2 , cos 2 1 cos cos cos cos cos 2 1 cos cos exp 1 (7)Express some arguments by R and θ as indicated in the figure, and use (3) with some arrangement, the normalized STC can be obtained by (6) at the bottom of the previous page. In (6), the upper and lower limits of the inner integral are defined as
( )
θ θ θ 2 2 2 2 sin cos i i i i i a b b a r + = , i=1, 2.To reduce the complexity of calculating the double integrals, similar to the case in macrocells, we assume the effective scatterers are on the outer ellipse and make the path loss exponent n equal to 0. Then the STC can be simplified by only calculating a single integral with (7) where
ab a b D z 2 sin cos2 2 2 2 θ+ θ = . BS O OU p BS q BS BS i ξ ip ξ iq ξ BS i φ U i φ γ pq α lm β i S li ξ mi ξ ξiU v D 1 R R2 pq δ lm d l U m U (a) BS O OU p BS q BS BS i ξ ip ξ iq ξ BS i φ U i φ γ pq α lm β i S li ξ mi ξ ξiU v D pq δ lm d O R θ m U l U (b)
Figure 1. (a) The circular ring model for the macrocell environment and (b) the elliptical ring model for the microcell environment.
Microcells
Environments Effective scatterers EnvironmentsMacrocells
BS MS1 MS2
τ
Delay Profile from MS1 Delay Profile from MS2
Microcells
Environments Effective scatterers EnvironmentsMacrocells
BS MS1 MS2
τ
Delay Profile from MS1 Delay Profile from MS2
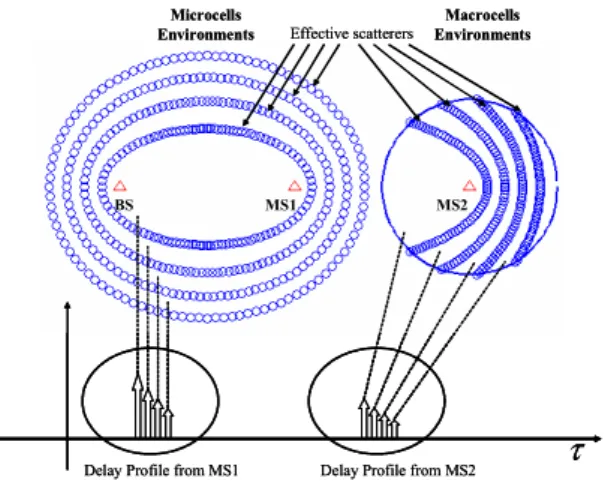
Figure 2. The relation between delay profiles and the wideband transmission for GBSBEM, GBSBCM; and the illustration of their corresponding effective scatterers.
C. STC for WB Signals in Microcells
In the wideband transmission, the multipath signals may arrive at the receiver in different time-bins. When the GBSBEM is applied to the microcells, the scatterers that contribute to different time-bin signals can be located in different sub-regions, as illustrated by in the left part of Fig. 2, where the effective scatterers that contribute to each time-bin signal are also plotted. We define a0=D 2+δ and 4 2 2 0 0 a D b = − , where δ is a small positive value, to make the elliptical ring model approximate the GBSBEM. Then the scatterers that contribute to the ith time-bin signal are enclosed by the two successive
ellipses with major and minor axis half length, a , i−1 b and i−1 a , i i b , respectively, where
(
)
4 2 2 2 D a b c i D a i i i − = ∆ ⋅ ⋅ + = τ ; (8)for i=1 …,2, ,L. L is the number of time-bin signals. Here we define ∆ as the reciprocal of the signal bandwidth, B. To τ
acquire the space-time correlation function of the ith time bins,
we can calculate the integrals in (6) by replacing a2=ai, i b b2= , a1=ai−1, b1=bi−1 or in (7) with a= , ai b= . bi i a U O BS O i θ i b i θ 0 R BS O i φ D 1 − i a i a U O BS O i θ i b i θ 0 R BS O i φ D 1 − i a
Figure 3. The intersection of the circle in GBSBCM and an elliptical ring corresponding to a certain delay time-bin.
D. STC for WB Signals in Macrocells
For wideband transmission in GBSBCM, the scatterers that contribute to the ith time-bin signal are inside the intersection
area of the ring with radius R0 around the MS and the two
successive ellipses with major and minor axes half length, a , i−1 1
−
i
b and a , i b , respectively; where i a and i b are defined by i
(8). This is illustrated in the right part of Fig. 2 and the shadow region of Fig. 3..
To calculate the space-time correlation of the ith time-bin
signal, we directly use (6) and (7) with some modifications. The outer integral of (6) will not be integrated over
[
−π,π]
here, but over[
−θi,θi]
. As illustrated in Fig. 3, θi can be calculatedby the following equations
(
)(
)
(
)
(
)
(
i i)
i i i i i i i i i i i i R D R R b a D b R a b a b a D b D b φ φ θ φ cos 2 sin tan 2 4 4 cos 0 0 1 0 2 2 2 2 0 2 2 2 2 2 2 4 2 1 + = − − − − − − = − −Similar to the previous cases, when effective scatterers are assumed to be on the boundary of each sub-region as shown in
Fig. 2, the STC can be approximated by substituting a, b with i
a , b and i π with θi in eq. (7).
III. GENERATION OF MIMO FADING SIGNALS
Since the cross correlation is jointly determined by the space and the time separation, the previous approach which linearly transforms the uncorrelated random sequences cannot be used here. To generate the spatially and temporally correlated random variates, we use the vector autoregressive (VAR) method [10]. Consider the frequency-selective MIMO fading channel; let the Nr×Nt channel matrix corresponding to the l
th
time-bin signal at time t be
( )
t,l[
h1( )
t,l h2( )
t,l hNt( )
t,l]
H = , where( )
[
( )
( )
( )
]
T i N i i i t,l = h1, t,l h2, t,l h r, t,l h is thechannel vector corresponding to the ith transmitting antenna. To
generate the time-varying correlated MIMO channel, we define the 1NtNr× vector as
[ ]
(
(
)
)
[
(
)
(
)
]
T s T N s T s l nT l nT l nT vec n H , h1 , h t , x = = ,and construct the correlation matrix by the derived STC for each pair of radio links. Then the VAR parameter matrices are solved by the multi-channel Yule-Walker equations for each time-bin l.
IV. NUMERICAL RESULTS
In this section, we first compare the theoretical space-time correlation with the correlation coefficients calculated by simulated fading signals which are generated by the geometry- and the VAR-based method. For the geometry-based channel simulator, the geometry is indicated in Fig. 1 with
{ } { } { }
p,q = ml, = 2,1 ; and the parameters in macrocells and microcells are set in Table I. Besides the user-input parameters defined in the table, we let the antennas at the BS lie along thex-axis, then the angle between the BS array and the line
connecting the BS and the MS is αpq =π−∠X. Further, we assume the MS is always moving along the MS array broadside direction, that is, γ =βlm+π 2. The center frequency is set as 2 GHz, and the path loss exponent is 2. In the geometry-based method, we distribute 1000 scatterers every 10000π m2
approximately for both macro- and microcells. The cross-correlation of h1,1
( )
t and h2,2( )
t are plotted in Fig. 4 (a)and (b) for the NB signals in macro- and microcells. In (c), and (d), the results are calculated from the 2nd time-bin signals for
WB transmission in micro- and macrocells, respectively. The results are averaged over 50 independent experiments. In the VAR-based method, the space-time correlations are plotted by single experiment with autoregressive order p=40 and data length 100000.
The comparison between the exact and simplified STCs for different time-bin signals for WB transmission in micro- and macrocells are indicated in Fig. 5(a) and (b) where only the real part of the STCs are plotted. From Fig. 4 and 5, we can conclude that the simplified representation can be close to the exact one except for the NB signal and the 1st time-bin of WB signal in
microcells. In most cases, such as frequency-flat fading signals in macrocells and most time-bin signals in frequency-selective channels, the effective scatterers are representative of the averaged scattering environment; and the STC can be predicted by the simplified expression derived in the previous sections.
V. CONCLUSION
We have derived the exact space-time cross-correlation function of MIMO fading signals for general channel environments including frequency-flat and -selective fading in the GBSBCM and the GBSBEM. The effective scatterers are applied in all models to ease the computation. It has been verified by simulations that, except for the NB transmission in microcells, the simplified STC expressions can closely match the exact values. The theoretical STC can be used to generate random variates by means of VAR method, and further for evaluating the performance of the MIMO communication systems.
TABLE I. THE PARAMETERS FOR MIMOFADING SIGNALS.
Macrocells Microcells
N: Data length of generated fading signal 1000
Nt: Number of Tx (MS) antenna elements 2
Nr: Number of Rx (BS) antenna elements 2
dt: Element spacing of Tx array λ/2
dr: Element spacing of Rx array λ/2
X: Initial location of the MS (m) 300+1000j 100+400j
v: Velocity of the MS (km/hr) 60
βlm: The angle between the MS array
inline and the line connecting the BS and the MS
π/4 π/8
fs: Sampling frequency (Hz) 1666.67
τmax: Maximum delay spread in microcells 1 µs
B: Transmission bandwidth (Hz) 5 MHz
REFERENCES
[1] S. Alamouti, “A simple transmit diversity technique for wireless communications,” IEEE J. Sel. Areas Commun., vol. 16, pp. 1451-1458, Oct. 1998.
[2] J. C. Liberti and T. S. Rappaport, Smart Antennas for Wireless
Communications: IS-95 and Third Generation CDMA Applications, New
Jersey: Prentice Hall, 1999.
[3] G. J. Foschini and M. J. Gans, “On limits of wireless communications in a fading environment when using multiple antennas,” Wireless Pers.
Commun., vol. 6, pp. 311-335, 1998.
[4] D. Shiu, G. J. Foschini, M. J. Gans, and J. M. Kahn, “Fading correlation and its effect on the capacity of multielement antenna systems,” IEEE
Trans. Commun., vol. 48, pp. 502-513, Mar. 2000.
[5] A. Stéphenne and B. Champagne, “Effective multi-path vector channel simulator for antenna array systems,” IEEE Trans. Veh. Technol., vol. 49, pp. 2370-2381, Nov. 2000.
[6] T. A. Chen, M. P. Fitz, W. Y. Kuo, M. D. Zoltowski, and J. G. Grimm, “A space-time model for frequency nonselective Rayleigh fading channels with applications to space-time modems,” IEEE J. Sel. Areas
[7] A. Abdi and M. Kaveh, “A space-time correlation model for multielement antenna systems in mobile fading channels,” IEEE J. Sel.
Areas Commun., vol. 20, pp. 550-560, April 2002.
[8] G. J. Byers and F. Takawira, “Spatially and temporally correlated MIMO channels: modeling and capacity analysis,” IEEE Trans. Veh. Technol., vol. 53, pp. 634-643, May 2004.
[9] Z. Latinovic, A. Abdi, and Y Bar-Ness, “A wideband space-time model for MIMO mobile fading channels,” in Proc. IEEE WCNC’03, pp. 338-342, 2003.
[10] K. E. Baddour and N. C. Beaulieu, “Accurate simulation of multiple cross-correlated fading channels,” in Proc. IEEE ICC’02, pp. 267-271, 2002. 0 1 2 3 4 5 6 7 -0.3 -0.2 -0.1 0 0.1 0.2
real part of the cross-correlation function
f Dτ
Theoretical -- Exact Theoretical -- Simplified Simulation -- Geo. Method Simulation -- VAR Method
0 1 2 3 4 5 6 7 -0.3 -0.2 -0.1 0 0.1 0.2 0.3 0.4
imaginary part of the cross-correlation function
f Dτ
Theoretical -- Exact Theoretical -- Simplified Simulation -- Geo. Method Simulation -- VAR Method
(a) 0 1 2 3 4 5 6 7 -0.4 -0.3 -0.2 -0.1 0 0.1 0.2 0.3
real part of the cross-correlation function
f Dτ
Theoretical -- Exact Theoretical -- Simplified Simulation -- Geo. Method Simulation -- VAR Method
0 1 2 3 4 5 6 7
-0.5 0 0.5
imaginary part of the cross-correlation function
f Dτ
Theoretical -- Exact Theoretical -- Simplified Simulation -- Geo. Method Simulation -- VAR Method
(b) 0 1 2 3 4 5 6 7 -0.2 0 0.2 0.4 0.6
real part of the cross-correlation function
f Dτ
Theoretical -- Exact Theoretical -- Simplified Simulation -- Geo. Method Simulation -- VAR Method
0 1 2 3 4 5 6 7 -0.8 -0.6 -0.4 -0.2 0 0.2 0.4 0.6
imaginary part of the cross-correlation function
fDτ
Theoretical -- Exact Theoretical -- Simplified Simulation -- Geo. Method Simulation -- VAR Method
(c) 0 1 2 3 4 5 6 7 -0.4 -0.2 0 0.2 0.4
real part of the cross-correlation function
f Dτ
Theoretical -- Exact Theoretical -- Simplified Simulation -- Geo. Method Simulation -- VAR Method
0 1 2 3 4 5 6 7 -0.4 -0.2 0 0.2 0.4
imaginary part of the cross-correlation function
f Dτ
Theoretical -- Exact Theoretical -- Simplified Simulation -- Geo. Method Simulation -- VAR Method
(d)
Figure 4. The space-time correlations for NB fading signals in (a) macro-, (b) microcells; and for the 2nd time-bin of WB fading signals in (c) micro-, (d)
macrocells.
0 1 2 3 4 5 6 7
-1 0 1
real part of the cross-correlation function
1 st ti m e -b in Exact Simplified 0 1 2 3 4 5 6 7 -0.5 0 0.5 1 2 nd t im e -bi n Exact Simplified 0 1 2 3 4 5 6 7 -0.5 0 0.5 3 r d t im e -bi n Exact Simplified 0 1 2 3 4 5 6 7 -0.5 0 0.5 4 t h t im e -b in Exact Simplified 0 1 2 3 4 5 6 7 -0.5 0 0.5 fDτ 5 t h t im e -b in Exact Simplified (a) 0 1 2 3 4 5 6 7 -1 -0.5 0 0.5 1
real part of the cross-correlation function
1 st ti m e -b in Exact Simplified 0 1 2 3 4 5 6 7 -0.4 -0.2 0 0.2 0.4 2 nd t im e -bi n Exact Simplified 0 1 2 3 4 5 6 7 -0.2 0 0.2 0.4 0.6 f Dτ 3 r d t im e -b in Exact Simplified (b)
Figure 5. The comparison of the theoretical STC (real part) with exact and simplified expression for different time-bins of WB fading signals in (a) microcells and (b) macrocells.