1
Demographic Aspects of Urbanization in the
Lower Yangzi Region of China, c. 1500-1900
Ts’ui-jung Liu*
This article was originally published in Ad van der Woude, Akira Hayami and Jan de Vries (eds.), Urbanization in History: A Process of Dynamic Interactions (Oxford: Clarendon Press, 1990), chapter 19, pp. 328-351. (With Chinese characters added.)
According to Skinner’s definition, the lower Yangzi region was the most urbanized region in China by the end of the nineteenth century.1 In this chapter I attempt to relate the phenomenon of urbanization to demographic characteristics of the region, on the basis of data collected from local gazetteers and genealogies. Since these two sources are completely different I should first point out that at the present stage we can only consider some case-studies which will illustrate the similarities and dissimilarities between rural and urban areas in the lower Yangzi region.
In the first section we shall trace urbanization in the region from the Tang-Song transition (c. 800-1000) to the Ming (1368-1643) and Qing (1644-1911) periods. In the second, we shall study the demographic characteristics of some urban and rural populations obtained from genealogical data. In the third, we shall try to relate the statistical findings relating to demographic characteristics to other factors, such as popular attitudes and institutional arrangements, depending for this on literary sources from the Ming and Qing periods. This will lead us to the conclusion that, in late imperial China, dissimilarities did exist between the urban and the rural populations in the lower Yangzi region.
1. The Phenomenon of Urbanization
Many historians have demonstrated that the prospect and distribution of urban centers in China differed before and after the Tang-Song transition. The lower Yangzi valley during song times stood out as the most economically developed region with the largest concentration of urban centers and this has been studied in some detail by Shiba.2 He has pointed out that southward migration speeded the process of urbanization in the lower Yangzi valley and in the south in general. The percentage of
* Research Fellow, the Institute of Economics, Academia Sinica.
1
G. W. Skinner (ed.), The City in Late Imperial China (Stanford, 1977), 211-229.
2
Y. Shiba, “Urbanization and the Development of Markets in the Lower Yangtze Valley,” in J. Winthrop (ed.), Crisis and Prosperity in Sung China (Tuscon, 1975), 13-48.
2
city dwellers during the twelfth and thirteenth centuries varied from 7 per cent in She 歙county (in modern Anhui) and 13 per cent in Yin 鄞county (in modern Zhejiang) to 38 per cent in Dantu 丹徒county (in modern Jiangsu). Moreover, from the data relating to stations for collecting commercial tax on goods in transit in 1077, he analyzed the distribution and operation of the urban economic hierarchy in regional cities, local cities, and in central and intermediate market towns. In short, the essentially self-sufficient rural economy of the pre-Tang period was transformed and became more specialized, commercialized, and urbanized. This process was called by scholars ‘mediaeval revolution in market structure and urbanization’.3 In this respect the lower Yangzi valley outranked other Chinese regions.
With this historical background in mind, in this section we shall concentrate on the development of urbanization in the lower Yangzi valley during the Ming and Qing periods. In the discussion that follows, I shall rely mainly on studies that are based on material found in the local gazetteers.
First and foremost, during the Ming and Qing periods many large market towns emerged which specialized in the grain trade or in handicraft manufactures. This development was closely related to agricultural production in the region having become more commercialized and to its emergence as the most important area for the production of cotton and silk goods during the period.4 A careful scrutiny of the local gazetteers showed that around the Lake Tai (太湖) and Yangzi delta region there were altogether fifty-two towns which specialized in cotton goods, twenty-five which specialized in silk good, and thirteen which specialized in the grain trade. Of these only one specialized in both grain and cotton goods, whilst there are eighty-eight other towns each of which specialized in one staple only.5 This gives a picture of a highly specialized system and of division of labor in the area, especially in its core region.
We should note, however, that not all these towns maintained their prosperity throughout the Ming-Qing era. Nor did they grow or decline at similar rates. Most of the cotton towns were located around the Yangzi delta, and their growth or decline was much affected by shifts in transport routes. The silk towns tended to be in the Lake Tai area. They gained in importance during the late Ming period, and continued to grow during the Qing era; they even recovered quickly after the interruption caused
3
M. Elvin, The Pattern of the Chinese Past (Stanford, 1973), 164; Skinner, City in Late Imperial China, 23.
4
Liu Ts’ui-jung 劉翠溶, “Ming-Qing shidai nanfang diqu de zhuangye shengchan 明清時代南方地區 的專業生產 (Specialization in Production in South China during the Ming-Qing Periods)”, Ta-lu tsa-chi 大陸雜誌, 56: 3-4 (1978), 1-35; Liu Shih-chi 劉石吉, “Ming-Qing shidai Jiangnan diqu de zhuangye shizhen 明清時代江南地區的專業市鎮 (Specialized Market Towns in the Jiangnan Area during the Ming-Qing periods)” , Shih-huo Monthly 食貨, 8: 6-7 (1978), 274-291, 326-337, 365-380.
5
3
by the Taiping rebellion. Their growth undoubtedly depended on the expansion of the silk trade and in turn helped to accelerate the commercialization of agricultural production in the surrounding rural areas. During the course of their development, the concentration of population and commercial functions of some of these towns even surpassed those of the county or prefectural city. The towns which specialized in the grain trade were mainly located around Suzhou which was the largest city in the lower Yangzi region during the mid-nineteenth century. This situation reflected a shift in agricultural production from the lower Yangzi core area to the middle Yangzi valley during the seventeenth century. Thus the rice area around Lake Tai became deficient in grain and had to rely on shipments from Hubei and Hunan during the early Qing period and thereafter on shipments from Sichuan.6
Some scholars have tried to consider the quantitative aspects of urbanization in addition to changes in the nature of towns, by investigating changes in the total number of towns. For instance, a study of Lake Tai area showed that by the end of the eighteenth century there were altogether thirty-six towns in Wujiang吳江, Tongxiang 桐鄉, Guian歸安, and Wucheng烏程 counties. Only sixteen of then were founded between 1368 and 1795, the others were either direct descendants of towns which already existed at the beginning of the Ming dynasty, or revivals of such towns. Moreover, the increase occurred mainly during the eighteenth century.7 In a more comprehensive study which cover eight prefectures and one sub-prefecture situated in the core area of the lower Yangzi region it was shown that the number of market towns in this area increased consistently throughout the Ming and Qing periods. According to this study the estimated number of market towns at the beginning of the twentieth century was between 1,162 and 1,344. It was estimated that fifty-six of then contained at least 1,000 households, and of these ten contained more than 10,000 households by the end of the eighteenth century. In some counties remarkably high percentages of the population were recorded as urban. For example, in Wujiang county in 1744, the households of the twelve market towns in the county accounted for 35 per cent of all households in the county. In Changshou常熟and Zhaowen昭文 counties together, in 1903 the eighty towns in those counties contained 19.6 per cent of their total population. Basing himself on this evidence, Liu Shih-chi has suggested that both Rozman’s estimate that 7 per cent of the population in Jiangsu province during the nineteenth century was urban and Skinner’s estimate of an urban
6
Liu shih-chi, “Specialized Market Towns”; Chuan Han-sheng 全漢昇, “Qing zhongye Suzhou de miliang maoyi 清中葉蘇州的米糧貿易 (The Grain Trade in Suzhou during the mid-Qing period)”, in Zhongguo jingjishi luncong 中國經濟史論叢 (Studies on Chinese Economic History) (Hong Kong, 1972), 567-582.
7
Shih Chin, “Peasant Economy and Rural Society in the Lake Tai Area, 1368-1840”, Ph.D. dissertation, University of California, Berkeley (1981), 92-93.
4
population in the lower Yangzi region of 7.4 per cent in 1843 and 10.6 per cent in 1893 were too low.8
Since the classification of urban centers by attributed rough population size could raise problems, and the data from local gazetteers could be inconsistent because of their varying quality, it is difficult to arrive at a precise measure of urbanization in pre-census China. Moreover, a recent attempt to estimate the degree of urbanization throughout Chinese history, in which it was suggested that urbanization reached its peak during the twelfth century when 22.4 per cent of the population were supposed to live in towns, and that there was a trough in the nineteenth century when the percentages urban were 6.9 per cent in 1820 and 7.0 per cent in 1893, has been shown not to be plausible, particularly on the basis of historical evidence relating to the lower Yangzi region.9 I shall, therefore, in this chapter abandon attempts to estimate the percentage of urbanization from problematic classifications and population figures.
2. Demographic Characteristics
During the past few years there3 have been some studies in historical demography based on data collected from Chinese genealogies. Although the results are as yet meager, they do provide basic information on which to base a discussion of the demographic characteristics of past Chinese population. This section is based on these case-studies, which have been selected to contain both rural and urban populations in the lower Yangzi region. The findings which relate to marriage, fertility, mortality, and migration are discussed below.
2.1 Marriage
We shall begin with two examples which illustrate differences in marriage behavior between rural and urban families. In Table 1 we see information related to the Yan 嚴 family, residing at Qingqi 青溪, a market town in Tongxiang, Zhejiang, and in Table 2
8
Liu Shih-chi 劉石吉, “Ming-Qing shidai Jiangnan shizhen zhi shuliang fenxi 明清時代江南市鎮之 數量分析 (A Quantitative Analysis of Market Towns in the Jiangnan area during the Ming-Qing periods)”, Ssu-yu-yen 思與言, 16: 2 (1978), 128-149; id., “Some Reflections on Urbanization and the Historical Development of Market Towns in the lower Yangzi Region, ca. 1500-1900”, The American Asian Review, 2: 1 (1984), 1-27.
9
Chao Kang 趙岡 and Chen Chung-yi 陳鍾毅, “Zhongguo lishishang de chengshi renkou 中國歷史 上的城市人口 (Urban Population in Chinese History)”, Shih-huo Monthly, 13: 3-4 (1983), 109-131; Liang Keng-yao 梁庚堯, “Zhongguo lishishang de chengshi renkou duhou 中國歷史上的城市人口讀 後 (Remarks after Reading ‘Urban Population in Chinese History’”, Shih-huo Monthly, 13: 3-4 (1983), 132-137.
5
we see the case of the Zhou 周 lineage, residing in a rural district south of the county town of Wujin 武進, Jiangsu. In both tables the data have been arranged by generation showing numbers of recorded males and in-marrying females classified by their marital status. Some special individual events are given in notes below the tables.
Table 1 Marriages of Yan family: an example of the urban population
Gener- ation Year of Birth known Recorded males Married Engaged Unmarried Total Died before 50th birthday Age at death not known Still alive h 1 ? 1 1 2 1558 1 1 3 1597 3 3 4 1621-1638 6 6 5 1653-1677 6 3 9 6 1673-1713 10 10 7 1701-1746 11 4 15 8 1726-1788 16a 4 20 9 1756-1829 27 1b 3 31 10 1791-1854 39 1c 5e 10 54 11 1815-1881 31 2d 7 5 9 53 12 1842-1892 8 1 20 31 13 1871-1890 0 1 7 8 Total 159 4 13 30 36 242 Gener- ation Year of Birth known
Recorded in-married females First wife Second wife Third wife Fourth wife Concubine Total 1 ? 1 1 2 1558 1 1 2 3 1597 3 3 4 1621-1638 6 6 5 1653-1677 6 2 1 1 10 6 1673-1713 10 4 14 7 1701-1746 11 2 3 16 8 1726-1788 15 6 21 9 1756-1829 27 4 7 38 10 1791-1854 40f 5g 3 5 53 11 1815-1881 31 6 1 1 1 40 12 1842-1892 8 2 10 13 1871-1890 0 0 Total 159 25 5 1 24 214 a
One man was uxorilocally married to a member of the Shen family.
b
Died at age 35.
c
Died at age 23.
d
Aged 13 and 15 respectively in 1892
e
One man who died aged 40 was not married because he was an epileptic.
f
One woman recorded as first wife after a predecessor to whom her husband was engaged died before marrying; another woman was engaged and died before marrying, but was not recorded as first wife.
g
One woman was engaged but died before marrying.
h
Still alive in 1892, when the family genealogy was compiled.
Source: Qingqu Yan shi jiapu 青溪嚴氏家譜 (The genealogy of the Yan family at Qingqi) (1892 edition).
6
Table 2 Marriages of Zhou lineage: an example of rural population
Gener- ation Year of Birth known Recorded males Married Engaged Unmarried Total Died before 50th birthday Age at death not known Still alive b 46 1365a 1 1 47 1399-1401 2 2 48 1422-1428 3 3 49 1488-1452 4 4 50 1466-1476 8 8 51 1496-1523 29 1 30 52 1522-1570 40 4 5 49 53 1542-1620 54 1 9 64 54 1575-1637 74c 8 82 55 1592-1697 80 2 1 14 97 56 1620-1720 78c 1 41 120 57 1644-1760 122c 1 4 14 141 58 1656-1807 143 5 7 28 183d 59 1704-1814 170c 10 4 37 221 60 1729-1845 185c 14 4 36 239 61 1739-1890 138 13 4 41 4 200d 62 1774-1902 88 16 37 8 149 63 1798-1904 46 2 18 29 95 64 1821-1903 13 2 7 29 51 65 1899-1903 8 6 5 5 Total 1,278 70 25 296 75 1,744 Gener- ation Year of Birth known
Recorded in-married females First wife Second wife Third wife Fourth wife Concubine Total 46 1365a 1 1 47 1399-1401 2 2 48 1422-1428 3 3 49 1488-1452 4 4 50 1466-1476 8 8 51 1496-1523 29 29 52 1522-1570 40 2 42 53 1542-1620 54 6 60 54 1575-1637 73 5 78 55 1592-1697 80 8 1 3 92 56 1620-1720 78 6 1 85 57 1644-1760 121 8 1 130 58 1656-1807 143 7 2 152 59 1704-1814 170 16 2 1 1 190 60 1729-1845 185 19 1 205 61 1739-1890 138 10 1 149 62 1774-1902 88 4 92 63 1798-1904 46 5 51 64 1821-1903 13 1 14 65 1899-1903 0 0 Total 1,276 97 8 1 5 1,387 a
This man moved to Shilipai 十里牌 in Wujin county to start this lineage.
b
For those still alive in 1904 when the genealogy was compiled, the birth years for those in Generation 61 were 1882-90, in Generation 62 1882-1902, in Generation 63 1867-1902, and in Generation 64 1887-1903.
c
In these generations, there were cases of uxorilocally married men; Generation 54 and 57 each had one such man but the surname of wife was not recorded; Generations 56, 59, and 60 each also had one such man but the surname of wife was recorded.
7
d
Generation 58 had one man and Generation 61 had two men adopted by other families (Shi, Hun, and Wang) and details of their marriages and deaths were not known.
Source: Biling Shilipai Zhou shi Zongpu 毘陵十里牌周氏宗譜 (The genealogy of the Zhou lineage at Shilipai village in Wujin county).
Comparing these two cases we may note the following points:
1. The percentage of unmarried men aged 50 and older was, in general negligible. In the Yan family there is no record of any man dying unmarried at an age exceeding 50 year; the Zhou lineage there were altogether twenty-five such men in generations 53 to 61 and they amounted to only 1.4 per cent of all recorded males. It would seem that marriage was even more universal in the town than in the countryside. In both examples, there are cases of unmarried men who died ages below 50, or whose age at death was unknown (most of them are only known as having died young). Such men probably died before being able to marry and cannot be regarded as single survivors. In both cases, a fair number of men who were still alive when the genealogies were compiled are listed; they were still young and likely to marry in due course.
2. The remarriage rate of men may be investigated by computing the rate of second and third marriages (calculated as the ratio of second to first wives, and of third to second wives respectively). In the Yan family, taking all generations together, these ratios came to 15.7 per cent and 20 per cent respectively. In the Zhou lineage they were 7.6 and 8.2 percent. The ratios in the Yan family were higher and those of the Zhou lineage lower than the average computed for twenty-three families and lineages in the lower and middle Yangzi regions,10 which came to 11.3 per cent for second and 10.8 per cent for third marriages. When differences between these twenty-three groups are compared, it seems that the rates were lower for lineages in rural areas than for those in towns. Neither the Yan nor the Zhou genealogies record any cases of remarriages of women who had married into the family. It has been found in previous studies that there were more women in the rural areas who remarried after the death of their husband.11
3. Men generally remarried after the death of their wives, but they could also take a concubine or concubines during their wives’ life time. Concubinage was permitted by Chinese law, though the regulations differed in different periods. For instance, Ming law permitted the common people to take concubines only after a man had reached age of 40, provided that he has no son. However, this restriction was
10
Liu Ts’ui-jung 劉翠溶, “Ming-Qing renkou zhi zengzhi yu qienyi 明清人口之增殖與遷移 – 長江 中下游地區族譜資料之分析 (The Growth and Migration of Population during the Ming-Qing Periods – An analysis of genealogical data from the lower and middle Yangzi region)”, in Hsu Cho-yun 許倬雲 et al. (eds.), Papers from the Seminar on Chinese Social and Economic History (Taipei, 1983), 288.
11
8
relaxed by Qing law.12 Rules and instructions adopted by a family or lineage could also influence the marriage behavior of its members. Whether a man could afford to take a concubine also depended on his wealth. These institutional and economic conditions may help to explain the difference found in the rates of concubinage (number of concubines divided by the total number of in-marrying women) in different generations of the same family, or in families of different social and economic groups. For example, in the Yan family, the ration of concubines to wives was 11.2 per cent, whereas in the Zhou lineage it only came to 0.4 per cent. The fact that the Yans were town dwellers, whereas the Zhous had engaged in farming for many generations makes this difference easily comprehensible. Furthermore, among the 24 concubines in the Yan family, only one was taken by a man (born in 1558) during the Ming period.
4. We should also note in passing that uxorilocal marriage was found both in the Yan family and the Zhou lineage. There was only one such Yan marriage in the eighth generation, whilst there were five in the Zhou lineage in generations 54, 56, 57, 59, and 60. Though the reason for these occurrences was not mentioned in the genealogies, the men concerned could all have been very poor.
2.2 Fertility
The fertility of Chinese populations in the past can be reconstructed from the genealogies. Conjugal families can be reconstituted from the vital dates relating to parents and sons (those for daughter were not generally recorded), and these can be used to construct fertility rates. Here we shall study estimates relating to two lineages in the core and one at the periphery of the lower Yangzi region for cohorts of first wives and husbands. The Yan family will also be studied as an urban example. Age-specific fertility rates (ASFRs) and their sums (total fertility of TF) relating to male births to first wives are listed in Table 3 and in Table 4 they are listed for the husband. The following points from these tables may be noted.
1. The estimates of total fertility derived from the weighted average of three lineages showed that in general the fertility of husbands exceeded that of first wives. The unweighted estimated for the Yan family gave the same result. This was obviously due to that fact that a husband’s fertility was affected by remarriage, as the births of all sons born to the first wives, other wives, and concubines were taken into account. The difference between the fertility of the husband and that of the wife was particularly marked in the Yan family, as the remarriage rate in that family had also
12
Chen Guyuan 陳顧遠, Zhongguo hunyinshih 中國婚姻史 (A History of Marriage in China) (Taipei, reprint, 1975), 68-19.
9
been higher.
Table 3 Fertility: male births per first wife
Line- age
Cohorts No. Age-specific fertility rates Total fertility 15-19 20-24 25-29 30-34 35-39 40-44 45-49 Zhou 1698-1747 31 0.045 0.124 0.100 0.087 0.087 0.000 0.000 2.22 1748-1797 91 0.029 0.110 0.111 0.096 0.073 0.028 0.000 2.24 1798-1817 35 0.034 0.091 0.102 0.126 0.056 0.023 0.000 2.16 Weighted average 157 0.033 0.109 0.107 0.101 0.072 0.021 0.000 2.22 Cumulative 0.033 0.142 0.249 0.350 0.422 0.443 0.443 Zhu 1548-1597 30 0.073 0.108 0.119 0.080 0.0072 0.017 0.010 2.40 1598-1647 38 0.042 0.086 0.106 0.098 0.071 0.027 0.007 2.19 1648-1697 62 0.019 0.091 0.113 0.093 0.048 0.027 0.004 1.98 1698-1747 96 0.027 0.121 0.118 0.087 0.069 0.010 0.016 2.29 1748-1797 179 0.028 0.115 0.112 0.096 0.092 0.033 0.005 2.41 1798-1817 84 0.033 0.098 0.082 0.116 0.055 0.032 0.000 2.08 Weighted average 489 0.031 0.108 0.108 0.096 0.077 0.028 0.007 2.28 Cumulative 0.031 0.139 0.247 0.343 0.420 0.448 0.455 Wang 1398-1447 14 0.071 0.086 0.100 0.100 0.043 0.000 0.014 2.07 1448-1497 23 0.026 0.130 0.139 0.061 0.122 0.046 0.010 2.67 1498-1547 48 0.079 0.125 0.072 0.052 0.045 0.023 0.021 2.09 1548-1597 44 0.091 0.068 0.064 0.042 0.048 0.043 0.022 1.89 1598-1647 60 0.057 0.100 0.080 0.069 0.069 0.036 0.022 2.17 1648-1697 153 0.056 0.116 0.110 0.107 0.075 0.046 0.008 2.60 1648-1747 234 0.057 0.117 0.155 0.120 0.097 0.053 0.007 3.03 1748-1797 245 0.050 0.124 0.123 0.127 0.083 0.042 0.004 2.77 1798-1817 62 0.029 0.136 0.110 0.063 0.102 0.023 0.000 2.32 Weighted average 883 0.055 0.117 0.120 0.103 0.082 0.043 0.009 2.65 Cumulative 0.055 0.172 0.292 0.395 0.477 0.520 0.529 2.65 Yan 1597-1842 43 0.047 0.125 0.101 0.072 0.057 0.046 0.000 2.24 Cumulative 0.047 0.172 0.273 0.345 0.402 0.448 0.448
Source: Biling Shilipai Zhou shi zongpu (see Table 2); Weiyang Jiangdu Zhu shi
shixiou zupu 維揚江朱氏十修族譜 (The tenth edition of the genealogy of the Zhu lineage in Jiangdu) (1881 edition); Tongcheng Wang shi zongpu 桐城王氏宗譜 (The genealogy of the Wang lineage in Tongcheng) (1866 edition); Qinqi Yan shi jiapu (The genealogy of the Yan family at Qingqi).
2. When looking at changes over time it would appear that cohort fertility of both husbands and first wives who were born during the eighteenth century tended to be higher than that of others. In the case of Wang 王 lineage in Tongcheng 桐城, Anhui for which data are available for the period 1400 to 1800, it would appear that total fertility also peaked in the cohorts born between 1448 and 1497. In the Zhu 朱 lineage in Jiangdu 江都, Jiangsu, total fertility was also high for those born between 1548 and 1597. Whether these findings have any implications for population growth in China during the sixteenth century remains uncertain. At any rate, the findings that total fertility was higher for cohorts born during the eighteenth century seems at least plausible in the light of our knowledge that the population of China as a whole increased during that century.
10
Table 4 Fertility: male births per husband
Line- age
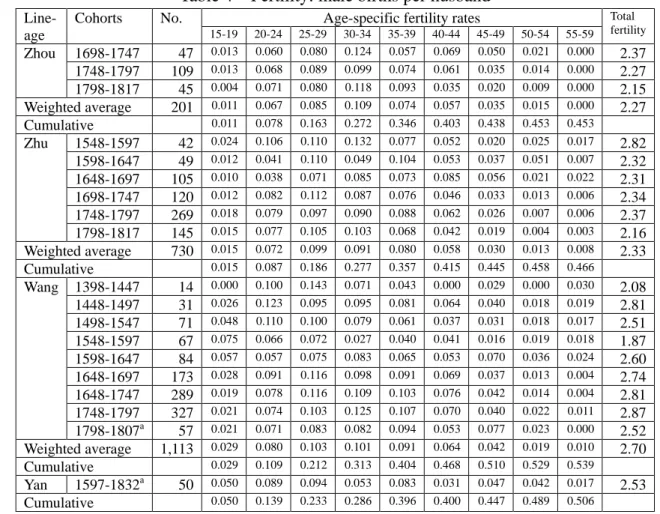
Cohorts No. Age-specific fertility rates Total fertility 15-19 20-24 25-29 30-34 35-39 40-44 45-49 50-54 55-59 Zhou 1698-1747 47 0.013 0.060 0.080 0.124 0.057 0.069 0.050 0.021 0.000 2.37 1748-1797 109 0.013 0.068 0.089 0.099 0.074 0.061 0.035 0.014 0.000 2.27 1798-1817 45 0.004 0.071 0.080 0.118 0.093 0.035 0.020 0.009 0.000 2.15 Weighted average 201 0.011 0.067 0.085 0.109 0.074 0.057 0.035 0.015 0.000 2.27 Cumulative 0.011 0.078 0.163 0.272 0.346 0.403 0.438 0.453 0.453 Zhu 1548-1597 42 0.024 0.106 0.110 0.132 0.077 0.052 0.020 0.025 0.017 2.82 1598-1647 49 0.012 0.041 0.110 0.049 0.104 0.053 0.037 0.051 0.007 2.32 1648-1697 105 0.010 0.038 0.071 0.085 0.073 0.085 0.056 0.021 0.022 2.31 1698-1747 120 0.012 0.082 0.112 0.087 0.076 0.046 0.033 0.013 0.006 2.34 1748-1797 269 0.018 0.079 0.097 0.090 0.088 0.062 0.026 0.007 0.006 2.37 1798-1817 145 0.015 0.077 0.105 0.103 0.068 0.042 0.019 0.004 0.003 2.16 Weighted average 730 0.015 0.072 0.099 0.091 0.080 0.058 0.030 0.013 0.008 2.33 Cumulative 0.015 0.087 0.186 0.277 0.357 0.415 0.445 0.458 0.466 Wang 1398-1447 14 0.000 0.100 0.143 0.071 0.043 0.000 0.029 0.000 0.030 2.08 1448-1497 31 0.026 0.123 0.095 0.095 0.081 0.064 0.040 0.018 0.019 2.81 1498-1547 71 0.048 0.110 0.100 0.079 0.061 0.037 0.031 0.018 0.017 2.51 1548-1597 67 0.075 0.066 0.072 0.027 0.040 0.041 0.016 0.019 0.018 1.87 1598-1647 84 0.057 0.057 0.075 0.083 0.065 0.053 0.070 0.036 0.024 2.60 1648-1697 173 0.028 0.091 0.116 0.098 0.091 0.069 0.037 0.013 0.004 2.74 1648-1747 289 0.019 0.078 0.116 0.109 0.103 0.076 0.042 0.014 0.004 2.81 1748-1797 327 0.021 0.074 0.103 0.125 0.107 0.070 0.040 0.022 0.011 2.87 1798-1807a 57 0.021 0.071 0.083 0.082 0.094 0.053 0.077 0.023 0.000 2.52 Weighted average 1,113 0.029 0.080 0.103 0.101 0.091 0.064 0.042 0.019 0.010 2.70 Cumulative 0.029 0.109 0.212 0.313 0.404 0.468 0.510 0.529 0.539 Yan 1597-1832a 50 0.050 0.089 0.094 0.053 0.083 0.031 0.047 0.042 0.017 2.53 Cumulative 0.050 0.139 0.233 0.286 0.396 0.400 0.447 0.489 0.506 a.
Since the Wang genealogy was compiled in 1866 and the Yan genealogy in 1892, to avoid including those who had not completed their reproductive lives the cohorts were cut off 10 years earlier than those of the first wives.
Source: See Table 3.
3. The difference between the fertility of the urban and rural populations in the past remains a puzzle for the student of Chinese historical demography. The estimates in Tables 3 and 4 indicate that, on average, total fertility for the two lineages in Jiangsu (Zhou and Zhu) was lower ( 2.22 and 2.28 respectively for the fi0rst wife) than that for the one lineage in Anhui (Wang: 2.65 for the first wife). However, the difference between them may reflect that one was resident at the periphery and the other two in the core region, rather than that they were respectively urban and rural. It can be argued that the core of the region must have been more urbanized than the periphery. Total fertility for the Yan first wives (2.24) was similar to that among the Zhou and the Zhu. Since only a very small number of Yan first wives were observed (43 born between 1597 and 1842) it would seem wise at the present stage of the research to treat the representativeness of these figures for the urban population with caution.
4. As regards the ASFRs there are some irregularities caused by small numbers in observation. However, it was clear that the ASFRs for first wives reached a
11
maximum in the age-groups 20-24 and 25-39, and those for husbands in the age groups 25-29 and 30-34.
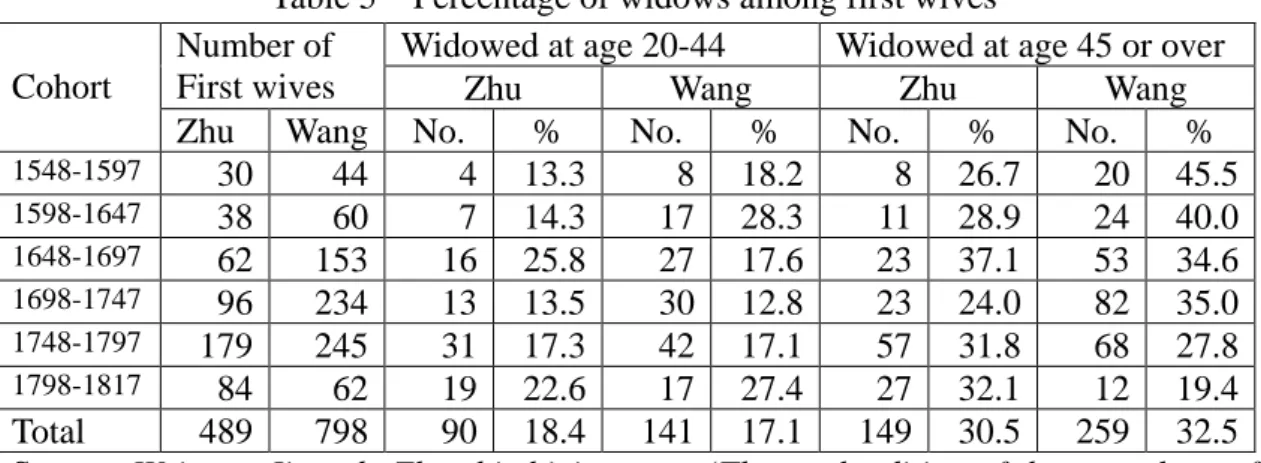
Here it may be appropriate to present some figures relating to widowhood among first wives, which might explain some of the variation in total fertility between the core and the periphery. In Table 5 we see the number of widows as a percentage of first wives among the Zhu (core) and the Wang (periphery). The widows were classified by their birth cohort and age at widowhood into two broad age-groups. When we compare the figures in Table 5 with those in Table 3 it is clear that total fertility in both the Wang and the Zhu lineages was lower in those cohorts in which the proportion of young widows was higher. Changes over time were quite consistent. The fertility rates estimated in Table 3 and 4 were based on data relating to conjugal families in which information about vital dates was complete. Families for which this information was incomplete were excluded from the calculation. To investigate what difference it would make if both types of family were taken into consideration, the data were arranged by number of sons in each family, classified by the father’s cohort, and this is shown in Tables 6 and 7 for the Zhou and Wang lineages respectively. These tables listed families with different numbers of sons (ranging from 0 to 9) according to their father’s birth cohorts and divided them into two groups: those in which the father had died before reaching the age of 50 and those in which he died at age 50 and over.
Table 5 Percentage of widows among first wives Cohort
Number of First wives
Widowed at age 20-44 Widowed at age 45 or over
Zhu Wang Zhu Wang
Zhu Wang No. % No. % No. % No. %
1548-1597 30 44 4 13.3 8 18.2 8 26.7 20 45.5 1598-1647 38 60 7 14.3 17 28.3 11 28.9 24 40.0 1648-1697 62 153 16 25.8 27 17.6 23 37.1 53 34.6 1698-1747 96 234 13 13.5 30 12.8 23 24.0 82 35.0 1748-1797 179 245 31 17.3 42 17.1 57 31.8 68 27.8 1798-1817 84 62 19 22.6 17 27.4 27 32.1 12 19.4 Total 489 798 90 18.4 141 17.1 149 30.5 259 32.5
Source: Weiyang Jiangdu Zhu shi shixiou zupu (The tenth edition of the genealogy of
the Zhu lineage in Jiangdu); Tongcheng Wang shi zongpu (The genealogy of the Wang lineage in Tongcheng).
12
Table 6 Number of sons in families classified by father’s cohort and ages at death: Wujin Zhou lineage
Classification 1400 cohorts b. 1398-1447 1450 cohorts b. 1448-1497 1500 cohorts b.1498-1547 d50+ d -50 All d50+ d -50 All d50+ d -50 All No. of sons 0 0 0 0 1 0 1 4 8 12 1 3 0 3 3 0 3 10 7 17 2 2 0 2 4 0 4 10 4 14 3 2 0 2 7 1 8 4 1 1 2 3 0 3 5 0 0 0 3 0 3 6 1 0 1 7 1 0 1
Total no. of sons 7 0 7 34 4 38 78 18 96
No. who died young 0 0 0 0 0 0 0 2 2
No. of families 5 0 5 13 1 14 37 20 57
No. of remarriages 0 0 0 0 0 0 4 0 4
Ave. no. of sons per family 1.4 0 1.4 2.6 4.0 2.7 2.1 0.9 1.7
% who died yang 0 0 0 0 0 0 0 11.1 2.1
% re-married 0 0 0 0 0 0 10.8 0 7.0
% of families without sons 0 0 0 7.7 0 7.1 10.8 40.0 21.1
Classification 1550 cohorts b. 1548-1597 1600 cohorts b. 1598-1647 1650 cohorts b.1658-1697 d50+ d -50 All d50+ d -50 All d50+ d -50 All No. of sons 0 12 11 23 6 10 16 11 12 23 1 14 10 24 25 11 36 24 32 56 2 20 6 26 17 7 24 24 17 41 3 5 3 8 13 2 15 12 5 17 4 3 3 6 2 1 3 9 3 12 5 2 1 3 1 2 3 6 0 6 6 0 1 1 7 1 0 1
Total no. of sons 91 48 139 118 51 169 174 93 267
No. who died young 2 3 5 14 6 20 15 7 22
No. of families 56 34 90 65 34 99 86 69 155
No. of remarriages 5 1 6 8 2 10 9 4 13
Ave. no. of sons per family 1.6 1.4 1.5 1.8 1.5 1.7 2.0 1.4 1.7 % who died yang 2.2 6.3 3.6 11.9 11.8 11.8 8.6 7.5 8.2
% re-married 8.9 8.9 2.9 12.3 5.9 10.1 10.5 5.8 8.4 % of families without sons 21.4 32.4 32.4 9.2 29.4 16.2 12.8 17.4 14.8
13 Table 6 (continued) Classification 1700 cohorts b. 1698-1747 1750 cohorts b. 1748-1797 1800 cohorts b.1798-18547 d50+ d -50 All d50+ d -50 All d50+ d -50 All No. of sons 0 11 22 33 13 37 50 9 66 75 1 44 39 83 35 56 91 17 54 71 2 40 19 59 37 31 68 17 33 50 3 17 13 30 25 14 39 15 15 30 4 9 4 13 6 4 10 4 5 9 5 1 0 1 1 3 4 3 1 4 6 1 0 1 0 1 1 7
Total no. of sons 216 132 348 219 191 410 127 196 323
No. who died young 14 12 26 14 12 26 21 72 93
No. of families 122 97 219 118 145 363 65 175 240
No. of remarriages 7 2 9 16 10 26 6 16 22
Ave. no. of sons per family 1.8 1.4 1.6 1.9 1.3 1.6 2.0 1.1 1.4 % who died yang 6.5 9.1 7.5 6.4 6.1 6.3 16.5 36.7 28.8 % re-married 5.7 2.1 4.1 13.6 6.9 9.9 9.2 9.1 9.2 % of families without sons 9.0 22.7 15.1 5.9 25.5 19.0 13.9 37.7 31.3
Classification Total d50+ d -50 All No. of sons 0 67 166 233 1 175 209 384 2 171 117 288 3 96 53 149 4 37 21 58 5 17 7 24 6 2 2 2 7 2 0 2
Total no. of sons 1,064 733 1,797
No. who died young 80 114 194 No. of families 567 575 1,142
No. of remarriages 55 35 90 Ave. no. of sons per family 1.9 1.3 1.6 % who died yang 7,5 15.6 10.8 % re-married 9.7 6.1 7.9 % of families without sons 11.8 28.9 20.4
For d50+ read: died on or after 50th birthday; for d-50 read: died before 50th birthday. Those whose age at death was unknown were included in the group dying before their 50th birthday.
14
Table 7 Number of sons in families classified by father’s cohort and ages at death: Tongcheng Wang lineage
Classification 1350 cohorts b. 1348-1397 1400 cohorts b. 1398-1447 1450 cohorts b. 1448-1497 d50+ d -50 All d50+ d -50 All d50+ d -50 All No. of sons 0 0 0 0 0 1 1 0 1 1 1 4 0 4 6 7 13 11 5 16 2 2 0 2 4 2 6 4 6 10 3 0 0 0 5 4 9 6 3 9 4 0 0 0 3 3 6 6 6 12 5 1 0 1 2 1 3 6 0 0 0 7 0 1 1 8 9
Total no. of sons 13 0 13 41 35 76 71 62 133
No. who died young 0 0 0 2 2 4 0 0 0
No. of families 7 0 7 18 17 35 29 23 52
No. of remarriages 0 0 0 0 0 0 4 1 5
Ave. no. of sons per family 1.9 0 1.9 2.3 2.1 2.2 2.5 2.7 2.6
% who died yang 0 0 0 4.9 5.7 5.3 0 0 -
% re-married 0 0 0 0 0 0 13.8 7.4 9.6
% of families without sons 0 0 0 0 5.9 2.9 0 4.4 1.9
Classification 1500 cohorts b. 1498-1547 1550 cohorts b. 1548-1597 1600 cohorts b. 1598-1647 d50+ d -50 All d50+ d -50 All d50+ d -50 All No. of sons 0 12 12 24 9 31 40 5 16 21 1 20 23 43 29 25 52 20 34 54 2 19 18 37 17 17 3 20 12 32 3 17 10 27 14 6 20 16 11 27 4 7 2 9 7 3 10 8 6 14 5 2 3 5 1 0 1 5 1 6 6 0 0 0 2 0 2 7 0 0 0 1 0 1 8 0 2 2 9
Total no. of sons 147 112 259 136 105 241 184 120 304
No. who died young 2 1 3 18 21 39 11 13 24
No. of families 77 68 145 75 84 159 77 80 157
No. of remarriages 7 10 17 6 3 9 12 2 14
Ave. no. of sons per family 1.9 1.7 1.8 1.3 1.5 2.4 1.5 1.3 1.9 % who died yang 1.4 0.9 1.2 13.2 20.0 16.2 6.0 10.8 7.9 % re-married 9.1 14.7 11.7 8.0 3.6 5.7 15.6 2.5 8.9 % of families without sons 15.6 17.7 16.6 12.0 36.9 25.2 6.5 20.0 13.4
15 Table 7 (continued) Classification 1650 cohorts b.1648-1697 1700 cohorts b. 1698-1747 1750 cohorts b. 1748-1797 d50+ d -50 All d50+ d -50 All d50+ d -50 All No. of sons 0 7 24 31 27 63 90 38 126 164 1 48 28 76 72 88 160 66 181 247 2 42 33 75 59 84 143 56 91 147 3 34 18 52 61 38 99 57 66 123 4 31 7 36 45 22 67 45 29 74 5 8 4 12 21 10 31 22 13 35 6 6 2 8 7 2 9 11 6 17 7 3 0 3 8 0 8 8 0 4 4 9 0 2 2
Total no. of sons 455 208 663 700 520 1220 761 828 1589
No. who died young 28 18 46 34 48 82 115 132 247
No. of families 179 116 295 292 307 599 303 518 821 No. of remarriages 15 11 26 41 17 58 45 43 88 Ave. no. of sons per family 2.5 1.8 2.3 2.4 1.7 2.0 2.5 1.6 1.9 % who died yang 6.2 8.7 6.9 4.9 9.2 6.7 15.1 15.9 15.5 % re-married 8.4 9.5 8.8 14.0 5.5 9.7 14.9 8.3 10.7 % of families without sons 3.9 20.7 10.5 9.3 20.5 15.0 12.5 24.3 20.0
Classification 1800 cohorts b. 1798-1817(46)a Total d50+ d -50 All d50+ d -50 All No. of sons 0 4 241 245 102 515 617 1 10 265 285 294 656 950 2 15 120 135 238 383 621 3 13 55 68 223 211 434 4 12 31 43 164 109 273 5 3 18 21 65 50 115 6 1 5 6 27 15 42 7 0 1 1 12 2 14 8 0 6 6 9 0 2 2
Total no. of sons 158 921 1079 2666 2991 5577
No. who died young 35 248 284 245 484 729
No. of families 68 736 804 1125 1949 3074 No. of remarriages 19 87 106 149 174 323 Ave. no. of sons per family 2.3 1.3 1.3 2.4 1.5 1.8 % who died yang 22.2 27.0 26.3 9.2 26.6 13.1 % re-married 27.9 11.8 13.2 13.2 8.9 10.5 % of families without sons 5.9 32.7 30.5 9,.1 26.4 20.1
a
For those who died at age 50 and over, the observation ended in 1817.
16
When the two lineages are compared it is striking that the mean number of sons in the Zhou lineage (1.6) was lower than that of the Wang (1.8). Both values are less than the average total fertility of husbands listed in Table 4, because families for which information was incomplete, and also families without any sons, have been taken into consideration.
If we consider changes over time, movements in the average number of sons per family in both lineages were similar though slightly different in magnitude. The percentage of sons who died whilst still young (generally before their fifteenth birthday) amounted on average to 10.8 per cent among the Zhou and to 13.1 per cent among the Wang. The trend over time in this variable was not as regular as that in the average number of sons. However, it is of interest that fathers belonging to the cohorts born in the 1800s lost a fairly high percentage of their sons (28.8 per cent among the Zhou and 26.3 per cent among the Wang). We shall consider movements in mortality later; here it will be sufficient to note that Chinese genealogical records relating to mortality are incomplete, and that it is particularly difficult to estimate child mortality, as vital dates were not generally available for those who died young.
The frequencies of remarriage listed in Tables 6 and 7 are limited to second marriages, i. e., a man who married for the third time was only counted once. There was no discernible trend in the percentage of remarriages.
It is striking that in the two genealogies considered, the percentages of families without any sons were fairly high and quite similar (Zhou: 20.4 per cent; Wang: 20.1 per cent). A peak was reached for the cohorts of 1550, and again for the cohorts of 1800. In the latter cohort, almost one-third of fathers had no sons, this suggests that there was a decrease in the fertility of men during the nineteenth century. The high percentage of families without sons was closely related to the practice of adoption in Chinese families. But we shall not consider this subject here, as it is more important for family history than for historical demography.
2.3 Mortality
I have mentioned that Chinese genealogies provide only meager data for the estimation of childhood mortality. Another deficiency in the genealogical records relating to mortality is that, even for adults, the number of those whose dates of birth and death were known was smaller than that of those for whom only the date of birth was given.13 The first defect makes it almost impossible to estimate childhood mortality from genealogical data directly. An indirect solution would be extrapolation
13
Liu Ts’ui-jung, “The Demographic Dynamics of Some Clans in the Lower Yangzi Area, ca. 1400- 1900,” Academia Economic Paper, 9:1 (1981), 115-160.
17
based on model life tables. Alternatively, all the data relating to one family or lineage could be combined, especially where the numbers are small.
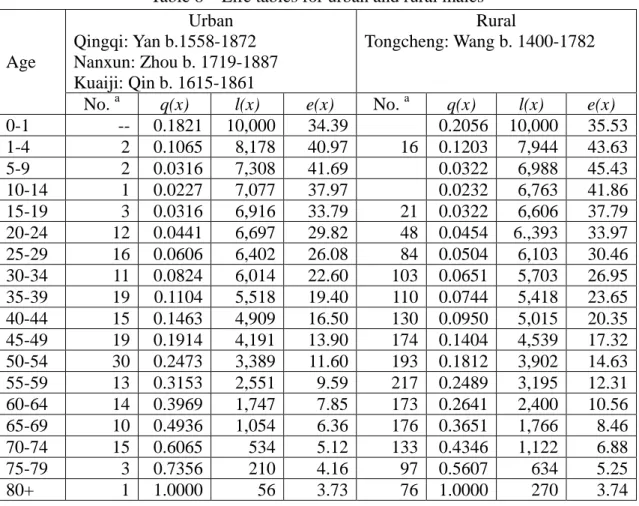
In this chapter our discussion of mortality will be based on two life tables (see Table 8) which have been constructed for one group of urban and one or rural males. The urban group included members of the Yan family from Qingqi, the Zhou family from Nanxun 南潯 (both towns around Lake Tai), and the Qin 秦 lineage from the city of Kuaiji 會稽 (the county town of Shaoxing 紹興) along the Hangzhou 杭州 bay. For the table of rural males, those belonging to the Wang lineage of Tongcheng were selected.
Table 8 Life tables for urban and rural males
Age Urban Qingqi: Yan b.1558-1872 Nanxun: Zhou b. 1719-1887 Kuaiji: Qin b. 1615-1861 Rural Tongcheng: Wang b. 1400-1782
No. a q(x) l(x) e(x) No. a q(x) l(x) e(x)
0-1 -- 0.1821 10,000 34.39 0.2056 10,000 35.53 1-4 2 0.1065 8,178 40.97 16 0.1203 7,944 43.63 5-9 2 0.0316 7,308 41.69 0.0322 6,988 45.43 10-14 1 0.0227 7,077 37.97 0.0232 6,763 41.86 15-19 3 0.0316 6,916 33.79 21 0.0322 6,606 37.79 20-24 12 0.0441 6,697 29.82 48 0.0454 6.,393 33.97 25-29 16 0.0606 6,402 26.08 84 0.0504 6,103 30.46 30-34 11 0.0824 6,014 22.60 103 0.0651 5,703 26.95 35-39 19 0.1104 5,518 19.40 110 0.0744 5,418 23.65 40-44 15 0.1463 4,909 16.50 130 0.0950 5,015 20.35 45-49 19 0.1914 4,191 13.90 174 0.1404 4,539 17.32 50-54 30 0.2473 3,389 11.60 193 0.1812 3,902 14.63 55-59 13 0.3153 2,551 9.59 217 0.2489 3,195 12.31 60-64 14 0.3969 1,747 7.85 173 0.2641 2,400 10.56 65-69 10 0.4936 1,054 6.36 176 0.3651 1,766 8.46 70-74 15 0.6065 534 5.12 133 0.4346 1,122 6.88 75-79 3 0.7356 210 4.16 97 0.5607 634 5.25 80+ 1 1.0000 56 3.73 76 1.0000 270 3.74 a
No. is the observed number of deaths.
Source: Qingqi Yan shi jiapu (The genealogy of the Yan family at Qingqi) (1892 edition); Nanxun Zhou shi jiapu (The genealogy of the Zhou family at Nanxun) (1911 edition); Kuaiji Qin shi zongpu (The genealogy of Qin lineage in Kuaiji) (1911 edition); Tongcheng Wang shi zongpu (The genealogy of the Wang lineage in
Tongcheng) (1866 edition).
As may be seen from Table 8, the observed number of deaths of urban males was small, even though data from three genealogies were combined. In both parts of
18
the table the numbers of observed deaths of males below the age 15 was very small. Therefore, the values of q(x) were computed from data beginning with the age-group 15-19 and ending with that of 80+. The values were then graduated and extrapolated to the beginning of life.14 The results show that the mortality of members of these two populations was much the same, with a slight excess for the urban group. However, as the urban section was based on relatively small numbers this finding can only be regarded as provisional.
We shall use the table for the Wang lineage to investigate changes in mortality over time. Male adults in that lineage were divided into six cohorts: the 1500 cohort, born between 1498 and 1547, all of whom had died by 1627; the 1550 cohort, born between 1548 and 1597, all of whom had died by 1677, and so on to the 1700 cohort, born between 1698 and 1747, all of whom had died by 1827, and a final 1750 cohort, born between 1748 and 1782, all of whom were dead by 1862. Life tables constructed for these cohorts based on adult deaths yielded an expectation of life at age 15 amounting in successive cohorts to 41.88 years, 34.14 years, 37.87 years, 42.61 years, 40.53 years, and 38.01 years respectively. The highest mortality was experienced by the 1550 cohort, all of whose members had died by 1677. This seems reasonable as the transition crisis of the Ming-Qing period occurred during lifetime of members of this cohort. Life expectancy in succeeding cohorts improved, up to the cohort whose members had died by the end of the eighteenth century, which shows that mortality could have been increasing during the nineteenth century.
This trend in the mortality of the Wang lineage seems to fit in with the general political and economic changes that occurred in China throughout the period of observation. But the Wangs were primarily rural residents; what then was the situation of the urban population? There is insufficient information to make it possible for us to reach a conclusion on this matter.
2.4 Migration
In the preceding discussion we have considered some aspects of nuptiality, mortality, and fertility in urban and rural populations of the lower Yangzi region. A major force which would affect the pace of urbanization in any period or place is the amount of rural-urban migration. This topic, too, will be illustrated in this chapter by means of some case-studies.
For example, it has been found in a study of lineages at Linghuzhen 菱湖鎮, a
14
I-chin Yuan, “Life Tables for a Southern Chinese Family from 1365 to 1849”, Human Biology, 3: 2 (1931), 157-179. The model life table used was Coale and Demany’s Model West table, levels 7 and 8 respectively.
19
market town which specialized in trade in silk goods in Quian 歸安 county, Zhejiang, that the founders of thirty-five of the fifty-nine lineages resident in the town by the end of the eighteenth century had moved into the town from elsewhere. The distribution of these migrants by their date of arrived in the town is shown in Table 9. During a long span extending over 435 years, the first and the fifth periods stand out as being more favorable to geographical mobility than the others, if migration is measured by the number of migrants per decade (in the first period the number was 1.6 and in the fifth, 1.1).
Table 9 Date of arrival of migrants to Linghuzhen
Period Number of years Number of migrants Migrants per decade
1360-1398 38 6 1.6
1399-1521 122 10 0.8
1522-1620 98 5 0.5
1621-1722 101 6 0.6
1723-1795 72 8 1.1
Source: Shih Chin, “Peasant Economy and Rural Society”, 109-110.
Information on place of origin of the migrants shows that, between 1360 and 1798, twenty-six came from the western part of Zhejiang. Among them fourteen came from villages and seven from other towns. Seven came from the eastern part of Zhejiang, five from Anhui, three from Jiangsu, and one from as far away as Hunan. Even this single example, which relates to one town only, reveals a great deal of information about rural-urban migration, and can be seen to reflect changes in political, social, and economic conditions.15
Another case relating to migrants among members of the Wang lineage is considered below. In Table 10 migrants in this lineage were classified by the frequency of migrants in each generation and by the destinations of the out-migrants. Table 10a shows that the percentage of migrants was never very high, but a large number of the out-migrants who belonged to the Wang lineage were born during the eighteenth and early nineteenth centuries. Table 10b shows that, apart from those whose destinations were unknown, the Wangs tended to move quite a distance away from their place of birth. Since in most of these cases the genealogy only gives their destination as a county or a province, it may not be right to think of them all as moving to the county town or the provincial capital. However, it is known that those who moved to Jiangsu, Jiangxi, Zhejiang, Fujian, Guangdong, and Zhili were bound for the town. Moreover, many of those who moved to Shannxi and also those who
15
Shih Chin, “Peasant Economy and Rural Society”; D. H. Perkins, Agricultural Development in China, 1368-1968 (Chicago, 1969).
20
moved to unknown destinations were engaged in trade. All this suggests that the migration movements of members of the Wang lineage were similar to the major migration streams in China during the eighteenth century, and that they tended to move to towns rather than rural areas, ad did those from the Wei and Li lineages in Hunan province.16
Table10a Frequency of migration in each generation in the Wang lineage in Tongcheng
Generation Number of males recorded
Number of migrants
(year of birth in parentheses)
% of migrants 10 158 3 (?) 1.9 11 131 5 (2?, 1609-1674) 3.8 12 197 3 (1672-1710) 1.5 13 355 4 (2?, 1660-1712) 1.1 14 506 9 (1?, 1715-1758) 1.8 15 722 19 (4?, 1714-1808) 2.6 16 742 25 (6?, 1775-1836) 3.4 17 635 24 (1?, 1738-1825) 3.8 18 392 12 (2?, 1804-1851) 3.1 19 189 5 (1804-1826) 2.6 Total 109
Table 10b Destinations of out-migrants in the Wang lineage in Tongcheng Province Number First known year of birth Last known year of birth
Anhui 29 1609 1824 Shaanxi 18 1714 1797 Jiangsu 4 1797 1852 Guangxi 4 1674 1712 Jiangxi 2 1660 1799 Zhejiang 1 1808 Henan 1 1763 Guangdong 1 1758 Fujian 1 1819 Zhili 1 ? Not known 47 1672 1851 Total 109
Source: Tongcheng Wang shi zongpu (The genealogy of the Wang lineage in
Tongcheng) (1866 edition).
There is still no comprehensive study of rural-urban migration in the lower Yangzi region as a whole. The major difficulty lies in the lack of systematically collected statistics. All that one can say is that rural-urban migration is likely to have
16
21
been increasing from the late nineteenth century onwards, as Shanghai grew to become the largest city in modern China.17
To sum up this section, we should consider five points. First, the rural and urban populations in the lower Yangzi region differed in their nuptiality, and particularly in their rates of remarriage. Secondly, as regards fertility, this was slightly lower in the core of the region than at the periphery, and the fertility of men who lived in towns was higher, because of their higher rates of remarriage. Thirdly, as far as we know at the moment, mortality levels were similar in the urban and rural populations. Fourthly, small-scale studies on individual towns and lineages appear to show evidence of migration from the countryside to the towns, particularly during the eighteenth and nineteenth centuries. However, large-scale systematic studies of his subject will be needed in the future. Finally, we may note that the findings relating to demographic characteristics and their changes over time went in parallel with general changes in political and economic conditions during the period studied.
3. Other Factors related to Demographic Characteristics
In this section we shall focus on attitudes, mentality, and institutional arrangements which may be related to demographic characteristics of the population in the lower Yangzi region, with an emphasis on urban populations. Since information on this subject remains scanty, our discussion must be regarded as tentative, although it does provide useful insights into the demographic characteristics that we have found so far.
Although the remarriage of widowers was a normal phenomenon, marriage to much younger women was ridiculed.18 Moreover, although concubinage was regularly practiced in the towns, stories were told during the Qing period about righteous men who rescued unfortunate girls from becoming concubines and helped them to contract proper marriages, and these men were ultimately rewarded for their efforts.19 A concubine was usually obtained by purchase, and some wealthy men
17
Liu Shih-chi, “Taiping Tianguo luanhou Jiangnan shizhen de fazhan 太平天國亂後江南市鎮的發展, 1865-1911 (The Development of Market Towns in Jiangnan after the Taiping Rebellion, 1865-1911)”, Shih-huo Monthly, 7: 11 (1978), 547-576; M. Elvin, “Market towns and Waterways: The County of Shanghai from 1480 to 1910”, in G. W. Skinner (ed.), The City in Late Imperial China (Stanford, 1977), 441-474; C. W. Pannell, “Recent Growth and Change in China’s Urban System”, in L. Ma and E. W. Hanten (eds.), Urban Development in Modern China (Boulder, Colo., 1981), 91-113.
18
Chu Jiaxuan 褚稼軒, “Jian-gu shou-ji 堅觚首集” (1695 edition), 1/11a-b in Biji xiao-shuo da-quan xü-bian 筆記小說大觀續編 (Additional Collection of Notes and Stories) (Taipei, reprint, 1962), vol. 13; Chu Jiaxuan, “Jian-gu shi-ji 堅觚十集”, 4/12b-13a, ibid., vol.15.
19
Liang Gungchen 梁恭辰, “Bei-dong-yuan bi-lu san-bian 北東園筆錄三編” (1845 edition), 2/6b in Biji xiao-shuo da-quan 筆記小說大觀 (A Collection of Notes and Stories) (Taipei, reprint 1962), vol. 23; Chen Kangqi 陳康祺, “Lang-qien ji-wen 郎潛記聞” (1880 edition), 2/8b, ibid, vol.22.
22
were able to afford to be generous and provided matchmakers with opportunities to profit.20
As regards remarriage of widows it would appear that only during the Qing period were remarried women looked down upon. Cases of families of scholar-officials were cited to show that “remarried women were not considered to be anomalous” during the Song dynasty.21 However, Qing customs in the lower Yangzi area meant that remarried women were treated differently in the marriage ceremony and there were often bitterly criticized.22 In these circumstances it is not surprising that there are countless cases in the literature of women who were praised for their virtue!23 Most local gazetteers contain chapters which tell stories of virtuous women, or at least list their names. In addition, philanthropic organizations were founded in many cities for the support of poor widows. For example, in Wujin county a
jingjietang 敬節堂 (literally, a Hall for Respectable Charity) was founded in 1796 to
support 300 virtuous widows every year.24 In Jiangdu county a lizhentang 勵貞堂 (literary, a Hall for Determinative Chastity) was founded in 1840 to support young widows less than 30 years old, and a xulijü 恤嫠局 (Office for the Assistance of Poor widows) to distribute subsidies to widows of the poor gentry class, and a baozhenjü 保貞局 (Office for the Protection of Virtuous widows) were set up in 1881 to provide pensions for widows who had decided not to remarry.25 This evidence of attitudes towards the remarriage of men and women in Imperial China in the lower Yangzi region supports our contention that the fertility of husbands exceeded that of first wives.
The reason for the rather moderate level of marital fertility in the lower Yangzi region in Ming-Qing China may lie in the fact that estimates based on genealogical records underestimate true fertility, as only recorded sons were counted. Could there be other reasons besides deficient data? It is well known that infanticide was practiced as a means of population control in traditional China.26 However, during the Qing
20
Cai-heng-zi 采蘅子, Chung-ming man-lu 蟲鳴漫錄 (1877 edition), 1/25b-26a in Bi-ji xiao-shuo da-guan, vol. 14.
21
Lu Jingan 陸敬安, “Leng-lu za-shi 冷廬雜識” (1865 edition), 1/10b in Bi-ji xiao-shuo da-guan xü-bian, vol. 13; Chu Jianxuan, “Jian-gu san-ji 堅觚三集”, 1/11a , ibid., vol. 14; Qien Yung 錢泳, “Lu-yuan cung-hua 履園叢話” (1870 edition), 23/6a-b in Bi-ji xiao-shuo da-guan, vol. 17.
22
Cai-heng-zi, Chung-ming man-lu, 2/12b; Chu Jiaxuan, “Jian-gu shou-ji”, 4/8-13b.
23
Lu Jingan, “Leng-lu za-shi”, 6/8a-b; Zhu Meishu 朱梅叔, “Mai-you-ji 埋憂集” (1874 edition), 4/8b in Bi-ji xiao-shuo da-guan, vol. 10; Huang Junzai 黃鈞宰, “Jin-hu qi-mo 金壺七墨” (1895 edition), 51b-2a, ibid., vol.11; Zhu Mouxiang 朱畮香, “Ming-zhai xiao-shi 明齋小識” (181 edition), 4/1b-12a, 5/12a-b, ibid., vol. 13.
24
Wujin Yanghu hozhi 武進陽湖合志(A Combined Local Gazetteer of Wujin and Yanghu Counties) (1866 edition), 5/25b.
25
Jiangdu xü xianzhi 江都續縣志 (Additional Gazetteer of Jiangdu County) (1885 edition), (Taipei, reprint, 1970), 12b/18-21.
26
23
period homes for foundlings (yuyingtang 育嬰堂, literally, homes for nursing babies) were set up in cities in the lower Yangzi region by members of local élite groups.27 At least forty-five such homes were founded between 1655 and 1736 in county towns or prefectural capitals.28 The motive behind the founding of such institutions was partly the revulsion felt by members of the élite classes against the practice of infanticide, but it was also true that economic development had made available more funds which could be used to set up and support these organizations. In short, effectiveness of infanticide as a measure of population control in the lower Yangzi region during the Qing period would have been checked provided these foundling homes were functioning properly.
Since age at marriage was generally quite low in traditional China,29 late marriage could not have acted as a preventive check. It is, however, noteworthy that the literature of the Ming-Qing period contains references both to contraception and to abortion. For example, in an essay written in memory of his mother, Gui Youguang 歸有光 (1507-71), a famous scholar form Kunshan崑山, mentioned that she had suffered when giving birth to her seven children (four girls and three boys, of whom two girls died when they were very young), and did not want to conceive again. She took some kind of drink, concocted by an old woman, which contained two spirals. As a result, she lost the power of speech, though she did not conceive again, and died a year later at the age of 25.30
Though this story does not suggest that the potion was particularly effective, it is revealing that the idea of contraception did exist, and that birth control was practiced in the area as early as the beginning of the sixteenth century. Moreover, it is mentioned in the contemporary literature that there were women who specialized in the provision of abortifacient drugs who were known as yaopo 藥婆 (women pharmacists), and who were skilled in providing abortions.31 However, scanty this evidence is, it does suggest that the practice of abortion could have affected the
Kangqi, “Lang-qien ji-wen”, 10/3b; G. Rozman, Population and Marketing Settlements in Ch’ing China (Cambridge, 1982), 35-38.
27 S. Fuma 夫馬進, “Zendō zenkai no shuppatsu 善堂、善會の出發 (The Beginning of ‘shantang and
‘shanhui’),” in K. Ono 小野和子 (ed.), Min-Shin jidai no seiji to shakai 明清時代の政治と社會 (Politics and Society in the Ming-Qing Periods) (Kyoto, 1983), 210-219.
28
Liang Ch’i-tzu 梁其姿, “Shiqi shipa shiji Changjiang xiayou zhi yuyingtang十七、十八世紀長江下 游之育嬰堂 (Foundling Homes in the Lower Yangzi Area during the Seventeenth and Eighteenth Centuries)” in the Institute of the Three Principles of the People (ed.), Papers on the Maritime History of China (Taipei, 1984), First collection, 97-130.
29
G. W. Barclay et al., “A Reassessment of the Demography of Traditional Rural China,” Population Index, 42: 4 (1976), 609; Liu Ts’ui-jung, “The Demography of Two Chinese Clans in Hsiao-shan, Chekiang, 1650-1850,” in S. Hanley and A. Wolf (eds.), Family and Population in East Asian History (Stanford, Calif., 1985), 13-61.
30
Gui Youguang 歸有光, “Zhenchuan xiensheng ji 震川先生集 (Collected Works of Gui Youguang), in Si-bu cung-kan ci bien 四部叢刊七編 (Shanghai, 1919-22), 25: 328.
31
24
fertility of traditional women in the lower Yangzi region.
There were other customs relating to birth: women who specialized in midwifery (wenpo 穩婆) are mentioned in the Qing literature, but were also known during earlier periods. Stories about the skills of these women who practiced in the lower Yangzi region are told, and some of them became wealthy.32 Moreover, there were many medical and psychological procedures designed to assist women who had experienced difficulties in childbirth.33 These matters may be relevant for any future studies of infant mortality in China, a topic that has not so far been studied in Chinese historical demography.
Finally, we must mention institutions for the relief of the poor, help during famines, and the provision of coffins and burial grounds for poor persons and vagabonds. Some studies of famine relief in traditional China already exist.34 Their functioning would undoubtedly have reduced the number of deaths during periods of food crisis. As regards poor relief, organizations such as yangjiyuan 養 濟 院 (asylums for the relief of the poor), which were established by the state, and pujitang 普濟堂 (asylums for general relief), which were set up by local people, operated in most cities during the Qing period. Their object was to provide shelter for the aged and to distribute alms to widows and orphans.35 When these organizations functioned effectively, the support they provided will undoubtedly have saved the lives of many of the poor.
The provision of coffins and graveyards was considered to be an important philanthropic duty, at least during the Qing period. Such establishments were mentioned in many local gazetteers. Thus, between 1824 and 1841, in Wujin county, offices were set up in seventy-two rural districts to provide coffins for those who died on the roads or rivers, and these establishments kept close contact with the cunrentang 存仁堂 (literally, Hall of Benevolence) which was set up in the county town.36
Quite apart from the fact that these provisions constituted charitable acts which would
32
Chu Jiaxuan, “Jian-gu liu-ji”, Yu Yueh 俞樾, “Cha-xiang-shi xü-chao 茶香室續鈔”, 5/9b, in Bi-ji xiao-shuo da-guan xü-bian, vol. 16; Zhu Mouxiang, “Mai-you-ji”, 7/6b-7a; Lu Changchun 陸長春, “Xiang-yin-lou bin-tan 香飲樓賓談”, 1/16a, in Bi-ji xiao-shuo da-guan, vol. 10.
33
Chu Jiaxuan, “Jian-gu yu-ji 堅 觚 餘 集 ”, 4/5b in Bi-ji xiao-shuo da-guan xü-bien, vol. 17; Qing-cheng-zi 青城子, “Zhi-i xü-bien 志異續編”, 4/4b-5a, 7a, in Bi-ji xiao-shuo da-guan, vol. 22; Yu Yueh, “Cha-xiang-shi xü-chao”, 21/2b-3a.
34
P. E. Will, Bureaucratie et famine en Chine au 18e siècle (Paris, 1980); L. M. Li, “Introduction: Food, Famine and the Chinese State,” Journal of Asian Studies, 41: 4 (1982), 687-710; R. Bin Wong and P. C. Perdue, “Famine’s Foes in Ch’ing China,” Harvard Journal of Asiatic Studies, 43: 1 (1983), 291-331; Liu Ts’ui-jung and Fei Ching-han 費景漢, “Qing-dai cang-chu zhi-du gong-neng chu-tan 清 代倉儲制度功能初探 (Preliminary study on the operation of the Ch’ing Granary Systems)”, Academia Economic Papers, 7: 1 (1979), 1-29; Liu Ts’ui-jung, “Qing-dai cang-chu zhi-du wen-ding gong-neng zhi jian-tao 清代倉儲制度穩定功能之檢討 (A Reappraisal of Functions of Granary System in Ch’ing China)”, Academia Economic Papers, 8: 1 (1980), 1-31. ,
35
Fuma, “The Beginning of ‘shantang’ and ‘shanhui’”, 205-207; Wujin Yanghu hozhi, 3/32a-33a.
25
provide a return for the benefactors, the proper disposal of the bodies of those who died on the roads and rivers was an important hygienic measure for the protection of the environment.
4. Conclusion
Urbanization in the lower Yangzi region during the Ming and Qing periods developed not only through an increase in the number of market towns, but also through the specialization of towns in trading in particular commodities.
Studies based on a number of genealogies show that the proportion of remarried men tended to be higher in the towns than in the country and that this raised urban fertility. Mortality in the towns probably did not differ much from that of the rural population. Migration from the country to the town during the eighteenth and late nineteenth centuries around Shanghai also resulted in increased urbanization. Finally, qualitative information on institutions relating to marriage, births, and deaths can be used to give a better understanding of the quantitative data presented in this chapter.