Corporate Governance and Equity
Liquidity: analysis of S&P
transparency and disclosure rankings
Wei-Peng Chen*, Huimin Chung, Chengfew Lee
and Wei-Li Liao
This paper sets out to investigate the effects of disclosure, and other corporate governance mechanisms, on equity liquidity, arguing that those companies adopting poor information transparency and disclosure practices will experience serious information asymmetry. Since poor corporate governance leads to greater information asymmetry, liquidity providers will incur relatively higher adverse information risks and will therefore offer higher information asymmetry components in their effective bid-ask spreads. The Transparency and Disclosure (T&D) rankings of the individual stocks on the S&P 500 index are employed to examine whether firms with greater T&D rankings have lower information asymmetry components and lower stock spreads. Our results reveal that the economic costs of equity liquidity, i.e. the effective spread and the quoted half-spread, are greater for those companies with poor infor-mation transparency and disclosure practices.
Keywords: Corporate governance, transparency and disclosure, asymmetric information costs, liquidity
Introduction
F
inancial transparency and information dis-closure are extremely important elements of good corporate governance. Within those firms where poor financial transparency and information disclosure practices are adopted, managers are more likely to use their infor-mation advantage to pursue a private benefit of control, which will ultimately lead to an increase in the agency costs faced by share-holders. As the agency problem worsens, insiders (such as executives or controlling owners) can easily exploit the wealth and rights of small shareholders; it is for this reason that poor corporate governance is asso-ciated with bad disclosure practices.Improving transparency and disclosure practices ultimately leads to better corporate governance, largely because the disclosure practices of a firm can be viewed as effective mechanisms for the protection of the rights of
outsiders. Better transparency and disclosure practices can help shareholders to gain a better understanding of firms’ management prac-tices, thereby helping to reduce the informa-tion asymmetry faced by investors.
Relating this to the equity market, investors are not only willing to pay a higher price to buy stocks in those companies with better information disclosure, but they will also be more willing to trade in them. Conversely, when firms reveal poor corporate governance, liquidity providers (such as market makers or dealers) will take action to protect their prices, broadening the spreads of the affected stocks to compensate for potential losses arising from trading in these equities by informed traders. The issue of firms’ financial transparency and information disclosure has recently gained greater attention, from both market regulators and investors alike, with the ranking institutions, such as Standard & Poor’s and Moody’s, now using financial *Address for correspondence:
No. 1001, Ta Hsueh Road, Hsinchu City, Taiwan, Republic of China, 300. E-mail: wpchen.ms92g@nctu.edu.tw
transparency and information disclosure as one of the criteria for assessing the manage-ment capabilities and reputation of firms; indeed, the results of a Transparency and Disclosure Study (the T&D Study) were pub-lished by Standard & Poor’s on 16 October 2002.1 This study provides the T&D rankings
of firms under three disclosure categories, according to the T&D practices of each firm, and then calculates a final ranking; these final rankings ultimately provide a reference enabling investors to assess the transparency and disclosure practices of any given firm.
Whilst there is an abundance of studies on the effects of corporate governance on equity prices, to the best of our knowledge, few studies have been undertaken on the liquidity costs of poor corporate governance. The purpose of this study is to investigate the simultaneous relationship between corporate governance and equity liquidity, arguing that companies with poor corporate governance will incur both higher agency costs and higher asymmetric information risk. Liquidity pro-viders will broaden the equity spreads of firms exhibiting poor corporate governance, with such price protection action reducing the market liquidity of these equities.
The S&P T&D ranking, which is used in this study as a proxy variable for corporate gover-nance, is employed to examine whether the stocks of firms with higher rankings exhibit better market liquidity. There should, theoreti-cally, be a direct correlation between the T&D ranking and the information asymmetry com-ponent, because a lower T&D ranking implies lower disclosure practices, which in turn will lead to liquidity providers facing higher asymmetric information risks.
In response, and so as to compensate for this higher risk, liquidity providers must increase the information asymmetry component of the effective spread. We therefore predict that a stronger negative correlation will exist between the firm’s T&D ranking and the infor-mation asymmetry component of the effective spread.
Several of the prior works have indicated that simultaneity may exist in the determin-ation of bid-ask spread and a firm’s disclosure policy (Dye, 1985; Lang and Lundholm, 1993; Welker, 1995). When managers determine a firm’s disclosure policy, they are likely to con-sider the present market liquidity of the firm’s stock; indeed, when liquidity providers quote the bid and ask price of a stock, they will, as a matter of course, refer to the disclosure prac-tices of a firm as an important measure of the degree of information asymmetry.
This study adopts the three-stage least squares (3SLS) method to obtain more efficient
estimates and more robust test results, whilst also employing the generalised method of moments (GMM) estimation method, since this places no restrictions on either the condi-tional or uncondicondi-tional variance matrix of the disturbance term. Under the GMM frame-work, we can obtain the asymptotically effi-cient estimator without making any additional assumptions, which clearly enables us to obtain the most robust results.
After controlling for firms’ trading charac-teristics and several determinants of disclo-sure practices, our empirical results from the 3SLS and GMM estimations reveal a signifi-cant negative relationship between the T&D rankings and our liquidity measures. The results also reveal a strongly negative relation-ship between the T&D rankings and the information asymmetry components. These findings are consistent with our hypothesis that better corporate governance is associated with better equity liquidity.
This study has several contributions to make to the financial literature and practices. First of all, we link the concepts of disclosure practice, information asymmetry, the agency problem and corporate governance to equity liquidity, and find that the empirical results are not only statistically significant, but also consistent with our hypothesis that better corporate governance is accompanied by better equity liquidity. Secondly, the potential problem of endogeneity within the T&D ranking is ex-plored by using 3SLS and GMM estimation methods within the study in order to provide more reliable empirical evidence for our examination of the impact of corporate gover-nance on equity liquidity. Thirdly, we estimate the information asymmetry components of the effective spread as a means of measuring the asymmetric information costs demanded by liquidity providers so as to compensate for possible losses arising from informed trading activities.
We find that the T&D rankings have a sig-nificant and negative relationship with the in-formation asymmetry component, implying that poorer disclosure practices will lead to lower equity liquidity as a result of the in-creased asymmetric information costs de-manded by liquidity providers, essentially because order processing costs are invariably fixed. Finally, we suggest that investors should be cautious in their use of these rankings as a means of directly assessing the extent of the financial transparency and disclosure practices of a given firm.
The remainder of this paper is organised as follows. A review of the related literature and hypothesis development is undertaken in the next section, followed by an introduction to
the models adopted for our liquidity meas-ures, the control variables used within our dependent variables, and a description of the data and the research methodology adopted for the study. The penultimate section presents the empirical results of our study, followed, in the final section, by some concluding remarks drawn from this research.
Literature review and
hypothesis development
Disclosure practices, corporate
governance and information asymmetry
The relationship between disclosure prac-tices and corporate governance is already well covered within the prior literature. Lowen-stein (1996), for example, argued that good disclosure is an extremely efficient and effec-tive mechanism for ensuring that managers perform better; this implies that firms with better information disclosure may achieve better corporate governance. Healy et al. (1999) also suggested that increases in the disclosure ratings are accompanied by increases in firms’ stock returns, institutional ownership, analyst following and stock liquidity; their findings reinforce those within the management fore-cast literature where it is argued that volun-tary disclosures are credible.
La Porta et al. (1998) went on to suggest that financial transparency has a crucial role to play in corporate governance through the informa-tion which it provides to investors, and whilst noting that there were four major corporate governance attributes, with regard to volun-tary disclosure, that were provided by listed firms in the Hong Kong stock market, Ho and Wong (2001) subsequently went on to reveal a number of significant relationships. Mitton (2002) used disclosure quality as one of the firm-level corporate governance proxy meas-ures as a means of examining whether corpo-rate governance practices could have some impact on stock price performance.
In their report on S&P T&D methodology, and the T&D study itself, Patel and Dallas (2002) argued that good corporate governance must include a vigilant board of directors, adequate and timely disclosure of financial information, meaningful disclosure about the board and its management processes, and a transparent ownership structure identifying any conflicts of interests between managers, directors, shareholders and other related parties. Financial transparency and disclosure are therefore very basic, but very important, elements of corporate governance, which im-plies that good corporate governance is associ-ated with good disclosure practices.
The extent of a firm’s disclosure practices can affect the quality of its corporate gover-nance by reducing the asymmetric informa-tion faced by investors. Botosan (1997) found that the increasing level of disclosure by firms can reduce the information asymmetry between managers and investors, and thus reduce the cost of a firm’s equity capital. Lang and Lundholm (1999) indicated that higher levels of disclosure should lead to a lower cost of capital by reducing both the information risk and the transaction costs. Patel and Dallas (2002) also showed that both the composite and annual basis T&D rankings had a negative relationship with market risk, whilst Leuz et al. (2003) pointed out, in particular, that strong and well-enforced outsider rights could limit the acquisition of private control benefits by insiders, and as a consequence, may mitigate the insiders’ incentives to manage accounting earnings, largely because there would be little to conceal from other traders.
Since the disclosure practices of firms can be viewed as mechanisms for the effective protec-tion of outsider rights, in terms of helping shareholders to gain a better understanding of the firm’s management, they can also prevent managers from using their information advan-tage to pursue a private benefit of control. Con-sequently, the agency cost will be reduced in those firms with better financial disclosure practices, and it is within these firms that better corporate governance will be estab-lished. Accordingly, we argue that if the S&P T&D rankings are able to provide an accurate description of the disclosure practices of firms, those firms with higher T&D rankings will have better disclosure practices, accompanied by lower asymmetric information risk and better corporate governance.
Corporate governance and
market liquidity
It is widely accepted that corporate governance is an important factor in financial market development, firm value, the concentration of ownership and many other different aspects of firm performance.2 Hauswald and Marquez
(2006) provided one of the most recent studies on these specific issues, presenting a theoreti-cal model in which it was argued that by pro-moting greater transparency, firms’ disclosure policies fostered external scrutiny, and thus increased activity in the market for corporate control. There have, nevertheless, been very few studies which have set out with the overall aim of investigating the impact of corporate governance on the equity liquidity of firms.
Within the prior empirical literature, Heflin
be-tween disclosure policy and market liquidity using Financial Analysts Federation (FAF) reports and effective spreads. Having found that effective spreads and disclosure policy ratings were inversely related, they argued that a policy of enhanced financial disclosure was related to improved market liquidity. Similarly, Brown and Hillegeist (2006) exam-ined the ways in which disclosure quality was related to long-run information asymmetry. Their analyses indicated that disclosure by firms was negatively related to the average level of information asymmetry. Accordingly, the first hypothesis proposed in our study is:
Hypothesis 1: The equities of those firms with better disclosure practices (better corporate gov-ernance) will have relatively better market liquidity.
Stoll (1978a, 1978b) modelled the source of the spreads in the spirit of Demsetz (1968) by anal-ysing the cross-sectional relationship between a stock’s proportional quoted half-spreads and the trading characteristics of the firm, and found that this relationship had changed little over time, remaining strong. It was subse-quently further argued by Lin et al. (1995) that demanders of immediacy services rarely received prices which were less favourable than the prevailing quotes on the NYSE. There-fore, the effective spread, which is defined as the absolute value of the difference between the trade price and the quote midpoint just prior to the trade, is viewed as a more precise and better measure of a firm’s market liquid-ity. Following on from these prior works, this study uses both the quoted half-spread and the effective spread as proxies for the market liquidity of firms.
The information asymmetry component is a compensation arising from the asymmetric information risk faced by liquidity providers. Since it is difficult to determine who the informed traders are, the providers of liquid-ity cannot prevent the losses incurred when they actually trade with an informed trader. Effective spread must therefore include an appropriate information asymmetry compo-nent in order to compensate for this risk of loss, thereby enabling liquidity providers to maintain their operations against informed trading activities. We follow the model de-veloped by Lin et al. (1995) to calculate the information asymmetry component of the effective spread, and then use this as a measure of the immediate transaction costs arising from a firm’s asymmetric information risk.
Extending the prior research of Welker (1995) and Brockman and Chung (2003), this study uses the S&P T&D rankings as proxies
for firms’ disclosure practices, arguing that the ranking could be an effective measure of the corporate governance and asymmetric information risk perceived by both market makers and dealers. In addition to using the quoted bid-ask spread, we use the effective spread, a more precise measure of a firm’s liquidity, along with the adverse informa-tion component of the effective spread, to examine the relationship between the disclo-sure practices of firms and their market liquidity levels.
If S&P T&D ranking is indeed a good proxy for the disclosure practices of firms, we expect that those firms with higher T&D rankings will have smaller quoted spreads, effective spreads and information asymmetry compo-nents, implying that some association does exist between good market liquidity and good corporate governance.
Corporate governance proxy variable:
S&P T&D rankings
This study uses the Transparency and Disclo-sure (T&D) rankings, provided by the S&P Transparency and Disclosure study, as a proxy for the disclosure practices of firms. Patel and Dallas (2002) identify 98 disclosure items, clas-sified into three broad categories:
1. Ownership structure and investor rights; 2. Financial transparency and information
dis-closure; and
3. Board and management structure and process.
Their study indicates whether these individual items are disclosed, focusing mainly on annual reports as the primary source of information disclosure. They also consider other forms of regulatory filings as an additional source of corporate disclosure. Their study therefore evaluates firms’ disclosure patterns, based initially upon annual reports alone (annual basis), and secondly on annual reports, 10-Ks and other proxy statements (composite basis). Each ranking within the three categories is evaluated on both bases, from which the final rankings are then calculated.
A number of recent studies have provided compelling evidence to show that a firm’s T&D ranking could be a good proxy for cor-porate governance. In her examination of the relationship between corporate governance, transparency and financial disclosure, Mallin (2002) noted that surveys of investor opinions placed significant emphasis on the importance of transparency and disclosure in a good corporate governance system. She therefore
argued that transparency and disclosure were key attributes of any model of good corporate governance.
Cheng et al. (2003) used the T&D rankings as proxies for corporate governance in their investigation of the effects of both the level of the rankings and the differential rankings between composite and annual report rank-ings on three market metrics, market beta, risk-adjusted abnormal returns and earnings response coefficients surrounding the an-nouncement date.3 The results revealed that
the release of the S&P T&D rankings brought new information to the market, with the rank-ings affecting shareholder wealth in a manner consistent with the rankings measuring the strength of corporate governance.
In their investigation of the relationship between corporate governance and valuation using Credit Lyonnais Securities Asia (CLSA) and S&P score data, Durnev and Kim (2005) found a significant correlation between the CLSA composite index and the S&P aggregate score. Their findings indicated that those com-panies which scored high on corporate gover-nance under the CLSA scoring system also scored high on disclosure under the S&P scoring system. They also demonstrated a positive correlation between the S&P T&D rankings and the strength of corporate gover-nance in emerging countries.
In this study, we also regard the S&P T&D ranking as a good proxy for corporate gover-nance, and use both the annual basis T&D final ranking (AFR) and the composite basis T&D final ranking (CFR) to examine whether firms with higher S&P T&D rankings have better equity liquidity.
The simultaneity of equity spread and
firms’ disclosure practices
Several of the prior studies, both theoretical and empirical, have indicated that simul-taneity may exist in the determination of bid-ask spread and a firm’s disclosure policy. Dye (1985), for example, designed a theoretical model in which the information asymmetry between managers and investors could influ-ence firms’ disclosure policies, whilst Lang and Lundholm (1993) analysed the determi-nants of voluntary disclosure policy, arguing that there was simultaneity in the determin-ation of both bid-ask spread and disclosure practices.
Welker (1995) suggested that disclosure policy choice could be influenced by the level of information asymmetry between manage-ment and uninformed investors, as well as other determinants of bid-ask spreads. Heflin
et al. (2005) tested for a simultaneous
relation-ship between disclosure policy and effective spreads using a two-stage least squares (2SLS) instrumental variable procedure, and found that relative effective spreads were inversely related to disclosure policy ratings.
Durnev and Kim (2005) investigated the relationship between valuation (Tobin’s Q) and S&P transparency rankings, also using a three-stage least squares (3SLS) method, because of the problem of endogeneity in the regression analysis. By controlling for the simultaneity between governance and valuation, they con-cluded that better governance within firms would lead to higher valuation, whilst Brown and Hillegeist (2006) went on to use a three-stage least squares instrumental variable esti-mation procedure to examine the simultan-eous relationship between disclosure quality and information asymmetry. Following these works, we develop our second hypothesis, as follows:
Hypothesis 2: The determination of spread and firms’ disclosure practices will be simultaneous.
If simultaneity does indeed exist, employing the OLS estimation procedure will generate inconsistent estimates, rendering the infer-ences invalid. Accordingly, we utilise the deter-minants of the disclosure practices and the spread, as instrumental variables, to construct a system of simultaneous equations, and employ the 3SLS method to estimate and test the coefficients within these equations.
We also use a more robust estimation method, the general method of moments (GMM), to estimate and test the simultaneous equations. If the coefficient of our liquidity measure (the quoted spread, effective spread or information asymmetry component) does not demonstrate any strong explanatory capa-bility with regard to disclosure practices, we can argue that no simultaneity exists in the determination of the spread and disclosure practices.
Data and research methodology
The data
Since the Patel and Dallas (2002) report on the S&P T&D study provided only the T&D rank-ings for the constituent firms in the S&P 500 index, these are necessarily the companies that make up the sample for this study. We use the annual basis T&D final ranking (AFR) and the composite basis T&D final ranking (CFR) as proxies for a firm’s corporate gover-nance. Since the S&P T&D study report was
published on 16 October 2002, we take the whole trading days for 2002 as our study period.
A number of empirical studies, including Huang and Stoll (1996) and Barclay et al. (1999), have compared dealer and auction markets, such as the NASDAQ and the NYSE. Based upon these (and other) studies, Stoll (2000) noted that the empirical evidence indi-cated that market design appeared to have some effect on spread. In particular, spreads in the dealer markets were wider than those in the auction markets, largely because dealers within the dealer markets may have more market power; the main reason for this is the expectation that dealers, or market makers, with stronger market power will increase their revenue by widening the spreads.
In order to eliminate this distinction be-tween the constituent stocks on the S&P 500 index, we choose only those stocks listed on the NYSE. Under such a condition, our sample size becomes 424 stocks. For the same reason, the intraday data used to estimate and calcu-late our liquidity measures are based upon those transactions and quotes taking place in the NYSE only.
The daily intraday transaction and quote data for these 424 stocks were obtained from the Trade and Quote (TAQ) database, along with the daily number of trades, daily dollar volume and closing prices of each stock.4 In
addition, each stock’s daily returns (without dividends) were taken from the CRSP data-base in order to calculate the standard devia-tion on the returns for the previous year. Finally, the accounting data used to calculate the other selected variables in this study were all obtained from the Compustat database. After calculating the values of all of the selected variables, we then deleted those firms for which any of the variables had missing values, thereby further reducing our sample size to 341.
Measures of liquidity and the
information asymmetry component
In addition to the measures of equity liquidity, such as the quoted half-spread (QSP) and the proportional quoted half-spread (PSP), we consider the effective spread, which is defined as the absolute value of the one-half signed effective spread:
ESPi t, = zi t, = Pi t, −Qi t, (1)
where Pi,tis the trade price for the trade in firm
i, at time t, and Qi,t is the prevailing quote
midpoint for the transaction in firm i, at time t. Our model of the information asymmetry
component of spread is based on Lin et al. (1995):
Qi t,+1−Qi t, =λi t i t,z, +εi t,+1 (2)
zi t,+1=θi t i t,z, +ηi t,+1 (3)
where Qi,tis the prevailing quote midpoint for
the transaction in firm i, at time t, and zi,tis the
one-half signed effective spread, defined as the transaction price minus the prevailing quote midpoint, with zi,t< 0 for a sell order,
and zi,t> 0 for a buy order. Van Ness et al.
(2001) indicated that the idea of this model was that both bid and ask quotes at time t + 1 would have quote revisions of lz to reflect any potential adverse information revealed by the trade at time t. Since l reflects the quote revi-sion in response to a trade as a fraction of the effective spread, it can be viewed as the infor-mation asymmetry component of the effective spread.
In addition to quote data, we also need intraday transaction data in order to effectively estimate the model for the effective spread and information asymmetry component. Follow-ing the procedure of Lin et al. (1995), the trans-action time and trade price are identified for each transaction, along with the prevailing bid and ask prices.5
After obtaining the transaction data with prevailing quotes, we estimate Equation (2) under the OLS method so as to obtain the daily estimate of the information asymmetry component, λˆ, for each equity in our sample, using all transaction data with prevailing quotes during each day, and then calculating the annual average information asymmetry component for each firm.6
In order to obtain the real cost of the asym-metric information risk induced by informed trading, we multiply each stock’s annual average information asymmetry component by the annual average of its effective spread, with our measure of the asymmetric infor-mation cost of the effective spread being defined as:
INFi,=λˆi,×ESPi,. (4)
The effective spreads and the relative effec-tive spreads are calculated from the transac-tion data with prevailing quotes. For each security in our sample, the dollar effective spread and the relative effective spread are first computed for each transaction during the normal daily transaction time, followed by calculation of the daily averages for each trading day during our study period. Finally, the annual averages are then calculated, using these daily averages.
The determinants of equity liquidity and
disclosure practices
In order to construct a system of simultaneous equations for our liquidity measure, as well as the S&P T&D ranking for the 3SLS and GMM estimations, we need to specify the liquidity measure and T&D final ranking models.
The determinants of the liquidity measure
It has been suggested in many of the prior cross-sectional studies on spreads (for ex-ample, Welker, 1995; Lin et al., 1995; Stoll, 2000; Van Ness et al., 2001; Brockman and Chung, 2003; Agrawal et al., 2004; and others) that any empirical analyses should control for a number of spread determinants, other than disclosure policy, with the closing price, daily dollar volume, return volatility, number of trades per day and market value being the most common determinants of spread adopted in these studies.
Stoll (2000), in particular, modelled the source of the spread, and found that the closing price, daily dollar volume, return vola-tility, number of trades per day and market value were all significantly related to the pro-portional quoted half-spread. Stoll found that these variables could explain over 65 per cent of the cross-sectional variance in the propor-tional quoted half-spread. Therefore, along with the T&D ranking, we follow Stoll (2000) to use the closing price of the stock (CLP), daily dollar volume (DOLVOL), return stan-dard deviation (RETSTD), number of trades (N) and market value (MKV) as our prelimi-nary candidates for control variables in the liquidity measures (i.e. the proportional quoted half-spread, the quoted half-spread, the effective spread, the relative effective spread and the information asymmetry com-ponent).
In accordance with the empirical evidence provided by Stoll (2000), as well as the other aforementioned studies, we predict that any increase in the dollar volume, the number of trades and the market value will lead to an increase in equity liquidity and a lowering of the spread. The return volatility of a stock reflects the risk of any price change in that stock; thus, we predict that higher return vola-tility will be associated with a higher spread.
The definitions of the control variables in the liquidity measures are described as follows: CLPi= the closing price average of all trading
days for firm i during the study period. DOLVOLi= the daily dollar volume average of
all trading days for firm i during the study period.
RETSTDi = the standard deviation of the daily
returns of stocks in firm i during the pre-vious year.
Ni= the average daily number of trades in firm
i during the study period.
MKVi= the average monthly market value of
firmi during the study period.
Furthermore, price acts as a control for the effect of discreteness, and is an additional proxy for risk, insofar as low price stocks tend to be riskier (Stoll, 2000). We therefore predict that price will be positively related to the quoted half-spread, the effective spread and the information asymmetry component, whilst being negatively related to the proportional quoted half-spread, and the relative effective spread, since the quote midpoint, the denomi-nator used to calculate these two measures, is highly correlated to the closing price.
The determinants of disclosure practice
The determinants of disclosure practice used in this study relate mainly to those of Lang and Lundholm (1993), Welker (1995) and Ho and Wong (2001). Lang and Lundholm (1993) found that both market-adjusted return and firm size were positively correlated to disclo-sure policy, which in turn had a negative asso-ciation with return standard deviation and the return-earnings correlation.
Following on from these findings, Welker (1995) used share price, security offering, market-adjusted return and the return stand-ard deviation as the determinants of disclosure practice. Ho and Wong (2001) subsequently went on to test a theoretical framework relat-ing four major corporate governance attributes to the extent of voluntary disclosure provided by firms listed on the Hong Kong stock market. Ho and Wong followed several of the prior works which had focused on investiga-tions into voluntary disclosure decisions, using firm size (Chow and Wong-Boren, 1987), assets-in-place (Hossain et al., 1994), financial leverage (Bradbury, 1992) and profitability and industry type (Meek et al., 1995) as the control variables in their empirical models.
Thus, following on from these studies, our preliminary candidates for control vari-ables in the disclosure practices of firms are: firm size (SIZE), return standard deviation (RETSTD), closing price (CLP), assets-in-place (AIP), financial leverage (LEV), profitability (PROFIT) and a dummy variable for industry type. The empirical findings of the aforemen-tioned studies suggest that firm size, price, assets-in-place and profitability are positively related to the disclosure practices of firms, and
that return volatility and financial leverage have a negative correlation with the quality of the firms’ disclosure. The control variables for disclosure practices which have not yet been defined are as follows:
SIZEi= the total assets of firm i at the end of
2002.
AIPi= the ratio of the net book value of fixed
assets to total assets for firm i at the end of 2002.
LEVi= the ratio of total debt to total equity for
firmi at the end of 2002.
PROFITi= the return on capital employed at
the end of 2002.
D1i= 1, when the firm’s S&P Industry Index
Code is between 700 and 719 (the Financials group), otherwise 0.
D2i= 1, when the firm’s S&P Industry Index
Code is between 900 and 921 (Information Technology group), otherwise 0.
Simultaneous equation model
We first calculate the variance inflation factors (VIFs) for the control variables of the liquidity measures and those of the disclosure practices of firms. The VIFs measure the extent to which multicollinearity exists in the selected explana-tory variables; any explanaexplana-tory variables with higher VIFs will have a more serious multicol-linearity problem and a greater likelihood of affecting the estimation regression results. Following calculation of the VIFs, we find that those of daily dollar volume (DOLVOL), market value (MKV) and daily number of trades (N) are greater than those of the other control variables.
By omitting any two of the variables, the VIFs of all the independent variables of the liquidity measures will be lower than 2, thereby indicating that the multicollinearity problem is solved. Since the OLS coefficient estimates of both market value and daily number of trades are less significant than those of daily dollar volume, and since the latter is used much more frequently in the microstructure literature than market value and daily number of trades, we omit these two variables, whilst retaining the daily dollar volume within the equity liquidity equation.
Thus, the control variables of our liquidity measure are now the closing price (CLP), daily dollar volume (DOLVOL) and the previous year’s return standard deviation (RETSTD). The VIFs of the predetermined control vari-ables of the disclosure practices of firms are all less than 2, which indicates that no serious multicollinearity problem exists in the selected control variables.
The second step is to filter out any in-adequate instrumental variables for the 3SLS and GMM instrumental variable estimations. Wooldridge (2002) indicated that a key condi-tion for instrumental variable estimacondi-tion was that once all the other exogenous variables in all equations had been netted out, the selected additional instruments for an endogenous variable must have some partial correlation.7
The results of the first-stage regression on all of the liquidity measures reveal that the three control variables, CLP, DOLVOL and RETSTD, have a partially strong correlation with our liquidity measures. For the S&P T&D final rankings, the results of the first-stage regres-sions reveal that only SIZE and AIP are par-tially correlated with the composite basis final rankings, and that SIZE, AIP and RETSTD are partially correlated with the annual basis final rankings. Therefore, after excluding any in-adequate instrumental variables from the equations, our simultaneous equation systems can be constructed as follows:
Liquidity CFR lnDOLVOL CLP RETSTD 10 11 12 13 14 , i i i i i = + + + + + α α α α α ε1 ii i i i i i CFR Liquidity lnSIZE AIP 20 21 22 23 2, = + + + + α α α α ε (5)
Liquidity AFR lnDOLVOL
CLP RETSTD 10 11 12 13 14 , i i i i i = + + + + + β β β β β u1 ii i i i i i
AFR Liquidity lnSIZE
AIP RETSTD 20 21 22 23 24 , = + + + + + β β β β β u2 ii (6)
where lnDOLVOLi and lnSIZEi are the
loga-rithms of DOLVOLi and SIZEi; Liquidityi
represents the liquidity measure, and can be replaced by any of our liquidity measures, the effective spread (ESP) or the information asymmetry component (INF).8
Empirical results and analysis
Summary statistics and correlations
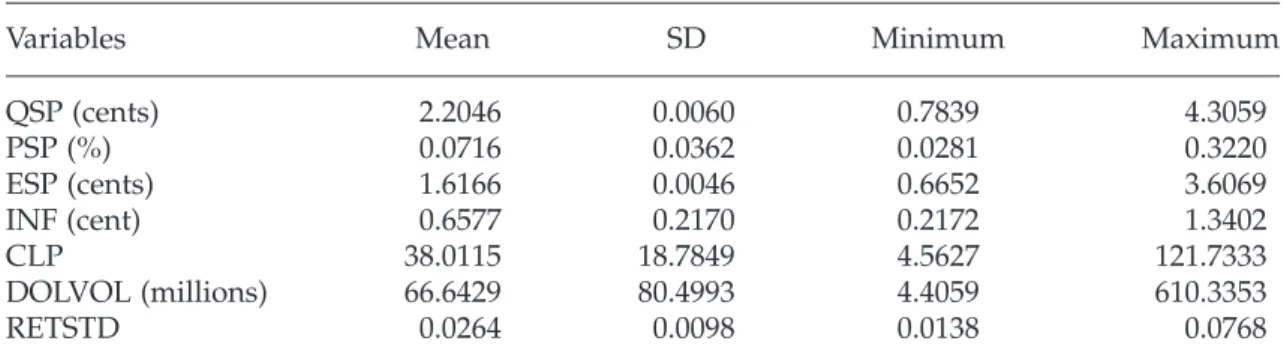
Table 1 presents the descriptive statistics of our five liquidity measures and their control variables. Our sample period runs from 1 January to 31 December 2002, giving a total of 252 trading days. The mean of the quoted half-spread (QSP) is 2.2046 cents per share, with a range of about 3.522 cents. The mean of the proportional quoted half-spread (PSP) is 0.0716 per cent, ranging between 0.0281 per cent and 0.3220 per cent. The average effective spread (ESP) is 1.6166 cents, with a range of about 2.9434 cents, and represents approxi-mately 73 per cent of the quoted half-spread.
The finding that the average ESP is less than the average PSP is consistent with the
argument of Lin et al. (1995).9 The INF of
the effective spread has an average value of 0.6577 cents, ranging between 0.2172 cents and 1.3402 cents; the CLP for our sample is approximately US$38.01, with a range of between US$4.56 and US$121.73; DOLVOL has a mean of US$66.64 million, with a sample range between US$4.41 million and US$610.33 million; and RETSTD has an average value of about 0.0264, with the sample ranging between 0.0138 and 0.0768.
The Pearson correlation coefficients of our five liquidity measures, and their control variables, are presented in Table 2. One issue which immediately draws our attention is the
fact that INF, QSP and ESP all have a strongly positive correlation, implying that the higher asymmetric information costs induce higher equity spread, given that order processing costs are largely fixed.
The descriptive statistics of the S&P T&D final rankings, and their control variables, are presented in Table 3. The mean of the compos-ite basis T&D final rankings (CFR) is 7.55, with a range of between 7 and 9, whilst the mean of the annual basis T&D final rankings (AFR) is 4.78, with a range of between 1 and 8. Taking note of the difference between these two rank-ings, AFR has a lower mean but greater range, whilst CFR has a higher mean but smaller
Table 1: Descriptive statistics of the four selected liquidity measures and their control variables
Variables Mean SD Minimum Maximum
QSP (cents) 2.2046 0.0060 0.7839 4.3059 PSP (%) 0.0716 0.0362 0.0281 0.3220 ESP (cents) 1.6166 0.0046 0.6652 3.6069 INF (cent) 0.6577 0.2170 0.2172 1.3402 CLP 38.0115 18.7849 4.5627 121.7333 DOLVOL (millions) 66.6429 80.4993 4.4059 610.3353 RETSTD 0.0264 0.0098 0.0138 0.0768
The sample comprises of a total of 341 S&P 500 index constituent stocks listed on the NYSE between 1 January and 31 December 2002.
QSP = the quoted half-spread; PSP = the proportional quoted half-spread; ESP = the effective spread; INF = the dollar value of the information asymmetry component of the effective spread; CLP = the closing price; DOLVOL = the daily dollar volume; and RETSTD = the return standard deviation in the previous year.
Table 2: Pearson correlation coefficients of the four selected liquidity measures and their control variables
Variables QSP PSP ESP INF CLP DOLVOL RETSTD
QSP 1 PSP -0.4015** (<0.0001) 1 ESP 0.9694** (<0.0001) (<0.0001)-0.4732** 1 INF 0.9668** (<0.0001) (<0.0001)-0.4278** (<0.0001)0.9441** 1 CLP 0.8107** (<0.0001) (<0.0001)-0.6738** (<0.0001)0.8834** (<0.0001)0.8010** 1 DOLVOL -0.0281 (0.6045) -0.3437** (<0.0001) (0.0141)0.1328** -0.09032** (0.0959) 0.3494** (<0.0001) 1 RETSTD -0.3301** (<0.0001) (<0.0001)0.6798** (<0.0001)-0.3123** (<0.0001)-0.3643** (<0.0001)-0.4590** -0.0107(0.8445) 1
The sample comprises of a total of 341 S&P 500 index constituent stocks listed on the NYSE between 1 January and 31 December 2002.
*Indicates that the coefficient estimate is statistically significant at the 0.05 level; **indicates that the coefficient estimate is statistically significant at the 0.01 level.
range. This characteristic is consistent with the argument of Patel and Dallas (2002), who sug-gested that the annual basis rankings, which focus only on a firm’s annual reports, could be regarded as the extent of a firm’s voluntary disclosure; conversely, the composite basis rankings, which include annual reports, 10-Ks and other proxy statements, may be regarded as regulatory disclosure practices. Thus, as a result of the strict laws on investor protection in the US, as well as the stringent disclosure regulations, the firms reveal consistently higher rankings on a composite basis, along with smaller differences between the firms’ composite basis rankings, than in their annual basis rankings.
Table 4 presents the Pearson correlation coefficients of the S&P T&D final rankings, and their control variables. SIZE and AIP reveal positive correlations to both composite and annual basis T&D final rankings, although the positive correlation between SIZE and these two rankings is insignificant. RETSTD has a significantly negative correlation with the annual basis T&D final rankings, but has an insignificantly negative correlation with the composite basis T&D final rankings. This finding is consistent with the results of the first-stage regression.
We argue that the reason that return vola-tility presents greater explanatory power – as regards the annual basis final rankings
vis-à-Table 3: Descriptive statistics of the two S&P T&D final rankings and their control variables
Variables Mean Std Dev Minimum Maximum
CFR 7.5455 0.5161 7.0000 9.0000
AFR 4.7771 0.9986 1.0000 8.0000
SIZE (millions) 39,391 107,730 669 887,515
AIP (%) 30.5985 23.2217 0.0000 93.2126
RETSTD 0.0264 0.0098 0.0138 0.0768
The sample comprises a total of 341 S&P 500 index constituent stocks listed on the NYSE between 1 January and 31 December 2002.
CFR = the composite basis S&P T&D final ranking; AFR = the annual basis S&P T&D final ranking; SIZE = the firm’s total asset at the end of 2002; AIP = the assets-in-place defined as the book value of fix asset divided by total asset; and RETSTD = the return standard deviation in prior year.
Table 4: Pearson correlation coefficients of the two S&P T&D final rankings and their control variables
Variables CFR AFR SIZE AIP RETSTD
CFR 1 AFR 0.2880** (<0.0001) 1 SIZE 0.0329 (0.5444) 0.0565 (0.2979) 1 AIP 0.1841** (0.0006) 0.1423** (0.0085) -0.2635** (<0.0001) 1 RETSTD -0.0680 (0.2102) -0.1700** (0.0016) -0.0494 (0.3631) 0.0332 (0.5407) 1
The sample comprises of a total of 341 S&P 500 index constituent stocks listed on the NYSE between 1 January and 31 December 2002.
CFR = the composite basis S&P T&D final ranking; AFR = the annual basis S&P T&D final ranking; SIZE = the firm’s total asset at the end of 2002; AIP = the assets-in-place defined as the book value of fix asset divided by total asset; and RETSTD = the return standard deviation in prior year.
*Indicates that the coefficient estimate is statistically significant at the 0.05 level; **indicates that the coeffi-cient estimate is statistically significant at the 0.01 level.
vis the composite basis final rankings – is that the annual basis final rankings are much more closely related than the composite basis final rankings to the true extent of a firm’s volun-tary disclosure practices.
OLS, 3SLS and GMM estimation results
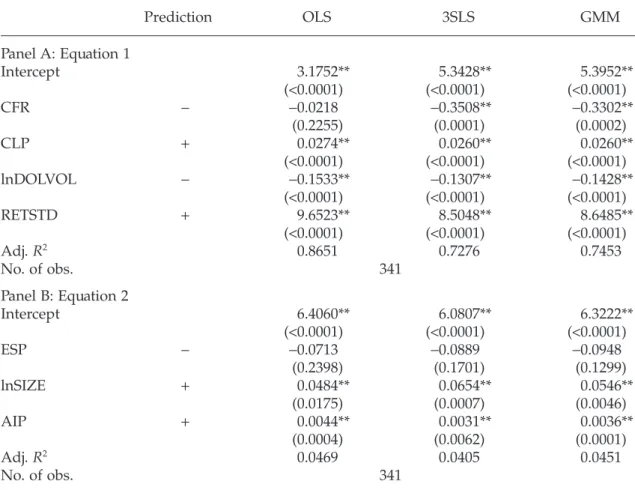
This section presents the results of the effective spread and the two S&P T&D final rankings, beginning with an examination of the relation-ship between the effective spread and the S&P T&D rankings by applying the 3SLS and GMM estimation methods.10The estimation results of
ESP and the two S&P T&D final rankings are reported in Tables 5 and 6, both of which show that the empirical results are similar to those of QSP and the two S&P T&D final rankings.11
CFR and AFR reveal significantly negative relationships with effective spread under the 3SLS and GMM estimations of the first equa-tion, with the results once again supporting our hypothesis that the stocks of firms with higher T&D rankings have relatively lower effective spreads. This finding is consistent with the results of Heflin et al. (2005), who investigated the relationship between the FAF scores and the effective spreads.
We also find that the negative relationships between ESP and the two final rankings are not statistically significant in the first equation under the OLS estimation. Moreover, the simultaneous estimation of the second equa-tion shows that ESP has insignificant relaequa-tion- relation-ships with the two final rankings, indicating that there is little probability of any
simul-Table 5: OLS, 3SLS and GMM estimation results of the effective spread and composite basis S&P T&D final ranking Prediction OLS 3SLS GMM Panel A: Equation 1 Intercept 3.1752** (<0.0001) (<0.0001)5.3428** (<0.0001)5.3952** CFR - -0.0218 (0.2255) -0.3508** (0.0001) -0.3302** (0.0002) CLP + 0.0274** (<0.0001) (<0.0001)0.0260** (<0.0001)0.0260** lnDOLVOL - -0.1533** (<0.0001) (<0.0001)-0.1307** (<0.0001)-0.1428** RETSTD + 9.6523** (<0.0001) (<0.0001)8.5048** (<0.0001)8.6485** Adj. R2 0.8651 0.7276 0.7453 No. of obs. 341 Panel B: Equation 2 Intercept 6.4060** (<0.0001) (<0.0001)6.0807** (<0.0001)6.3222** ESP - -0.0713 (0.2398) -0.0889 (0.1701) -0.0948 (0.1299) lnSIZE + 0.0484** (0.0175) 0.0654** (0.0007) 0.0546** (0.0046) AIP + 0.0044** (0.0004) 0.0031** (0.0062) 0.0036** (0.0001) Adj. R2 0.0469 0.0405 0.0451 No. of obs. 341
The empirical results show that under 3SLS and GMM estimations, in the first equation, the composite basis T&D ranking is significantly and negatively correlated with the effective spread. In the second equation, the effective spread does not reveal any significant negative correlation to the composite basis T&D ranking, indicating that simultaneity may not exist in the determination of spread and disclosure practice.
*Indicates that the coefficient estimate is statistically significant at the 0.05 level; **indicates that the coeffi-cient estimate is statistically significant at the 0.01 level.
taneity existing in the determination of ESP and disclosure practices. All of the ESP con-trol variables present significant coefficient estimates, with signs that are consistent with our expectations. The signs of the coefficient estimates of the CFR and AFR instruments are as predicted, with each of these being sta-tistically significant at common confidence levels.
Information asymmetry cost
estimation results
The ESP information asymmetry component represents the asymmetric information costs faced by market liquidity providers when
trading with informed traders, and therefore reflects the market’s perception of the firm’s asymmetric information risk. Furthermore, since the S&P T&D rankings measure the extent of a firm’s corporate governance, we predict that they will be directly related to the firm’s asymmetric information risk. In this section, therefore, we examine the relationship between the dollar value of the information asymmetry component and the S&P T&D rankings by applying 3SLS and GMM esti-mations to determine whether better cor-porate governance is associated with better equity liquidity.
Table 7 presents the simultaneous esti-mation results of the dollar value of INF and
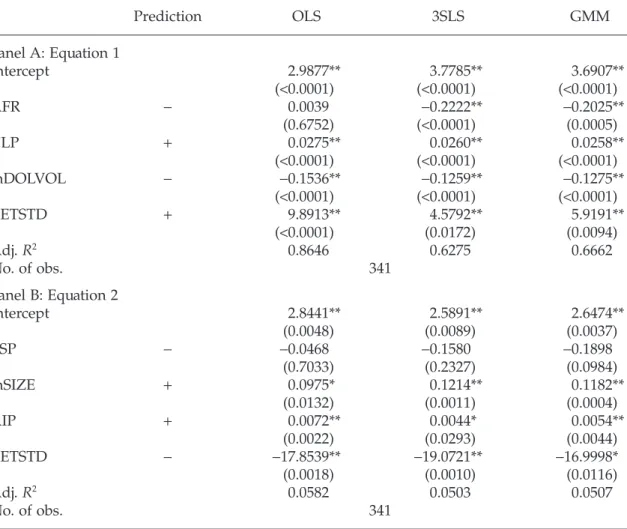
Table 6: OLS, 3SLS and GMM estimation results of the effective spread and annual basis S&P T&D final ranking Prediction OLS 3SLS GMM Panel A: Equation 1 Intercept 2.9877** (<0.0001) (<0.0001)3.7785** (<0.0001)3.6907** AFR - 0.0039 (0.6752) -0.2222** (<0.0001) -0.2025**(0.0005) CLP + 0.0275** (<0.0001) (<0.0001)0.0260** (<0.0001)0.0258** lnDOLVOL - -0.1536** (<0.0001) (<0.0001)-0.1259** (<0.0001)-0.1275** RETSTD + 9.8913** (<0.0001) (0.0172)4.5792** 5.9191** (0.0094) Adj. R2 0.8646 0.6275 0.6662 No. of obs. 341 Panel B: Equation 2 Intercept 2.8441** (0.0048) 2.5891** (0.0089) 2.6474** (0.0037) ESP - -0.0468 (0.7033) -0.1580 (0.2327) -0.1898 (0.0984) lnSIZE + 0.0975* (0.0132) 0.1214** (0.0011) 0.1182** (0.0004) AIP + 0.0072** (0.0022) 0.0044* (0.0293) 0.0054** (0.0044) RETSTD - -17.8539** (0.0018) -19.0721** (0.0010) -16.9998* (0.0116) Adj. R2 0.0582 0.0503 0.0507 No. of obs. 341
The empirical results show that under 3SLS and GMM estimations, in the first equation, the annual basis T&D ranking is significantly and negatively correlated with the effective spread. In the second equation, the effective spread does not reveal any significant negative correlation to the annual basis T&D ranking, indicating that simultaneity may not exist in the determination of spread and disclosure practice.
*Indicates that the coefficient estimate is statistically significant at the 0.05 level; **indicates that the coeffi-cient estimate is statistically significant at the 0.01 level.
CFR, whilst Table 8 presents the results of the dollar value of INF and AFR.
We find that both CFR and AFR have sig-nificantly negative relationships with INF in the first equation under both 3SLS and GMM estimations, but that under the OLS esti-mation, this negative partial relationship has no statistical significance. Furthermore, under all three estimation methods, INF does not reveal any significant relationship with either CFR or AFR in the second equation, indicat-ing once again that there is little probability of any simultaneity existing within the deter-mination of INF, CFR or AFR. It should be noted that this result is more robust than that reported in the Brown and Hillegeist
(2006) study, within which the wrong sign was produced in the simultaneous equations estimation.
The significantly negative relationships between INF, CFR and AFR in the first equa-tion, under both the 3SLS and GMM esti-mations, again provides support for our hypothesis that firms with better disclosure practices will demonstrate better corporate governance and that their stocks will have lower information asymmetry. Since the T&D rankings are proxy variables for corporate governance, there may be some measurement error in the two S&P T&D final rankings with regard to the extent of firms’ disclosure prac-tices and information asymmetry, which is the
Table 7: OLS, 3SLS and GMM estimation results of the information asymmetry component and composite basis S&P T&D final ranking
Prediction OLS 3SLS GMM Panel A: Equation 1 Intercept 2.3224** (<0.0001) (<0.0001)3.6756** (<0.0001)3.6636** CFR - -0.0040 (0.6338) -0.2119** (<0.0001) (<0.0001)-0.1964** CLP + 0.0130** (<0.0001) (<0.0001)0.0123** (<0.0001)0.0121** lnDOLVOL - -0.1266** (<0.0001) (<0.0001)-0.1119** (<0.0001)-0.1175** RETSTD + 3.5719** (<0.0001) (<0.0001)2.8859** (<0.0001)2.8957** Adj. R2 0.8692 0.6215 0.6592 No. of obs. 341 Panel B: Equation 2 Intercept 6.2964** (<0.0001) (<0.0001)5.8641** (<0.0001)6.0649** INF - -0.0378 (0.7746) -0.0984 (0.4862) -0.1376 (0.3174) lnSIZE + 0.0490* (0.0197) 0.0718** (0.0003) 0.0633** (0.0013) AIP + 0.0045** (0.0002) 0.0027* (0.0145) 0.0034** (0.0003) Adj. R2 0.0432 0.0297 0.0364 No. of obs. 341
The empirical results show that under 3SLS and GMM estimations, in the first equation, the composite basis T&D ranking is significantly and negatively correlated with the information asymmetry component. In the second equation, the information asymmetry component does not reveal any significant negative correlation to the composite basis T&D ranking, indicating that simultaneity may not exist in the determination of spread and disclosure practice.
*Indicates that the coefficient estimate is statistically significant at the 0.05 level; **indicates that the coeffi-cient estimate is statistically significant at the 0.01 level.
likely cause of the inconsistent OLS estimation results in the first equation of the simultaneous system.
Conclusions
Poor disclosure practice within a firm is accompanied by poor corporate governance and higher levels of asymmetric information risk; as a result, liquidity providers will tend to broaden the equity spread of those firms exhibiting poor corporate governance, since such price-protection action will have the effect of reducing the market liquidity of the stock. In this study, we have used S&P T&D
rankings as a proxy variable for corporate gov-ernance, subsequently employing this in our examination of whether the stocks of those firms with higher rankings have better market liquidity.
The empirical evidence supports our hypothesis that the stocks of those companies with better corporate governance have better market liquidity, with both the composite and annual basis T&D final rankings having sig-nificantly negative partial effects on the quoted half-spread and the effective spread. We also find that the two T&D final rankings have a significant and negative relationship with the information asymmetry component of the effective spread, which implies that better
dis-Table 8: OLS, 3SLS and GMM estimation results of the information asymmetry component and annual basis S&P T&D final ranking
Prediction OLS 3SLS GMM Panel A: Equation 1 Intercept 2.2846** (<0.0001) (<0.0001)2.7353** (<.0001)2.7148** AFR - 0.0014 (0.7462) -0.1329** (<0.0001) (<0.0001)-0.1253** CLP + 0.0130** (<0.0001) (<0.0001)0.0123** (<0.0001)0.0119** lnDOLVOL - -0.1267** (<0.0001) (<0.0001)-0.1098** (<0.0001)-0.1106** RETSTD + 3.6304** (<0.0001) (0.5280)0.6446 1.1547 (0.3692) Adj. R2 0.8692 0.4919 0.5333 No. of obs. 341 Panel B: Equation 2 Intercept 2.6666* (0.0136) 2.3048* (0.0303) 2.6203** (0.0076) INF - 0.0212 (0.9385) -0.1993 (0.5049) -0.3552 (0.1706) lnSIZE + 0.1000* (0.0144) 0.1283** (0.0009) 0.1165** (0.0008) AIP + 0.0074** (0.0017) 0.0037 (0.0576) 0.0046** (0.0090) RETSTD - -16.9902** (0.0039) -18.2533** (0.0023) -16.5135* (0.0165) Adj. R2 0.0578 0.0457 0.0460 No. of obs. 341
The empirical results show that under 3SLS and GMM estimations, in the first equation, the annual basis T&D ranking is significantly and negatively correlated with the information asymmetry component. In the second equation, the information asymmetry component does not reveal any significant negative correlation to the annual basis T&D ranking, indicating that simultaneity may not exist in the determination of spread and disclosure practice.
*Indicates that the coefficient estimate is statistically significant at the 0.05 level; **indicates that the coeffi-cient estimate is statistically significant at the 0.01 level.
closure practices can reduce the asymmetric information risk perceived by the market, and thereby lower the spread of the equity by reducing the asymmetric information costs demanded by liquidity providers as a means of compensating for any potential losses arising from informed trading activities.
Furthermore, we find that the T&D rankings have a significant and negative relationship with the information asymmetry component, implying that poorer disclosure practices will lead to lower equity liquidity, as a result of the increased asymmetric information costs demanded by liquidity providers, essentially as a result of order processing costs being largely fixed.
Finally, the results of our study have some important implications for corporate gover-nance; we suggest that managers should endeavour to conform to the various disclo-sure regulations and investor protection codes by disclosing, to the best of their ability, all the information they possess on the firm. When a firm is able to provide better levels of transpar-ency and disclosure, the information asym-metry and agency problems will be effectively mitigated, and the quality of the firm’s corpo-rate governance will be improved immensely. Consequently, the firm will have a smaller information asymmetry component, along with a smaller effective spread and quoted spread, which implies that its stocks will have better market liquidity.
Notes
1. The T&D study focused on several issues, such as which companies were providing the most extensive disclosure in their basic corporate filings, and which companies had disclosed above and beyond what the law requires. See Patel and Dallas (2002) for a detailed description.
2. See La Porta et al. (1997, 1998, 1999, 2000), Conyon and Peck (1998), Himmelberg et al. (1999), Vafeas (1999), Johnson et al. (2000), Mitton (2002), Gompers et al. (2003), Alves and Mendes (2004), Brown and Caylor (2004), Klapper and Love (2004), Lee and Yeh (2004), Cremers and Nair (2005) and Nelson (2005). A theoretical model of com-parative corporate governance is also pro-vided by John and Kedia (2003).
3. Patel and Dallas (2002) argued that whilst transparency and disclosure were key components of corporate governance, T&D rankings were not proxies for corporate governance; nevertheless, they still found that the rankings revealed some interesting relationships between transparency and
disclosure and a firm’s market risk, capi-talisation and price to book ratio.
4. Our sample equity data comprised of 301,845,521 intraday quotes, and 146,630,782 transactions, obtained from the TAQ database. We use these data to calculate and estimate our measures of equity liquidity and the information asym-metry component.
5. After identifying the prevailing quotes for each trade and deleting any transaction data without prevailing quotes, we were left with a total of 127,217,081 transactions with prevailing quotes for use in this study.
6. Following Lin et al. (1995) and Van Ness et
al. (2001), the logarithms of the transaction
price and the quote midpoint are used to yield a continuously compounded rate of return for the dependent variable, and a relative spread for the independent vari-able. This transformation can generate estimates of the information asymmetry components as a percentage of the effec-tive spread, and thereby reduce the problem of price discreteness.
7. See Wooldridge (2002), Chapters 5 and 6. 8. The values of QSPi, ESPi and INFi are so
small that the estimated coefficients of the control variables of these liquidity mea-sures are also very small; we therefore multiply the measures by 100, and in con-sequence, “cents” becomes the unit of measurement.
9. Lin et al. (1995) argued that demanders of immediacy services rarely receive prices which were less favourable than the pre-vailing quotes on the NYSE.
10. Having carried out the Hausman test for endogeneity of AFR, the results confirm that AFR is not exogenous. For the purpose of saving space, these results are omitted; they are, however, available upon request.
11. The analysis was also carried out for the proportional quoted half spread and quoted half spread. Since the results are quite similar, they are omitted for the purpose of saving space.
References
Agrawal, V., Kothare, M., Rao, R. K. S. and Wadhwa, P. (2004) Bid-ask Spreads, Informed Investors and Firm’s Financial Condition, Quarterly Review of
Economics and Finance, 44, 58–76.
Alves, C. and Mendes, V. (2004) Corporate Gover-nance Policy and Company Performance: The Portuguese Case, Corporate Governance: An
Inter-national Review, 12, 290–301.
Barclay, M. J., Christie, W. G., Harris, J. H., Kandel, E. and Schultz, P. H. (1999) Effects of Market
Reform on the Trading Costs and Depths of NASDAQ Stocks, Journal of Finance, 54, 1–34. Botosan, C. A. (1997) Disclosure Level and the Cost
of Equity Capital, Accounting Review, 72, 323–350. Bradbury, M. (1992) Voluntary Disclosure of Finan-cial Segment Data, Accounting and Finance, 32, 15–26.
Brockman, P. and Chung, D. Y. (2003) Investor Pro-tection and Firm Liquidity, Journal of Finance, 58, 921–937.
Brown, L. D. and Caylor, M. L. (2004) Corporate Governance and Firm Performance. Working Paper. Georgia State University, Atlanta.
Brown, S. and Hillegeist, S. A. (2006) How Disclo-sure Quality Affects the Long-run Level of Infor-mation Asymmetry. Working Paper. Georgia State University, Atlanta.
Cheng, A. C. S., Collins, D. and Huang, H. (2003) The Effect of the S&P T&D Rankings on Market Beta, Abnormal Returns and Earnings Response Coefficients in the Period Surrounding the Report Release Date. Working Paper. C.T. Bauer College of Business, University of Houston, Texas.
Chow, C. and Wong-Boren, A. (1987) Voluntary Financial Disclosure by Mexican Corporations,
Accounting Review, 62, 533–541.
Conyon, M. J. and Peck, S. I. (1998) Board Size and Corporate Performance: Evidence from European Countries, European Journal of Finance, 4, 291–304. Cremers, K. J. M and Nair, V. B. (2005) Governance Mechanisms and Equity Prices, Journal of Finance, 60, 2859–2894.
Demsetz, H. (1968) The Cost of Transacting,
Quar-terly Journal of Economics, 82, 33–53.
Durnev, A. and Kim, E. (2005) To Steal or Not to Steal: Firm Attributes, Legal Environment and Valuation, Journal of Finance, 60, 1461–1493. Dye, R. A. (1985) Disclosure of Non-proprietary
Information, Journal of Accounting Research, 23, 123–145.
Gompers, P. A., Ishii, J. L. and Metrick, A. (2003) Corporate Governance and Equity Prices,
Quar-terly Journal of Economics, 118, 107–155.
Hauswald, R. and Marquez, R. (2006) Governance Mechanisms and Corporate Disclosure. Working Paper. University of Maryland.
Healy, P. M., Hutton, A. P. and Palepu, K. G. (1999) Stock Performance and Intermediation Changes Surrounding Sustained Increases in Disclosure,
Contemporary Accounting Research, 16, 485–520.
Heflin, F. L., Shaw, K. W. and Wild, J. J. (2005) Dis-closure Policy and Market Liquidity: Impact of Depth Quotes and Order Sizes, Contemporary
Accounting Research, 22, 829–865.
Himmelberg, C. P., Hubbard, R. G. and Palia, D. (1999) Understanding the Determinants of Mana-gerial Ownership and the Link between Owner-ship and Performance, Journal of Financial
Economics, 53, 353–384.
Ho, S. S. M. and Wong, K. S. (2001) A Study of the Relationship between Corporate Governance Structures and the Extent of Voluntary Disclo-sure, Journal of International Accounting, Auditing
and Taxation, 10, 139–156.
Hossain, M., Tan, L. M. and Adams, M. (1994) Vol-untary Disclosure in an Emerging Capital
Market: Some Empirical Evidence from Com-panies Listed on the KL Stock Exchange,
Inter-national Journal of Accounting, 29, 334–351.
Huang, R. D. and Stoll, H. R. (1996) Dealer versus Auction Markets: A Paired Comparison of Execu-tion Costs on the NASDAQ and the NYSE,
Journal of Financial Economics, 41, 313–357.
John, K. and Kedia, S. (2003) Design of Corporate Governance: Role of Ownership Structure, Takeovers, and Bank Debt. Working Paper. New York: Stern School of Business, New York University.
Johnson, S., Boone, P., Breachand, A. and Friedman, E. (2000) Corporate Governance in the Asian Financial Crisis, Journal of Financial Economics, 58, 141–186.
Klapper, L. F. and Love, I. (2004) Corporate Gover-nance, Investor Protection and Performance in Emerging Markets, Journal of Corporate Finance, 10, 703–728.
La Porta, R., Lopez-de-Silanes, F., Shleifer, A. and Vishny, R. (1997) Legal Determinants of External Finance, Journal of Finance, 52, 1131–1150. La Porta, R., Lopez-de-Silanes, F., Shleifer, A. and
Vishny, R. (1998) Law and Finance, Journal of
Political Economy, 106, 1115–1155.
La Porta, R., Lopez-de-Silanes, F. and Shleifer, A. (1999) Corporate Ownership Around the World,
Journal of Finance, 54, 471–517.
La Porta, R., Lopez-de-Silanes, F., Shleifer, A. and Vishny, R. (2000) Investor Protection and Corpo-rate Governance, Journal of Financial Economics, 58, 3–27.
Lang, M. and Lundholm, R. (1993) Cross-sectional Determinants of Analyst Ratings of Corporate Disclosures, Journal of Accounting Research, 31, 246–271.
Lang, M. and Lundholm, R. (1999) Corporate Dis-closure Policy and Analyst Behavior, Accounting
Review, 71, 467–493.
Lee, T. S. and Yeh, Y. H. (2004) Corporate Gover-nance and Financial Distress: Evidence from Taiwan, Corporate Governance: An International
Review, 12, 378–388.
Leuz, C., Nanda, D. and Wysocki, P. D. (2003) Earn-ings Management and Investor Protection: An International Comparison, Journal of Financial
Eco-nomics, 69, 505–527.
Lin, J. C., Sanger, G. C. and Booth, G. (1995) Trade Size and Components of the Bid-Ask Spread,
Review of Financial Studies, 8, 1153–1183.
Lowenstein, L. (1996) Financial Transparency and Corporate Governance, Columbia Law Review, 96, 1335–1346.
Mallin, C. (2002) Editorial: The Relationship between Corporate Governance, Transparency and Financial Disclosure, Corporate Governance:
An International Review, 10, 253–255.
Meek, G. K., Robert, C. B. and Gray, S. J. (1995) Factors Influencing Voluntary Annual Report Disclosures by US, UK and Continental Europe Multinational Corporations, Journal of
Inter-national Business Studies, 26, 555–572.
Mitton, T. (2002) A Cross-firm Analysis of the Impact of Corporate Governance on the East Asian Financial Crisis, Journal of Financial
Nelson, J. (2005) Corporate Governance Practices, CEO Characteristics and Firm Performance,
Journal of Corporate Finance, 11, 197–228.
Patel, S. A. and Dallas, G. (2002) Transparency and
Disclosure: Overview of Methodology and Study Results. United States: Standard & Poor’s
Euro-pean Corporate Governance Institute, October 2002.
Stoll, H. R. (1978a) The Supply of Dealer Services in Securities Markets, Journal of Finance, 33, 1122– 1151.
Stoll, H. R. (1978b) The Pricing of Security Dealer Services: An Empirical Study of NASDAQ Stocks, Journal of Finance, 33, 1153–1172.
Stoll, H. R. (2000) Friction, Journal of Finance, 55, 1479–1514.
Vafeas, N. (1999) Board Meeting Frequency and Firm Performance, Journal of Financial Economics, 53, 113–142.
Van Ness, B. F., Van Ness, R. A. and Warr, R. S. (2001) How Well do Adverse Selection Compo-nents Measure Adverse Selection? Financial
Management, 30, 77–98.
Welker, M. (1995) Disclosure Policy, Infor-mation Asymmetry and Liquidity in Equity Markets, Contemporary Accounting Research, 11, 801–827.
Wooldridge, J. M. (2002) Econometric Analysis of
Cross Section and Panel Data. Cambridge, MA:
MIT Press.
Wei-Peng Chen is a PhD candidate at the Department of Management Science at the National Chiao Tung University, Taiwan. Prior to his academic career, he was a financial engi-neer at a financial consulting company in
Taiwan in charge of risk management system for banks.
Huimin Chungis Professor of Finance at the National Chiao Tung University, Taiwan. He holds a PhD from Michigan State University. Dr. Chung’s research is in the areas of Corpo-rate Finance and Financial Econometrics. He has published related research on corporate governance, investor protection and equity liquidity. More recently his research has dealt with earnings management, market micro-structure and option pricing.
Chengfew Leeis a Distinguished Professor of Finance at Rutgers University. He is also a vis-iting Chair Professor of Finance at the National Chiao Tung University, Taiwan. Prof. Lee is the editor of Review of Quantitative Finance and Accounting and the Review of Pacific Basin Financial Markets and Policies. In the past thirty-three years, Prof. Lee has written numerous textbooks. Prof. Lee has also pub-lished more than 170 articles in more than twenty different academic journals. Prof. Lee has been ranked the most published finance professor worldwide during 1953–2002. Most recently, he has edited book entitled “Encyclo-pedia of Finance” with Prof. Alice C. Lee. Wei-Li Liaois with the Graduate Institute of Finance at the National Chiao Tung University, Taiwan. He received the SinoPac Bank Hold-ings Company outstanding thesis award in 2005.