Acoustic Realigment of Nematic Liquid Crystals
by Guided Waves
Yu-Ching Lee, Wun-Bin Shih, Yu-Wei Su, Ching-Chung Yin Department of Mechanical Engineering
National Chiao Tung University Hsinchu 300, Taiwan, Republic of China
E-mail: [email protected] Abstract- This paper presents an experimental evidence to
correlate the acousto-optic effect of nematic liquid crystals to modal excitations of guided acoustic waves. The optic axes of liquid crystal molecules in a cell can be tilted by ultrasound at oblique incidence. The cell filled with homeotropically aligned liquid crystal material, 5CB, is fully immersed in a water tank situated between two crossed polarizers. Multi-modal guided acoustic waves have been excited in cell by changing the angle of incidence and driving frequency. The liquid crystal material sandwiched between two glass plates is regarded as a Newtonian fluid and modeled to be an isotropic hypothetical solid. The phase velocity dispersion curves and associated modal strains within the liquid crystal cell are determined numerically. Comparison between measured data and prediction reveals that guided acoustic waves have influence on the acousto-optic response of liquid crystals rather than bulk acoustic waves. Simulated results show that homeotropically and homogeneously aligned liquid crystals can be affected by symmetric and antisymmetric modes, respectively.
Keywords- nematic liquid crystals, acoustic realignment, guided acoustic waves
I. INTRODUCTION
Orientation of nematic liquid crystals (NLC) can be altered by electric and magnetic field. It has long been recognized that sound is also able to interact with the orientations of NLCs. The realignment, in consequence, leads to variations in the optical intensity transmitted through a LC cell. The acousto-optic effect has been studied for nearly four decades. Though a number of researches including theoretical models and experimental work were presented, the physical mechanism of realignment by ultrasound is not clear. Acoustic realignment has not been practically utilized for industrial applications such as flat panel display.
Three kinds of experimental setups have been proposed to investigate the acousto-optic effect of liquid crystals in the past. Bertolotti et al [1] and Scripaipan et al [2] adopted the resonant specimens which were made of a parallel-glass-mirror cell filled with NLC. A standing acoustic wave was induced in the cell by a piezoelectric element attached on back surface of the mirror. The acousto-optic effect can be observed from variations in the optical intensity normally reflected from the mirror. In the second experimental setup, the liquid crystal cell is immersed in water and obliquely insonified by an acoustic
beam [3]-[4]. The orientational order of the liquid crystal molecules was disturbed by the impinging ultrasonic waves. The acousto-optic response can be measured from the optical intensity transmitted through the cell. Specimens in the third experiments were excited by surface acoustic waves generated by an interdigital transducer attached on the cell [5]-[6]. The experiment can be carried out in air. The acousto-optic response including both variations in the optical transmission and acoustic streamlines was explored.
The second experimental setup has received considerable attentions in recent years [7]-[10] although it must be carried out in water. This setup is similar to the leaky Lamb wave (LLW) experiment based on oblique insonification of a plate-like specimen immersed in water. The LLW technique was developed and used in ultrasonic nondestructive evaluation (NDE) for flaw detection and material characterization in a variety of materials, for instance, fiber-reinforced composite laminates [11]. The incident acoustic beam may be a train of tone-burst signals with a specific center frequency, or a continuous wave (CW) of single frequency. Multi-modal dispersive guided waves are induced in the specimen at a finite number of specific frequencies of excitation.
The guided waves propagate along the specimen and leak energy into the surrounding fluid. The leaky waves combine with the specularly reflected waves to form nulls in the amplitude spectra of the reflected signal at the modal frequencies of the guided waves. The nulls in reflected amplitude spectra are associated with the excitation of leaky guided waves in the specimen. In our experiment, a LLW setup as shown in Fig. 1 is used to provide a convenient means to generate guided acoustic waves for realignment of NLCs in the cell. It can assure that the acousto-optic effect is induced at modal frequencies of the guided waves.
In general, the interaction between sound waves and liquid crystals is quite complex. Up to the present, it hasn’t been fully understood the interaction. The liquid crystal cells are usually regarded as wave plates made of the materials with birefringence. The intensity of transmitted optic beam through a wave plate is given by
¸ ¹ · ¨ © §Γ ψ = 2 sin ) 2 ( sin 2 1 2 2 o I I (1)
where the angle
ψ
indicates the azimuth angle measured fromFigure 1. Schematic diagram of investigation on acousto-optic response of liquid crystal cell to leaky guided acoustic waves.
the center line of passing light. The phase retardation Γ is given by λ − π = Γ 2 (ne no)d (2)
in which the difference between two principal indices of refraction ne− is a measure of the birefringence, d indicates no
the thickness of liquid crystal layer. The phase retardation caused by tilts of liquid crystals can be determined from (1).
II. EXPERIMENTS AND RESULTS
The liquid crystal specimen adopted in experiment was made of a parallel-glass plate cell with 65 µm thick spacers. Each glass plate is 600 µm thick and coated with a vertical aligned layer on its inner surface. Cells were assembled using epoxy-based UV adhesive. The intermediate layer is filled with pentylcyanobiphenyl (5CB) NLC in homeotropic alignment. The whole specimen is 280×320 mm with edges protected by silicone rubber to get rid of a leak. The silicone resin is further used as absorbers to prevent ultrasound reflected from edges. The specimen was placed between two crossed polarizers to examine its alignment before experiment.
In experiment, the specimen was attached to a holder within a water tank with a constant temperature near 30oC. The
specimen was insonified at various angles of incidence by flat immersion ultrasonic transducers with a distance beyond the near-field limit of acoustic beam. The experiments are carried out in the frequency range from 0.2 to 7 MHz by three flat, broadband transducers (Panametrics, Inc.) with center frequencies of 1, 2.25, and 5 MHz. A CW signal of swept frequency was generated by an Agilent 33250A function generator (Agilent Technologies, Santa Clara) to establish a steady state excitation. The signals are magnified by an ENI 325LA power amplifier with 50 dB gain. A 633 nm He:Ne laser beam was aimed at the point slightly away from the acoustic spot. The variation in optical intensity was detected by a New Focus model 1801 photo-receiver. All data capture and parameter setting were computer-controlled by LabVIEW (National Instruments, Inc.)
When the pressure acoustic wave impinges onto the liquid crystal cell, multiple reflection or refraction occurs at each interface of glass and surrounding water as well as glass-liquid
crystal. The mode-converted bulk acoustic waves induced at each reflection or refraction construct dispersive guided acoustic waves propagating along the cell. The guided acoustic waves are sensitive to variations in material properties and thickness of the waveguide. The liquid crystal inside the cell is not directly affected by ultrasound insonification. Instead, the liquid crystal is disturbed by guided acoustic waves induced in the specimen at a number of modal frequencies. The multi-modal guided acoustic waves propagate parallel to the specimen with the phase velocity c in a relation to the angle of incidence θ through Snell’s law,
θ =co sin
c , (3)
where co is the acoustic wave speed in the surrounding water.
The amplitude spectra of the optical transmission can be recorded as functions of exciting frequency and the angle of incidence in the range of 10o to 45o at 1o interval. The
acousto-optic response was captured by 80 individual data points at 0.25 sec constant interval for every condition. For each data set the final 8 data points were averaged to give a steady state optical intensity of transmission.
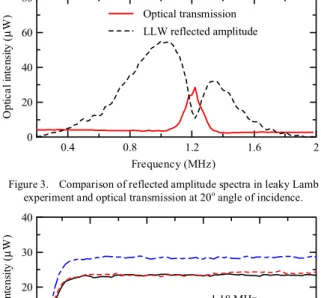
Fig. 2 shows the intensity of optical transmission versus the swept frequency of ultrasound measured at various angles of incidence. The optical intensity is enveloped by the spectra of ultrasonic transducers. The acoustic intensity is held constant for a period of 20 sec at a peak-to-peak output voltage of 80 mV from function generator. The data shown in the graph were obtained from average of the final 8 data points at each optical intensity measurement. The optical transmission occurs at specific frequencies depending on the angle of incidence. It is shown in Fig. 3 that the peak optical intensity transmitted through the cell occurs at the minimum of LLW reflected amplitude spectrum. It corresponds to the modal frequency of guided acoustic wave generated in the cell.
Fig. 4 depicts the acousto-optic response of liquid crystal cell insonified by acoustic beam with driving frequency of 1.18, 1.20,and 1.22 MHz at 20o angle of incidence. The optical
intensity increases to the steady state value within 1.8 seconds. The response time is independent of the acoustic intensity, but it is correlative to the frequency of ultrasound.
Figure 2. Optical transmission spectra measured at distinct angles of incidence. 0 20 40 θ = 15o 0 20 40 Op tic al I nt en sity (µ W) θ = 20o 1 2 3 4 5 6 7 Frequency (MHz) 0 20 40 θ = 25o light Laser Receiver r Transmitte Scope Digital Analyzer Ultrasonic Cell Crystal Liquid PR Amp Power GeneratorFunction GPIB GPIB Sync. LabVIEW ) P(0o ) P(90o
2007 IEEE Ultrasonics Symposium 833
Figure 3. Comparison of reflected amplitude spectra in leaky Lamb experiment and optical transmission at 20o angle of incidence.
Figure 4. Acousto-optic responses of the LC cell insonified at 20o angle of
incidence. Function generator output voltage is Vpp = 80 mV. III. SIMULATION AND DISCUSSION
Consider a liquid crystal cell immersed in water and insonified by a plane harmonic acoustic wave. Assume that the cell is infinitely long in the x3-direction. All the field variables
are further assumed to be independent of the coordinate x3. The
plane acoustic waves in the ideal fluid can be represented in terms of two Helmholtz potentials, Φ for the upper fluid and 0
b
Φ for the lower fluid. The displacement and stress components in the acoustic field are given by
i i x u =∂Φα ∂ , i=1,2 (4) α αω Φ ρ − = σ 2 22 , σ12=0, (5)
where the index α denotes either 0 or b. For an ideal fluid, the shear stress components vanish and the normal component of the displacement is continuous at the fluid-solid interfaces; however, tangential slip between the fluid and the solid is allowed. The boundary conditions at the top and bottom surfaces of the liquid crystal cell can be expressed in the form
{
}
{
0}
, 2 2 , 0 ) ( 2 2 0 2 2 0 2 0 2 0 0 2 H x x U H x x U x T b b b T − = Φ ω ρ − ∂ Φ ∂ = = Φ ω ρ − ∂ Φ ∂ = S (6) where U ,0 U are the components of the slip on the tangential b plane at x2 =±H 2, respectively. The state vector is defined as (x ) {u u }T 22 12 2 1 2 = σ σ S .The displacement and stress components in the isotropic solid, i.e., glass plate, are expressed in terms of two Helmholtz potentials, Φ and j Ψ , through j
2 , 1 , 1 j j u =Φ −Ψ , u2 =Φj,2+Ψj,1, (7) 2 , 2 12 1 , 1 11 11=c u +c u σ , σ22=c12u1,1+c11u2,2 ) ( 1,2 2,1 66 12 =c u +u σ , (8)
where the index j denotes the j-th layer within the cell. The elastic constants c11=λ+2µ, c12=λ, c66=µ. In addition,
the intermediate liquid layer sandwiched between two glass plates is filled with NLC, which is modeled as a hypothetical isotropic solid with a single viscosity, η [12]. The field variables within the liquid layer can be expressed as (7)-(8), but the elastic constants must be replaced by c11=κ−i4ωη3,
3 2
12 =κ+i ωη
c , c66= i− ωη, where κ=λ denotes bulk modulus. In the absence of debonds, the state vector S(x2) must be continuous across all the interfaces parallel to the mid-plane, i.e., x2 = 0.
In general, guided acoustic waves in a plate-like specimen have different names which depend on its boundary conditions. The phrase “leaky guided waves” is used to describe guided acoustic waves in a multilayered specimen immersed in water and “free guided waves” applies to a multilayered specimen with traction-free surfaces. The dispersion equation for free guided acoustic waves can be solved numerically by standard algorithm. The phase velocity dispersion curves move to the higher frequency region as thickness of liquid decreases. Those curves slightly shift to the opposite direction as the mass density of liquid decreases. Variation of viscosity has no influence on the dispersion curves in the frequency range below 6 MHz.
In numerical calculation, the physical constants of liquid crystal 5CB are given by those of water. Fig. 5 shows the phase velocity dispersion curves of a glass (600 µm)/liquid crystal (65 µm)/glass (600 µm) specimen with traction-free boundary conditions. The measured data points for peak optical intensity transmitted through the cell are located in the vicinity of S0 and
S1 modes in lower frequency range and close to A0 modes in
higher frequency range up to 4-5 MHz.
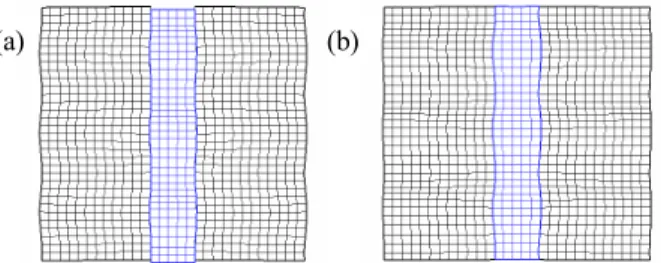
Fig. 6 depicts the deformations of the liquid crystal cell excited by the fluid mode, S0, and S1 modes near 0.8 MHz.
The acoustic pressure is proportional to volume change ratio of the intermediate liquid layer in the form
V V
p=−κ∆ (9)
Figure 5. Phase velocity dispersion curves of the liquid crystal cell and the measured data (circles) at which optical transmission appears. Solid lines
indicate the symmetric modes, dashed lines the anti-symmetric modes.
4 8 12 16 20 Time (s) 0 10 20 30 40 O pt ic al in te ns ity (µ W) 1.18 MHz 1.20 MHz 1.22 MHz 0.4 0.8 1.2 1.6 2 Frequency (MHz) 0 20 40 60 80 O pti ca l in te ns ity (µ
W) Optical transmissionLLW reflected amplitude
0 1 2 3 4 5 6 7 Frequency (MHz) 1000 2000 3000 4000 5000 6000 7000 P ha se v el oc ity (m /s ) S0 A0 A1 S1 A2 S2 A3 S3 Scholte wave
2007 IEEE Ultrasonics Symposium 834
where the volume change ratio is equal to the sum of normal strains ∆VV=εkk. Both S0 and S1 modes have not only
significant gradients of deformation in the intermediate liquid layer but obvious deformation in the glass plates. It indicates that much energy is consumed in the glass plates to guarantee acoustic pressure appearing within the liquid layer. Acoustic pressure can disturb the orientational order of the NLC from vertical alignment to a tilted situation.
The deformations shown in Fig. 7 are associated with the fluid mode (Scholte wave) and A0 mode at 5.975 MHz. The
deformation and stress distribution in the glass plates become apparent in a small region near interfaces between the intermediate liquid and the glass plates and decay quickly away from the interfaces. The fluid mode and high-frequency A0 mode possess the characteristics of interface acoustic
waves. Pressure gradient and wave energy are localized in the intermediate liquid layer. Due to symmetry of the deformation gradients shown in Fig. 7, the fluid mode and A0 mode in high
frequency range have different effects on homeotropically and homogeneously aligned liquid crystal materials, respectively.
IV. CONCLUSION
Nematic liquid crystals are optically uniaxial materials. The impinging sound can alter the alignments of NLC as what electric and magnetic fields do. The liquid crystal molecules do not be directly disturbed by ultrasound at oblique incidence. They are influenced by the guided acoustic waves which are induced by the refracted ultrasound into the sandwich liquid crystal cell. Experimental evidence indicates that the acousto-optic response of vertically aligned NLCs is correlative to modal excitations of guided acoustic waves.
The experimental results show that S0, S1 modes of guided
acoustic waves have strong effect on the realignment of liquid crystal molecules. The A0 mode has only sight influence. The
measured optical intensity depends on the gap of liquid crystal cell, acoustic intensity, angle of incidence, and so on. Further,
(a) (b)
Figure 6. Deformations of the LC cell excited by (a) S0 mode and (b) S1
mode at 1.2 MHz. The intermediate layer is enlarged twice the original.
(a) (b)
Figure 7. Deformations of the LC cell excited by (a) fluid mode, (b) A0
mode at 5.975 MHz. The intermediate layer is enlarged twice the original.
liquid crystals possess faster response in high frequency range. Even though the response time does not reach the required commercial standard, it is worth further study on acoustic realignment of liquid crystals using guided acoustic waves.
The NLC layer sandwiched between two glass plates is modeled as a hypothetical isotropic solid with a single viscosity. Phase velocity dispersion curves and displacement, stress, and strain distributions in the cells are simulated. Numerical results show that A0, S0, and S1 modes have
significant pressure gradients in the liquid layer. This prediction agrees with experimental results. The fluid mode and high-frequency A0 mode possess the characteristics of
interface waves. Most deformation of the solid layer is confined in a region near the interface. Pressure gradient and wave energy are localized in the liquid layer. Interface acoustic waves have a great application potential in manipulation of NLC molecules.
ACKNOWLEDGMENT
The authors would like to thank Professors H.-M. Chen and Y.-H. Lin of Department of Photonics at NCTU for helpful discussions and providing the specimens. The financial support from National Science Council, Taiwan, R.O.C. through grant NSC 96-2221-E-009-143 is gratefully acknowledged.
REFERENCES
[1] M. Bertolotti, S. Martellucci, F. Scudieri, and D. Sette, “Acoustic modulation of light by nematic liquid crystals,” Appl. Phys. Lett., Vol. 21, No. 2, pp. 74-75, 1972.
[2] C. Sripaipan, C. F. Hayes, and G. T. Fang, “Ultrasonically-induced optical effect in a nematic liquid crystal,” Phys. Rev. A, Vol. 15, pp. 1297-1303, 1976.
[3] J. L. Dion and A. D. Jacobn, “A new hypothesis on ultrasonic interaction with a nematic liquid crystal,” Appl. Phys. Lett., Vol. 31, No. 8, pp. 490-493, 1977.
[4] J. L. Dion, “The orienting of ultrasound on liquid crystals related to the theorem of minimum entropy production,” J. Appl. Phys., Vol. 50, No. 4, pp. 2965-2966, 1978.
[5] M. Inoue, H. Moritake, and K. Toda, “Periodic property of domain in nematic liquid crystal induced by elastic wave,” Jpn. J. Appl. Phys, Vol. 39, pp. 3125-3129, 2000.
[6] K. Toda, M. Inoue, H. Mokitake, and K. Yoshino, “Analysis of acoustic streaming in nematic liquid-crystal cell,” Jpn. J. Appl. Phys., Vol. 44, pp. 316-323, 2005.
[7] J. V. Selinger, M. S Greanya, B. T. Weslowski, D. K. Shenoy, and R. Shashidhar, “Acoustic realignment of nematic liquid crystals,” Phys. Rev. E, Vol. 66, 051708, 2002.
[8] V. A. Greanya, M. S. Spector, J. V. Selinger, B.T. Weslowski, and R. Shashidhar, “Acousto-optic response of nematic liquid crystals,” J. Appl. Phys., Vol. 94, No. 12, pp. 7571-7575, 2003.
[9] A. P. Malanoski, V. A. Greanya, B.T. Weslowski, M. S. Spector, J. V. Selinger, and R. Shashidhar, “Theory of the acoustic realignment of nematic liquid crystals,” Phys. Rev. E, Vol. 69, 021705, 2004.
[10] V. A. Greanya, A. P. Malanoski, B.T. Weslowski, M. S. Spector, and J. V. Selinger, “Dynamics of the acoustic-optic effect in a nematic liquid crystal,” Liquid Crystals, Vol. 32, No. 7, pp. 933-941, 2005.
[11] Y. Bar-Cohen, “Ultrasonic NDE of composite – a review,” Solid Mechanics Research for Quantitative NDE, J. D. Achenbach and Y. Rajapakse (Eds.) Martinus Nijhoff Publishers, Boston, pp. 197-201, 1987.
[12] A. Nayfeh and P. B. Nagy, “Excess attenuation of leaky Lamb waves due to viscous fluid loading,” J. Acoust. Soc. Am., Vol. 101, No. 5, pp. 2649-2658, 1997.
2007 IEEE Ultrasonics Symposium 835