An Analytic Hierarchy Process-Based Risk
Assessment Method for Wireless Networks
Hsin-Yi Tsai and Yu-Lun Huang
Abstract—This paper presents a wireless risk assessment method
to help an administrator manage wireless network security. The as-sessment method consists of a risk model and an asas-sessment mea-sure. The risk model is in charge of modeling the wireless network risk. Security requirements, wireless attacks, and system configu-rations are considered in the model. The assessment measure is an algorithm which determines the risk value of the wireless network according to the risk model. Our risk model is developed upon an extended analytic hierarchy process, which contains the 4 layers: the risk layer, the requirement layer, the attack layer, and the con-figuration layer. The separate layers of the risk model are helpful in dealing with the dynamics of a wireless network because only the related layers are introduced to the assessment measure when changes of the network are detected. Based on the risk model per device, our assessment measure evaluates the wireless network risk in consideration of the relations between devices, attacks, and con-figurations. Hence, our risk assessment method, composed of the risk model and the assessment measure, can determine the wire-less network risk efficiently while considering the dependencies in the wireless network. Two examples are introduced in this paper to examine the feasibility of our method. In the first example, we demonstrate that the risk values derived by our method meet the ground truth by performing practical experiments. The second ex-ample shows that our method can evaluate the risk of a changing wireless network with efficiency, and can distinguish disparities in different wireless networks.
Index Terms—Analytic hierarchy process (AHP), risk
assess-ment, wireless security.
ACRONYMS 4-RAH 4-layer risk analytic hierarchy
AES Advanced Encryption Standard
AH absolutely high
AHP analytic hierarchy process
AHVM aggregated historical vulnerability measure
AL absolutely low
AP access point
CVE Common Vulnerabilities and Exposures
Manuscript received October 11, 2009; revised May 26, 2010 and January 11, 2011; accepted April 01, 2011. Date of publication October 13, 2011; date of current version December 02, 2011. This work is supported in part by TRUST Center of UC Berkeley, NCP, TWISC, and National Science Council (NSC Grants: NSC 100-2219-E-009-005 and NSC 99-2218-E-009-017). Associate Editor: S. Shieh.
The authors are with the Institute of Electrical Control Engineering, National Chiao-Tung University, Hsinchu, 30010, Taiwan (e-mail: hytsai.ece96g@nctu. edu.tw; [email protected]).
Color versions of one or more of the figures in this paper are available online at http://ieeexplore.ieee.org.
Digital Object Identifier 10.1109/TR.2011.2170117
DoS Denial of Service
EAP Extensible Authentication Protocol
FH fairly high
FL fairly low
H high
HVM historical vulnerability measure
IHVM integrated historical vulnerability measure
L low
M medium
MAC Multimedia Access Control
NVD National Vulnerability Database
OS operating system
SSID Service Set Identifier
STA wireless station
TCP Transmission Control Protocol
TLS Transport Layer Security
VH very high
VL very low
WEP Wired Equivalent Privacy
WLAN Wireless Local Area Network
WPA Wi-Fi Protected Access
WPA-PSK Wi-Fi Protected Access—Pre-Shared Key WPA2-PSK Wi-Fi Protected Access 2—Pre-Shared Key
NOTATIONS The severity of a vulnerability
The decaying speed of the exponential function The age of a vulnerability
Attack targeting on an access point Attack targeting on a wireless station Value determined by the AHVM
The degree matrix of a given device. The matrix dimension is -by- . The entry is used to represent the impact that the attack imposes on the th security requirement.
Device Configuration
Value determined by the HVM Normalized
Impact severity of a device Value determined by IHVM Normalized
Number of attacks
Number of attacks targeting on APs Number of attacks targeting on STAs Number of wireless devices in a network Number of APs in a network
Number of STAs in a network Number of security requirements Number of services running on a device Number of vulnerabilities of a service
Probability vector. Each entry is the probability of acquiring the th configuration.
Risk level vector. Each entry reflects the help that a captured configuration may offer to an attacker.
Service
Total impact severity of a wireless network Weight vector of configurations, an -dimension column vector. Each entry reveals the impact leading to the attack , where the impact varies with the configurations of a wireless system. Weight vector of requirements. The vector is an
-dimension column vector. Each entry represents the weight of a security requirement when deriving the total impact severity.
I. INTRODUCTION
T
HE dynamics of wireless networks make network man-agement a critical challenge. To help a network admin-istrator effectively manage wireless network security, it is es-sential to design a risk assessment method which models the wireless network risk reasonably, and measures the risk value according to the characteristics of the network practically. Net-work risk is defined as “a function of the likelihood of a given threat-source’s exercising a particular potential vulnerability, and the resulting impact of that adverse event on the organ-ization” [1]. According to the definition, network risk varies with program or system vulnerabilities, which may be caused by several factors such as inappropriate design or misbehaving users, and can be exploited by a threat source. Because the im-pact severity of a risk raised by the different factors varies withpoor device configurations or vulnerable running programs, a wireless risk assessment method should consider device con-figurations and vulnerable running programs, in addition to the features of wireless networks. Researchers intend to design a holistic wireless risk model, and to measure the wireless risk based on the model. An administrator can understand the wire-less network security, and plan appropriate defense or patch strategies according to the assessment result.
In 1999, Phillips et al. proposed an approach to modeling network risks based on an attack graph [2], which draws paths that may lead to an unexpected state of a network. An attack graph is generally developed with attack templates, system con-figurations, and attack capabilities [2]–[4]. It provides elabo-rate information to break into a network, and becomes a helpful tool to analyse the potential threats within a network. Many researchers and professionals have proposed network security measures based on attack graphs [2], [5]–[9]. However, the paths of an attack graph are tightly dependent on the exploited vulner-abilities. Redrawing the whole attack graph is required when a device joins or leaves a network. Periodically redrawing an attack graph of a wireless network could lead to a heavy load because topologies and configurations of a wireless network usually change in high frequency. In addition, an attack graph mainly focuses on the exploitable paths within a network. It is deficient of modeling the undesirable states resulting from the vulnerable aerial media, which is one of the key features of wire-less networks.
In addition to the attack graph-based models, analytic hier-archy process (AHP) models are also proposed to model net-work risks [10], [11]. In [10], [11], 3-layer hierarchical struc-tures are constructed based on the AHP to model wireless net-work risks. The top layer shows the goal of risk assessment. The middle layer introduces the rules for weighting the risk fac-tors with the aspects of probability, impact severity, and uncon-trollability. The bottom layer lists risk factors in network secu-rity, which may be network attacks, crash of devices, or actions without permission, etc. These AHP structures, composed of critical elements of wireless network risk assessment, are useful to systematically measure network security. However, [10] and [11] simply discuss how the risk factors affect network secu-rity without considering the impacts resulting from the practical configurations and network topologies. Because incorrect con-figuration is the main reason for system vulnerability for both wired and wireless networks, the existing 3-layer structures are deficient in modeling network risks.
In this paper, we develop a wireless risk assessment method to help an administrator manage the WLAN security in consid-eration of the features of the wireless network, such as aerial media, or the dynamics. Our risk assessment method is com-posed of a risk model, and an assessment measure. The risk model is in charge of modeling the wireless network risk from the aspects of the security requirements, the wireless attacks, and the configurations. The assessment measure is an algorithm determining the risk value based on the risk model. With the proposed method, an administrator can analyse and handle the weak configurations to enhance wireless network security.
To complement the deficiencies of existing methods at modeling network risks (attack graph-based, and AHP-based
methods), we propose a 4-layer risk analytic hierarchy (ab-breviated to 4-RAH) in consideration of the dynamic features of wireless networks. We extend the existing 3-layer AHP hierarchy into four layers with an extra layer of device con-figurations. The additional layer is introduced to consider the impacts from incorrect configurations, and to deal with the frequently changing configuration of a wireless network. Our 4-layer hierarchy consists of the risk layer (1st layer), the re-quirement layer (2nd layer), the attack layer (3rd layer), and the configuration layer (4th layer) that considers the vulnerabilities, the wireless attacks, and the attack targets within a wireless network. With the design of the separate layers, it is beneficial to incorporate the dynamic configurations because only the 4th layer is re-built on detecting the changes of the configurations. Further, because our hierarchy is developed per device, we can easily establish or remove the corresponding hierarchy when a device joins or leaves the network that integrates the dynamic topology of the wireless network. Based on the hierarchy per device, we propose an assessment measure to evaluate the wireless network risk from the perspectives of the devices, attacks, and configurations to reflect the dependencies in a wireless network.
The rest of this paper is organized as follows. Section II re-views the existing risk assessment measures. In Section III, we explain the design of our risk assessment method based on the analytic hierarchy process, present the proposed metric, and in-troduce our measure algorithm. Section IV gives two examples to show the feasibility of our method. We conclude this paper in Section V.
II. BACKGROUND
In addition, to model the network risk by a graph or a hier-archy, we also need to measure the network risk value to pro-vide a reference for administrators so that they can understand their network security. Because the risk value can be determined based on crisp numbers or fuzzy numbers, the assessment mea-sures are classified into two types according to the types of num-bers.
1) Crisp-based measures
The risk value in the form of crisp numbers can help admin-istrators interpret the number easily because human beings are more familiar with crisp numbers than fuzzy numbers. Well-known active vulnerability databases, like National Vulnerability Database (NVD) [12], provide numerical im-pact values of software or system vulnerabilities, such that it is profitable for administrators to update the databases, and control the real-world threats if the risk assessment measure takes crisp numbers as its base. Due to the advan-tages, many researchers [13]–[15] have proposed their risk assessment measures based on the crisp-based databases, such as NVD [12].
In [13]–[15], the authors mined NVD to aggregate the data about vulnerabilities into the assessment measures. The measures calculate the risk value of each service in terms of the vulnerabilities of the service. Because the probability that a vulnerability has been analysed and patched may gradually enlarge as the time passes by, the risk value led by the vulnerability usually decreases with the growth of
its age. In [13]–[15], the authors also proposed the histor-ical vulnerability measure (HVM) to consider exponential functions decaying with the vulnerability age when evalu-ating the risk value caused by the vulnerability.
2) Fuzzy-based measures
For network risk assessment, existing risks and expert ex-periences may be expressed in a natural language, which crisp numbers may not be able to deal with. To quantify system risk based on the linguistic information, and to preserve the linguistics after arithmetic operations, fuzzy set theory [16] can be introduced to practically quantify imprecision and uncertainty of vague assessments. Fuzzy numbers can preserve human experiences better than crisp numbers.
In 1989, Kangari et al. [17] proposed a risk assessment measure using fuzzy set theory to represent the information expressed in a natural language. Kangari divided the risk assessment measure into 3 steps: 1) natural language rep-resentation, 2) fuzzy risk evaluation, and 3) linguistic ap-proximation. In the 1st step, expert experiences expressed in a natural language are converted into fuzzy sets. The 2nd step calculates the risk value based on fuzzy sets. The goal of the 3rd step is to find a linguistic term with the closest meaning to the evaluated risk value. Many fuzzy-based as-sessment measures evaluate risk by following these 3 steps. For these measures, it is a critical issue to accurately asso-ciate the final risk value with a linguistic term. Researchers [18]–[20] have proposed various fuzzy similarity metrics to determine the closeness between the final risk value and a predefined fuzzy number which represents a specific lin-guistic term.
Our assessment measure adopts crisp numbers, rather than fuzzy numbers, for two reasons: to better aggregate with the practical databases, and to provide administrators intuitive risk values. Because our measure evaluates the network risk by using a publicly credible vulnerability database, the assessment result can reflect the real-world situation in real-time with periodic up-dates. In addition, it is essential to provide an easy-to-interpret assessment result such that an administrator can control network security relatively easily. Although some factors of wireless se-curity are difficult to measure precisely by crisp numbers, crisp numbers are applicable for the wireless risk assessment in re-ality, especially in consideration of human intuition, and inte-gration with real-world databases.
III. RISKASSESSMENTMETHOD
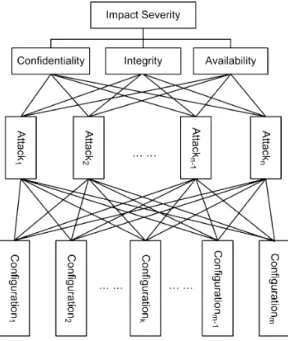
According to the definition of network risk given in Section I, network risk can be interpreted as the resulting impact which results from the likelihood, the threat sources, and the vul-nerabilities. To fulfill the definition, we propose a risk model (4-RAH), shown in Fig. 1, to describe the risk of a wireless network. The top layer of our model represents the impact severity which threatens the security requirements (2nd layer) of a wireless network. According to the definition, the impact severity should be determined in terms of three factors: likeli-hood, threat sources, and vulnerabilities. Our model introduces the attack layer (3rd layer), and the configuration layer (4th layer) to indicate the threat sources, and the vulnerabilities,
Fig. 1. Proposed hierarchy per device. General case.
respectively. The edges between the layers represent the likeli-hood mentioned in the definition. We establish the hierarchy for each device; and then, based on the hierarchy, we propose an assessment measure which contains a newly defined historical vulnerability metric, and an algorithm to determine the network risk value.
We do not claim that a smaller risk value derived from our measure necessarily implies a wireless network is more secure against all attacks. Instead, we expect that small values of this measure are necessary but not sufficient for security. Our method is intended to reflect the robustness of a wireless network through the security analysis. In this regard, we be-lieve that our method is helpful in evaluating the robustness of wireless networks with different configurations.
A. Risk Model: Four-Layer Risk Analytic Hierarchy
4-RAH is proposed to model the wireless network risk with four layers: risk, requirements, attacks, and configurations.
1) Risk Layer: The first layer (risk layer) only contains a root node, representing the impact severity of a wireless network as the security requirements of the network are not achieved.
2) Requirement Layer: We introduce the credible network security requirements, confidentiality, integrity, and availability, into the 2nd layer of 4-RAH.
• Confidentiality is imperiled when information is available or disclosed to unauthorized users. Different attacks aim for different targets. For instance, an eavesdropping attack launches impacts on network traffic confidentiality, while a penetration attack causes damage to memory data confi-dentiality. In this paper, loss of confidentiality can occur in multifarious targets which depend on the types of attacks. • Integrity is damaged if data or messages are executed, modi-fied, suspended, copied, replayed or deleted by an illicit user. Because attackers may be interested in attacking different targets such as network traffic or memory data, the integrity mentioned in this paper varies with the types of attacks.
• Availability mainly focuses on whether a service operation is affected by an attack, or whether an authorized user can access a network service they should. The availability men-tioned in this paper is endangered if the service or server is spoofed, penetrated, or suspended, and cannot operate as expected.
3) Attack Layer: In 4-RAH, the third layer (attack layer) represents attacks which may damage the security requirements listed in the second layer. An attack may pose different impacts on different security requirements, which have specific concerns on various targets, such as bandwidth, network traffic, programs, or computers. The targets may suffer different risks even though they are under the same attack. Taking a beacon flood attack as an example, the attack succeeds when targeting on the band-width, but fails if it intends to attack a program. In our model, the attack layer analyses the attacks, not only in terms of their behaviors, but also the impacts with respect to the attack targets, and the security requirements. In addition, the impact varies with the sequence of attacks. Because the impacts of attacks are dependent on the sequence in which they are carried out, we define two types of impacts to express the relationship in the at-tacking sequence: direct, and indirect.
• Direct impact: the impact lays on the security requirements initially targeted by an attack.
• Indirect impact: the impact is a side effect accompanied by the direct impact from the previous attack.
For example, an eavesdropping attack imperils traffic confiden-tiality by maliciously sniffing wireless network packets. It poses the direct impact upon traffic confidentiality, and no direct im-pact on other targets, such as a file or a program. The packets sniffed by an eavesdropper can become a requirement for a sub-sequent attack, such as a replay attack, and thus further endan-gers traffic integrity. Hence, an eavesdropping attack results in the indirect impact on traffic integrity. When evaluating the pacts caused by an attack, the union of direct and indirect im-pacts should be considered.
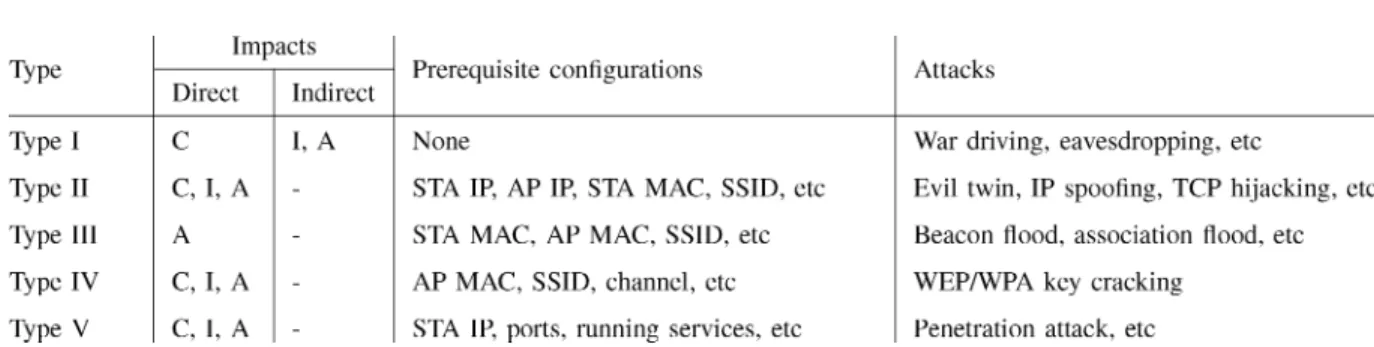
After analyzing the existing wireless attacks, we categorize wireless attacks into five types, including scan or monitor, mas-querade, Denial of Service (DoS), key cracking, and penetration attacks, with respect to their behaviors and intentions.
• Type I: Scan or Monitor attacks
Scan attacks intend to search for accessible wireless net-works. The monitor attacks aim at gaining useful, crit-ical information of a victim network by intercepting aerial packets, and analyzing network traffic. Such kind of tacks includes war driving, eavesdropping, active scan at-tacks, etc. Because Type I tries to obtain critical informa-tion, most of the attacks of this type directly impact net-work traffic confidentiality.
• Type II: Masquerade attacks
An attacker masquerades as a legitimate user to access a wireless network, or as a legitimate device to pirate net-work traffic or disable a functioning access point (AP). Once the attacker has snatched the identity of a victim suc-cessfully, the victim can no longer access the network, or the attacker can then provide network service to other il-licit users. Thus this type of attack directly impacts avail-ability. With the counterfeit identity, the masqueraded user
TABLE I TYPES OFATTACKS
C: confidentiality; I: integrity; A: availability.
can easily capture or reach private information so that con-fidentiality and integrity are usually threatened as well. • Type III: DoS attacks
Denial of Service (DoS) attacks aim at making computers or network resources unavailable to legitimate users. At-tackers take advantage of the paralysis period to launch other attacks. Then, they can devastate the network security severely. Because service requests are denied under this type of attack, the direct impact is against availability. • Type IV: Key cracking
Key cracking attacks try to recover WEP or WPA keys by analyzing numerous packets. After cracking the protection keys, all requirements (confidentiality, integrity, and avail-ability) are harmed.
• Type V: Penetration attack
This kind of attack attempts to penetrate a victim system through system vulnerabilities. After the success of the at-tack, the attacker can control the files, the programs, even the computer such that data confidentiality, data integrity, or service availability may be destroyed. All three security requirements are threatened under this type of attack. 4) Configuration Layer: To launch some attacks toward a wireless network, an attacker needs to obtain certain network in-formation or device configurations, such as IP addresses of wire-less stations (STA) or APs, Multimedia Access Control (MAC) addresses of STAs or APs, Service Set Identifiers (SSIDs), wire-less channels, OS versions, running services, etc. In 4-RAH, the 4th layer (configuration layer) exhibits configurations of wire-less devices and wirewire-less networks. The following paragraphs discuss some configurations required to launch certain attacks. More configurations can be added to this layer when needed.
• IP address is one of the prerequisite configurations for an attacker to identify a victim in an IP network. Attacks of Type II, III, and V require such a configuration.
• MAC address is one of the configurations required to iden-tify the physical address of a victim. Attacks of Type II, III, and IV require this configuration.
• SSID is one of the prerequisite configurations when an at-tacker attempts to connect or scan a specific wireless local area network. Attacks of Type II, III, and IV need this con-figuration.
• Wireless channel is one of the configurations required to launch key cracking attacks. Attacks of Type IV require such a configuration.
• OS version is one of the configurations required to obtain the possible vulnerabilities of a victim. Type V attacks re-quire this configuration.
• Running services and open ports are useful configurations to penetrate a victim. Type V attacks need this configuration. Table I lists the five attack types, and the relations with the security requirements and prerequisite configurations. Note that an attacker can start Type I attacks without prerequisite configu-rations, though the performance of the attacks can be enhanced if the attacker obtains more network configurations.
B. Integrated Historical Vulnerability Metric: IHVM
In our risk assessment method, we define an integrated his-torical vulnerability metric (IHVM), evolving from HVM and AHVM proposed in [14], to evaluate the risk value of a device based on existing vulnerabilities.
1) HVM and AHVM: HVM measures the risk level of a ser-vice imposed by vulnerabilities of the serser-vice, and weights the vulnerabilities in terms of their ages [14]. The authors of [14] assumed that a vulnerability discovered a long time ago should take a small weight because the vulnerability may be understood and patched with a high probability as time passes by. There-fore, the age of a vulnerability is introduced in the decaying function of (1). [14] showed that can imply the proba-bility that service will become vulnerability-prone in the fu-ture.
(1) Not all of the vulnerabilities of service should be counted because the vulnerability effect usually declines with age, ap-proaching zero. If only the latest vulnerabilities of service
are considered, then we can derive by , as
rep-resented in (2).
where (2)
A combination of for all services running on a device is defined by the AHVM [14]. AHVM is useful in calcu-lating the vulnerability threats that a device faces.
However, if there is no vulnerability detected in , AHVM outputs an undefined value, ln 0. To address such an error, a new metric (IHVM) is proposed with our four-layer risk assessment model.
2) IHVM: IHVM is proposed to ensure the existence of the boundary values. In this metric, the notation represents the value calculated by IHVM, while stands for the
nor-malized , where
(4)
The higher implies that the running services may con-tribute more severity to the device. If no service is running on
, then will be set to 0.
After sorting , running on , if we only
con-sider the top highest , then the maximum
becomes . So, we can obtain the risk level
of a single device according to the service vulnera-bilities by (5).
(5) As a result, we can guarantee that falls into the range [0, 1].
C. Risk Assessment Algorithm
This section explains the algorithm of our assessment mea-sure, and represents a step-by-step progress toward the wireless network risk.
Next, we explain the steps to measure the risk value of a wire-less network.
Step 1) Establish risk model.
Initially, an administrator needs to build up a 4-RAH, and generate degree matrices of de-vices within a wireless network by investigating possible attacks.
Step 2) Develop experience mapping tables.
Because mobile wireless devices have certain soci-ological orbit, the security requirements and risks may differ by the position of a sociological orbit. This step intends to introduce expert experiences to adjust factors, and to achieve scenario-adaptive as-sessment.
To provide a fair or even close to fair assessment, multiple experts could be consulted. In 2005, Zhao et al. [10] proposed a method to evaluate the con-sistency of expert opinions with entropy theory. In our method, once an administrator develops the ex-perience mapping tables, experts could be consulted to approve the experiences shown in the tables. Be-cause the degrees of approval may be categorized into several levels, the consistency of the degrees should be further evaluated. If all the experts show the same degree level of approval, the consistency reaches the maximum. On the contrary, the consis-tency reaches the minimum if the degree levels
dis-tribute equally. In the end, an administrator can ob-tain the weighted importance from the consistencies. Step 3) Assess network risk.
This step can be further decomposed into several sub-steps.
1) Specify , and .
According to network configurations, expert ex-periences, and vulnerability databases, we ob-tain , and , where relies on the encryption method used in a wireless network, and is termined with three aspects: 1) adoption of a de-fault value of the configuration, 2) the number of attacks that view the configuration as a prerequi-site, and 3) the value for the configuration of “running services.”
2) Determine .
We can obtain the th entry of for the attack by (6).
(6) If no prerequisite configuration is required, is set to 1, which is the maximum weight. 3) Determine .
We determine the value of each entry of in terms of the functionalities of a device. For example, the “availability” of an access point should have a heavier weight than “confiden-tiality” and “integrity” because the AP is in charge of providing Internet access for wireless
devices. .
4) Determine .
Because the security of a device may suffer more as the number of attacks that pose interests to the device raises, the range of is designed based on the size of , which relates to the number of attacks targeting on . We then ob-tain the impact severity of the device as
(7) Because entries of , , and all fall within [0, 1], and the summation of all entries of
equals 1, falls within .
5) Calculate .
Because any device in a network may jeopardize the network security, we accumulate the contri-bution of each device towards the total impact severity by (8).
(8) Because a compromised device or a device with weak configurations is usually viewed as a step-ping stone by an attacker to propagate attacks,
TABLE II
NUMERICALIMPACTSEVERITY VS. LINGUISTICMEANINGS
(8) while the other smaller values are also in-troduced. We conjecture that the value of in-creases as the network becomes risky.
, which depends on the number of devices and their configurations, varies with different network topologies. If there are more devices within a network, the possible maximum value of becomes larger. If there are APs and STAs in a wireless network, then falls
within ,
. However, is so dynamic with
the variation of , , , and that a
network administrator may be puzzled in inter-preting . To help the administrator interpret the numerical , and understand the network risk, we suggest a mapping between the numerical and linguistic meanings.
We first calculate the maximum impact severity of devices in a network, and then define the thresholds for low, medium, and high threats. For the above case with APs and STAs, we can obtain the maximum impact severity
, , and
, by (8). If all the devices
have their impact severity with the maximum value, 1, then we conjecture in such a situation that the network is undoubtedly unreliable, and absolutely insecure. However, not all the net-works require such a strict condition.
If a very strict condition is set, an administrator may over-ignore unexpected events, and may not deal with the wrong configurations in real-time. Hence, we suggest a mapping between the numerical risk values and the risk levels listed in Table II. The mapping table discusses both the ratio of the maximum impact severity and the ratio of the number of all the devices. The nu-merical thresholds shown in Table II can be ad-justed according to an administrator’s expertise, experiences, or sociologic orbits.
6) Refresh the topology snapshot
If new devices or new configurations are de-tected, the topology snapshot should be re-freshed. In our method, it is not necessary to re-calculate the corresponding values of all
devices. An administrator simply executes the sub-steps 1 through 5 to determine the impact
severity of devices, , where
rep-resents the device newly entering the network, or the device whose configurations have been changed. Then, sub-step 6 is performed to re-calculate the total risk of the wireless net-work.
D. Implementation
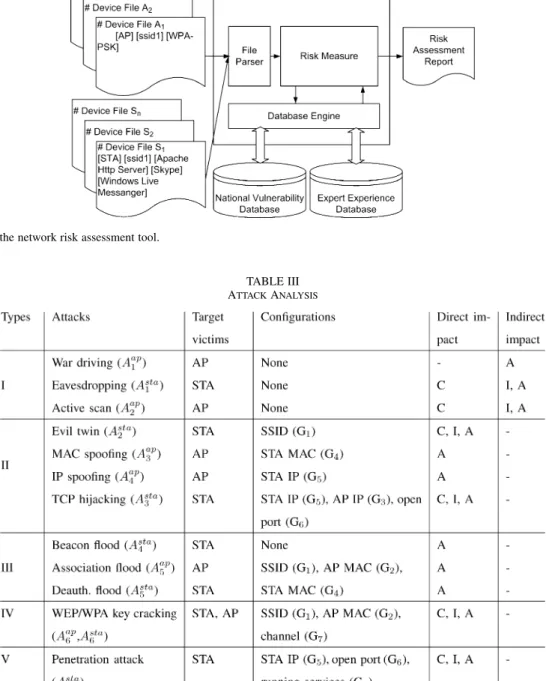
The proposed risk assessment method is realized using MATLAB R2009a. Fig. 2 shows the framework of our risk assessment tool, consisting of three major components: “device parser,” “risk assessment,” and “experience engine.”
• The “device parser” pre-processes device configurations to obtain parameters for the “risk assessment” module, which calculates the risk value, and produces a risk assessment report. As illustrated in Fig. 2, a device file contains con-figurations of a device, including the type of the device, the encryption methods used, its IP address, running services, etc.
• The “risk assessment,” the core of our tool, is responsible for evaluating the risk of a wireless network.
• The “experience engine” is in charge of searching and col-lecting expert experiences from NVD and network admin-istrators. It maintains the impacts of wireless attacks, the risk levels of configurations, the probabilities of acquiring configurations, and the vulnerabilities published in NVD, etc.
IV. CASESTUDY
In this section, we demonstrate the effectiveness and feasi-bility of our risk assessment method by two examples. In Ex-ample I, we develop two different wireless networks, and as-sess the risks of the two networks. Then we launch a practical eavesdropping attack against the two networks, and obtain dif-ferent experimental results. The comparison between the assess-ment results and the experiassess-ments shows that our risk assessassess-ment method can distinguish the differences in wireless networks, and can reflect the realistic situation. In Example II, we intro-duce several configuration snapshots of a wireless network at different timing points to illustrate how our method addresses the wireless dynamic features. The example presents that our
Fig. 2. Framework of the network risk assessment tool.
TABLE III ATTACKANALYSIS
C: confidentiality; I: integrity; A: availability.
method can efficiently determine the risk value of a wireless network with a changing topology.
In these examples, we should first build up a risk analytic hier-archy, and then define the experience mapping tables to further determine the risk levels of configurations, the probabilities of acquiring device configurations, etc. With the hierarchy and the tables, our assessment algorithm derives the risk values. The de-tails of the assessment steps are given in the end of the section. A. Step 1: Establish Risk Model
To build up a four-layer risk hierarchy, an administrator needs to select and analyse possible attacks in a wireless network. In the following two examples, we introduce known wireless attacks to each attack type. Then the risk model can be es-tablished based on the analysis of these attacks. According to
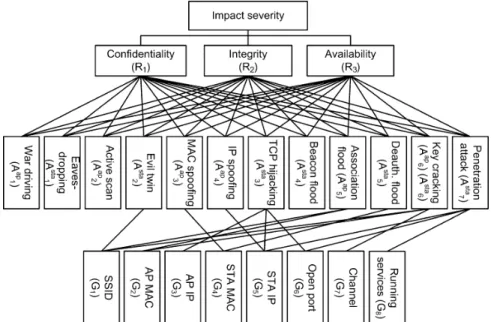
the discussion in Section III-A-3, and the literature [21]–[24], we analyse the targets, the impacts, and the prerequisite con-figurations of 12 known wireless attacks: war driving, eaves-dropping, active scan, evil twin, MAC spoofing, IP spoofing, TCP hijacking, beacon flood, association flood, de-authentica-tion flood, key cracking attacks, and penetrade-authentica-tion attacks. The analysis results are listed in Table III. Then, we can construct the 4-RAH for the examples (see Fig. 3).
B. Step 2: Develop Experience Mapping Tables
Expert experience is mandatory to assess network risk. To de-rive the risk value which can reflect the practical situation, ex-pertise and real-world experiences are introduced into our risk assessment method. In this step, we inject expert experiences to define expertise mapping tables for 1) converting the expert experiences to crisp numbers, 2) defining risk levels of device
Fig. 3. Four-layer risk assessment hierarchy constructed for the example networks.
TABLE IV
EFFECTIVEATTACKS ANDRISKLEVELS
configurations, 3) defining the probability of acquiring a config-uration, and 4) assigning each impact a numeric value.
• Linguistic to numeric conversion
Table IV exhibits an example of the linguistic-to-numeric conversion. In the conversion table, 9 linguistic terms are mapped to crisp numbers falling within the range [0, 1]. The crisp numbers assigned in Table IV can be adjusted according to the experience of an administrator or the so-ciologic orbit.
• Risk levels of device configurations
The risk levels of device configurations can be determined by the following factors.
1) Configuration management: A device is risky if it adopts default configuration values. If an admin-istrator adopts the default configuration without changing periodically, then it is easy for an attacker to guess the setting. The configuration is hence viewed as a risky configuration. In Fig. 3, configurations (SSID), and (open port) are of “High” (H) risk, if default settings are taken; otherwise “Low” (L) risk levels are assigned.
TABLE V
NVD VULNERABILITIES OFRUNNINGSERVICES
The vulnerabilities are named by the Common Vulnerabilities and Exposures (CVE) standard [25].
2) Number of effective attacks: An attack may require some configuration for a successful launch. Such an attack is called an effective attack of the configura-tion. The risk level of a configuration increases with the number of effective attacks taking this configura-tion as a prerequisite. In Fig. 3, the risk level of ,
, , , , , and can be determined by the
number of effective attacks.
3) value: The risk level of the configuration (running services) can be determined by (5).
Table IV lists an example conversion between the number of effective attacks and the risk level of a configuration.
Fig. 4. Example 1. No security mechanism is applied in Ex1-1, but the network is protected by WPA2-PSK in Ex1-2. Eavesdropper(STA ) successfully captures STA ’s MSN messages in Ex1-1 but fails to sniff the communication session in Ex1-2.
An administrator may adjust the conversion between the number of effective attacks and the risk level of a config-uration according to his or her expert experience, and the dynamics of a wireless network. Table V lists the vulnera-bilities of some services, the severity of each vulnerability, and the age of each vulnerability, which we can obtain from NVD. Then, we derive the values of the services
by (1) with .
• Probabilities of acquiring configurations
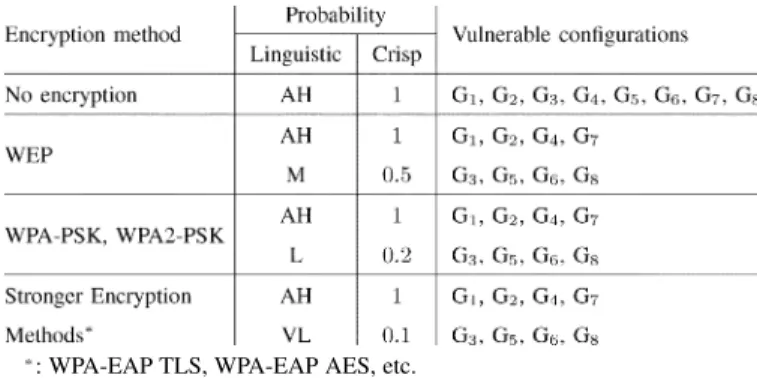
The probability of acquiring a configuration is strongly dependent on the encryption method adopted in a wire-less network. For instance, it takes different efforts to de-crypt packets ciphered by the WEP or WPA method. How-ever, in some cases, the attacker may obtain some configu-rations that cannot be protected by the activated encryp-tion method. By analyzing the configuraencryp-tions illustrated in Fig. 3, we present an example of probabilities to ob-tain configurations under various encryption methods in Table VI.
• Impact level
The impacts on the security requirements can be classified into three levels: direct, indirect, and no impact. According to the expert experience, an administrator can assign each impact a numeric level. In this example, we assign 1, 0.5, and 0 to direct, indirect, and no impact respectively. Then, we produce the degree matrices of the victim de-vices according to Table III. Because 6 attacks target on
victim APs, and 7 attacks shoot for stations, a 6-by-3 ma-trix , and a 7-by-3 matrix can be derived for an AP, and a STA, respectively (see (9)). By definition, each row of a degree matrix represents the impacts against the security requirements launched by an attack. Because three security requirements (confidentiality, integrity, and avail-ability) are adopted in our hierarchy, each row has three el-ements as shown in (9). For example, “war driving ” only has indirect impact on the availability of a victim AP, so the 1st row of is [0 0 0.5].
(9)
C. Step 3: Assess Network Risk
Example I: Eavesdropping Attack: In the first example, we design two experiments (Ex1-1, and Ex1-2) with similar wire-less topologies, one AP, and two STAs. runs Windows Live Messenger, and maliciously eavesdrops the conver-sation of by running Wireshark. In this example, no se-curity mechanism is applied in Ex1-1, but WPA2-PSK encryp-tion is introduced in Ex1-2 to protect the network traffic. Due to
TABLE VI
PROBABILITY OFACQUIRINGCONFIGURATIONS
: WPA-EAP TLS, WPA-EAP AES, etc.
the different configurations, successfully eavesdrops the traffic of in Ex1-1, but fails to steal the MSN conversa-tions of in Ex1-2. Fig. 4 shows the scenarios and results in Example I.
In the following, we intend to evaluate the risks of the two networks with the proposed method.
1) Derive , and . The rules of calculating the risk levels of different configurations are mentioned in Section IV-B.
(a) For , and , their risk levels should be deter-mined by 1) the configuration management, and 2) the number of effective attacks. In this example, does not adopt a default setting, and hence a “Low” (L) risk level is assigned. In addition, is a prerequisite for three attacks, including “evil twin,” “association flood,” and “key cracking” attacks. By Table IV, a “fairly high” (FH) risk level may be assigned. In the end, we convert these possible risk levels to crisp numbers, and select a maximum value, , for . In the same way, we can
obtain the risk level of , , by
assuming a default setting is adopted for .
(b) The risk levels of , , , , and are
de-termined by the number of effective attacks. For ex-ample, is required by 2 attacks, and its risk level is then set to “FH,” where “FH” implies 0.7.
(c) The risk level of is determined by the IHVM, as mentioned in Section IV-B. In this example, is running a service, Windows Live Messenger , and is running a service, Wireshark , while no service is run on . According to NVD, there
are 8, and 93 known vulnerabilities of Windows Live Messenger, and Wireshark, respectively. Table V dis-plays the newest 5 vulnerabilities of each. If the ad-ministrator only concerns themselves with the latest 5 vulnerabilities of each service, and introduces the highest three to , then, by (1), (2), (4),
and (5), we can obtain , and derive
and by (see the equation
at the bottom of the page).
Then, we obtain the risk levels of configurations of , , and . In both Ex1-1 and Ex1-2,
(10) (11) (12) We calculate the probability of acquiring configurations by analyzing Tables IV and VI. We obtain in Ex1-1 (no security protection),
(13) In Ex1-2 (the WPA2-PSK encryption is applied),
(14) 2) Derive the weight vector of configurations of ,
, and by (6). In Ex1-1,
(15) In Ex1-2,
(16)
Windows Live Messenger
3) Derive the weight vector of requirements for each network device. For example, “availability” of an access point should have a heavier weight than “confidentiality” and “integrity” because the AP is in charge of providing Internet access for wireless devices. Hence, in Ex1-1 and Ex1-2, we have
(17) On the other hand, confidentiality, integrity, and avail-ability could be weighted equally for a wireless station, such that
(18) 4) Derive the impact severity of each device. By (7), (9),
(15)–(18), we obtain ,
, and
. Similarly, we can obtain the impact severity of each device in Ex1-2:
, , and .
5) Determine the risk value by (8). We obtain the risk values for Ex1-1, and
for Ex1-2, respectively. According to Table II, Ex1-1 falls into the HIGH category because is larger than the high threshold 3.6887. Similarly, Ex1-2 falls into the LOW category because is smaller than the medium threshold 3.3877.
Such a result is close to the real situation because the derived risk value is larger when the eavesdropping attack succeeds, and the risk value is smaller when the network Ex1-2 can resist the attack.
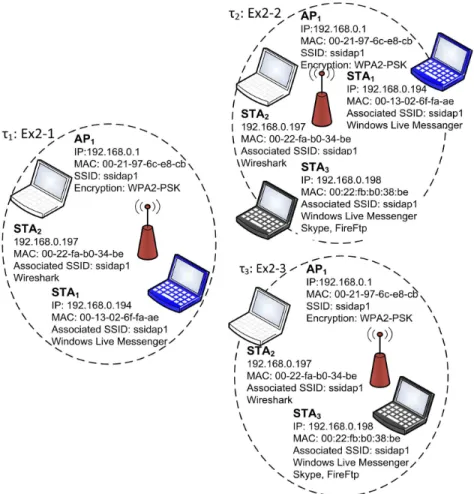
Example II: Dynamic Topologies: In the second example, we show how our risk assessment method incorporates the dynamic topologies of a wireless network. The example presents snap-shots of a wireless network at times , , and . Initially (at time ), the network contains one AP, and two STAs. Then, a new station enters the network at . Finally, leaves at . Fig. 5 shows the network topologies, and the de-vice configurations. With the proposed method, we can manage
the changing wireless network, and assess the network risk ef-ficiently by performing the following steps.
Initially, at time
Because the two networks in Ex1-2 and Ex2-1 are exactly the same, we derive the total risk value the same as
. At time
joins the wireless network (as shown in Fig. 5) at time
. Because no changes are made in , , and , we
do not need to re-calculate the corresponding impact severities, but perform the following steps.
1) Derive the risk levels of configurations of , .
Assume that runs the services Windows Live
Messenger , Skype , and FireFtp ; and the
administrator intends to consider the latest five vul-nerabilities of each service. According to the service vulnerabilities listed in Table V, we derive ,
by (1) and (2), and then derive
according to by (2) and (4) (see the equation at the bottom of the page). Hence, we obtain
. Because Ex2-2 still uses WPA2-PSK encryption, the probability of acquiring configurations remains the same, where
.
2) Derive the weight vector of configurations of , . By (6), we obtain
(19) 3) Assign the weight vector of requirements. In this example,
we apply the same vector, , given in Example I. 4) Derive the impact severity of :
.
5) Derive the total risk value, , from ,
, , and . By (8), we
ob-tain .
Compared with the experiment Ex2-1, there are more devices and vulnerabilities in Ex2-2; hence, the total risk value is larger than .
At time
leaves the network with nothing changed for other devices. We can easily determine the risk value at by re-calculating with the known impact severities
Windows Live Messenger Skype
Fig. 5. Example 2. Snapshots of the wireless network at different time.
, , and . As a result, we obtain
,
where , , and
.
V. CONCLUSION
This paper presents a risk assessment method for a wireless network to help an administrator monitor the wireless network security. Our method derives the risk value as a reference for the administrator to understand the potential threats caused by weak configurations or software vulnerabilities. We design a 4-layer analytical hierarchy to model the wireless network risk, and pro-pose an assessment measure to evaluate the network risk based on the 4-layer hierarchy. The hierarchy is developed from per-spectives of the risk, the security requirements, the attacks, and the configurations. The four layers are clearly separated such that only the related layers are re-calculated when changes of the wireless network are detected. Because the hierarchy is built up per device, we can insert or remove a hierarchy into or from a network efficiently according to the changing topologies. Based on the risk model for individual devices, our assessment mea-sure considers the dependencies between the model layers, and the relations between the devices, to deal with the connectivity in the wireless network. Hence, our risk assessment method ad-dresses the dynamics of the wireless network, and results in ap-plicable evaluation.
We present two examples to prove that our method meets the needs for assessing a wireless network risk. We design several experiments to launch an eavesdropping attack against two sim-ilar wireless networks, Ex1-1 and Ex1-2, where Ex1-1 is unpro-tected, but Ex1-2 is protected by WPA2-PSK. The attack suc-ceeds to sniff the communication sessions in Ex1-1, but fails in Ex1-2 according to the realistic experiments. We obtain the total impact severity of Ex1-1 (4.2120, HIGH risk) and of Ex1-2 (3.1911, LOW risk) by our risk assessment method. The second example shows that our method can handle the changing wire-less topologies. When a device enters or leaves a wirewire-less net-work, we can efficiently re-evaluate the risk of the entire wire-less network without repeating the redundant steps. This ex-ample also shows that our risk assessment method is capable of deriving fine-grained results that distinguish between config-uration disparities of different wireless networks.
We recognize the proposed model and measure serve as merely heuristic, general indicators of security. However, this paper tries to step a little towards the formal evaluation of wireless network risk. Although we do not claim that a smaller value derived from our measure implies a wireless network is necessarily secure against all attacks, we conjecture that small values of our measure are necessary but not sufficient for security. In this regard, the proposed method can still reflect the robustness of wireless networks through the security analysis.
The proposed method provides a reference for an admin-istrator to maintain a secure wireless network. Because the
Fig. 6. Ex1-1.STA successfully captures MSN messages sent to STA by using Wireshark.
Fig. 7. Ex1-2.STA fails to captures MSN messages sent to STA by using Wireshark because the network traffic is protected by WPA2-PSK encryption.
reference is determined based on a great quantity of real-world databases and expert experiences, a holistic risk assessment method should be able to consider the discrepancy between databases or expert opinions. More studies are required to eval-uate the consistency between the data, and to integrate the risk value with the consistency. We hope that our risk assessment method will provide a helpful framework to determine these issues in greater depth.
APPENDIX
To compare the risk value derived by our method with the ground truth, we design several experiments to launch an eaves-dropping attack against two wireless networks, Ex1-1, and Ex1-2. Ex1-1, and Ex1-2 have similar topologies, where one AP and two STAs are within both of the networks. However, Ex1-1 is not protected by any security mechanism, but Ex1-2
is protected by WPA2-PSK encryption. Then we introduce our risk assessment method to determine the risk values of the two networks. The comparison between the risk values and the experimental results demonstrates the applicability and practicability of our method. The experiment environments are shown in Figs. 4 and 5.
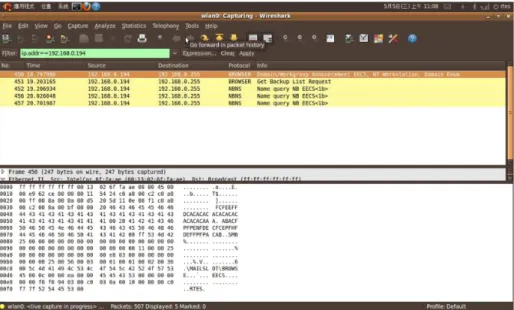
Experiment: Ex1-1
In Ex1-1, there is no security mechanism to protect this wire-less network. is successful in eavesdropping the network traffic by running Wireshark, while is chatting with others by Windows Live Messenger. As shown in Fig. 6, captures 695 packets in total, and 99 packets are displayed due to the fil-tering rule “ip.addr==192.168.0.194 and msnms”. Because we specify this filtering rule, only the MSN messages sent from or sent to 192.168.0.194 ) are exhibited by Wireshark. Ac-cording to Fig. 6, we find whom is chatting with, and what
Fig. 8. Ex1-2. Few packets sent to or fromSTA are captured by STA under the protection of the WPA2-PSK encryption.
they are talking about. In this example, we can easily interpret that ’s friend sends a message “fine!” to them.
Experiment: Ex1-2
The configurations of Ex1-2 are almost the same as those of Ex1-1, except for the security mode used in the network. The same as Ex1-1, is chatting with its friends via Windows Live Messenger, and is monitoring the packets within the network by Wireshark. However, in Ex1-2, because WPA2-PSK encryption is used to protect the traffic, cannot easily sniff the packets which are not sent from or not sent to itself. We use the filtering rule “msnms” to search for the MSN messages being captured, but no packet matches the rule. Fig. 7 shows that fails to obtain any MSN messages. In Fig. 8, we use another filtering rule “ip.addr==192.168.0.194” to display the packets sent to and from . According to the display results, few application packets are shown even though is running Windows Live Messenger.
Risk Assessment Results
In addition to launching the practical eavesdropping attack against Ex1-1 and Ex1-2, we evaluate their risk values to prove that our assessment results match reality. As explained in Section IV-C, we obtain the total impact severity of Ex1-1,
and Ex1-2 respectively such that (HIGH risk),
and (LOW risk). Because there is no security
mechanism in Ex1-1, and the eavesdropping attack succeeds, it is reasonable that the assessment result implies a high risk. Furthermore, it is convincing that the low risk value of fits the realistic situation because the attack fails to monitor the application messages while Ex1-2 is under protection.
REFERENCES
[1] G. Stonebumer, A. Goguen, and A. Feringa, “Risk management guide for information technology systems,” National Institute of Standards and Technology, Special Publication 800-30, 2002.
[2] C. Phillips and L. P. Swiler, “A graph-based system for network vul-nerability analysis,” in Workshop on New Security Paradigms (NSPW
’99), Jan. 1999, pp. 71–79.
[3] O. Sheyner, J. Haines, S. Jha, R. Lippmann, and J. M. Wing, “Auto-mated generation and analysis of attack graph,” in IEEE Symposium
on Security and Privacy, May 2002, pp. 273–284.
[4] L. P. Swiler, C. Phillips, D. Ellis, and S. Chakerian, “Computer-attack graph generation tool,” in Information Survivability Conference &
Ex-position II, June 2001, pp. 307–321.
[5] S. Jha, O. Sheyner, and J. M. Wing, “Minimization and reliability analyses of attack graph,” in Computer Security Foundations
Work-shop, June 2002.
[6] V. Mehta, C. Bartzis, H. Zhu, E. Clarke, and J. Wing, “Ranking attack graphs,” in the 9th International Symposium On Recent Advances In
Intrusion Detection, 2006.
[7] J. Pamula, S. Jajodia, P. Ammann, and V. Swarup, “A weakest-adver-sary security metric for network configuration security analysis,” in the
2nd ACM Workshop on Quality of Protection, 2006, pp. 31–38.
[8] L. Wang, A. Singhal, and S. Jajodia, “Toward measuring network se-curity using attack graphs,” in 2007 ACM Workshop on Quality of
Pro-tection, 2007, pp. 49–54.
[9] L. Wang, A. Singhal, and S. Jajodia, “Measuring the overall security of network configurations using attack graphs,” in the 21st IFIP WG 11.3
Working Conference on Data and Applications Security, 2007.
[10] D. M. Zhao, J. H. Wang, J. Wu, and J. F. Ma, “Using fuzzy logic and entropy theory to risk assessment of the information security,” in the
4th International Conference on Machine Learning and Cybernetics,
Aug. 2005, pp. 2248–2253.
[11] D. Zhao, C. Wang, and J. Ma, “A risk assessment method of the wireless network security,” Journal of Electronics, vol. 24, no. 3, pp. 428–432, May 2007.
[12] National Vulnerability Database [Online]. Available: http://nvd.nist. gov/ Last updated: 05/21/2010. [Online]. Available:
[13] M. Abedin, S. Nessa, E. Al-Shaer, and L. Khan, “Vulnerability analysis for evaluating quality of protection of security policies,” in the 2nd
ACM Workshop on Quality of Protection, Oct. 2006, pp. 49–52.
[14] M. S. Ahmed, E. Al-Shaer, and L. Khan, “A novel quantitative ap-proach for measuring network security,” in the 27th IEEE International
Conference on Computer Communications (INFOCOM 2008), Apr.
2008, pp. 13–18.
[15] E. Al-Shaer, L. Khan, and M. S. Ahmed, “A comprehensive objective network security metric framework for proactive security configura-tion,” in the 4th Annual Cyber Security and Information Intelligence
Research Workshop, May 2008.
[16] L. A. Zadeh, “Fuzzy sets,” Information and Control, vol. 8, pp. 338–353, 1965.
[17] R. Kangari and L. S. Riggs, “Construction risk assessment by linguis-tics,” IEEE Trans. Engineer Management, vol. 36, no. 1, pp. 126–131, May 1989.
[18] S.-H. Wei and S.-M. Chen, “Fuzzy risk analysis based on interval-valued fuzzy numbers,” Expert Systems with Applications, vol. 36, no. 2, pp. 2285–2299, 2009.
[19] Y. Liao, C. Ma, and C. Zhang, “A new fuzzy risk assessment method for network security based on fuzzy similarity measure,” in the 6th
World Congress on Intelligent Control and Automation, June 2006, pp.
8486–8491.
[20] S. J. Chen and S. M. Chen, “Fuzzy risk analysis based on similarity measures of generalized fuzzy numbers,” IEEE Trans. Fuzzy Systems, vol. 11, no. 1, pp. 45–56, 2003.
[21] T. Karygiannis and L. Owens, “Wireless network security: 802.11, bluetooth and handheld devices,” National Institute of Standards and Technology, Special Publication 800-48, 2002.
[22] J. Bellardo and S. Savage, “802.11 Denial-of-Service attacks: Real vul-nerabilities and practical solutions,” in the 12th USENIX Security
Sym-posium (SSYM’03), 2003.
[23] W. A. Arbaugh, N. Shankar, and Y. C. J. Wan, “Your 802.11 wireless network has no clothes,” IEEE Wireless Communications, vol. 9, no. 6, pp. 44–51, Dec. 2002.
[24] D. Welch and S. Lathrop, “Wireless security threat taxonomy,” in IEEE
Workshop on Information Assurance United States Military Academy,
June 2003, pp. 76–83.
[25] Common Vulnerabilities and Exposures [Online]. Available: http://cve. mitre.org/ Last updated: 05/07/2010.
Hsin-Yi Tsai received the B.S., and M.S. degrees in Electrical and Control
En-gineering from the National Chiao-Tung University, Taiwan in 2005, and 2007 respectively. She is currently pursuing the Ph.D. degree at the Institute of Elec-trical Control Engineering of National Chiao-Tung University. Her research in-terests include evaluation of protection techniques, risk assessment of networks, and design of security metrics. Ms. Tsai has been a member of the Phi Tau Phi Society since 2007.
Yu-Lun Huang received the B.S., and Ph.D. degrees in Computer Science, and
Information Engineering from the National Chiao-Tung University, Taiwan in 1995, and 2001, respectively. She has been a member of the Phi Tau Phi Society since 1995. She is now an assistant professor in the Department of Electrical Engineering of National Chiao-Tung University. Her research interests include wireless security, secure testbed design, embedded software, embedded oper-ating systems, risk assessment, secure payment systems, VoIP, and QoS.