Chemical mechanical planarization (CMP) has been widely rec-ognized as the most promising technology to eliminate topographic variation and achieve wafer-level (global) planarization for ultra-large-scale integrated (ULSI) circuits.2-3 Despite its extensive uti-lization, however, the process control of CMP remains at an empiri-cal stage and most users still refer to the Preston equation4as the wafer-scale material removal model. This equation states that the re-moval rate, RR, is proportional to the product of the polish pressure, P, and velocity, V, i.e.
RR5 kpPV [1]
where kpis the Preston coefficient.
Originally proposed for glass polishing, the Preston equation is also of an empirical nature and lacks scientific basis. Uncertainty remains regarding the basic polish behavior. Recent theoretical work and experimental evidence suggest that the Preston equation may overestimate the CMP removal rate.1,5Tseng and Wang1proposed an analytical model that predicts a P5/6V1/2, instead of Preston’s PV dependence of CMP removal rate
RR5 MP5/6V1/2 [2]
where M is the weighting factor to removal rate from other process-es (e.g., slurry attack). Ouma et al.6observed that, depending on the magnitude of the product of pressure and velocity, there exist two regimes of polish operation so that the addition of a constant term to the Preston equation yields a better fit to experimental results. Sim-ilar results have been reported elsewhere.7Overall, the feasibility of Preston equation in describing the CMP removal rate has been chal-lenged and deserves careful and systematic investigation.
Another dilemma associated with the Preston equation is that the definition of V appears vague, since, in an orbital CMP system, the carrier and pad rotate at their respective speeds and the velocity varies from wafer center to edge during polishing. Such a speed variation has been widely observed by most CMP users, and at least two previous studies6,8have analyzed and correlated it with other machine parame-ters and the polish rate. The clarification of the dependence of pressure and velocity on removal rate would be essential to the CMP process control, since, for example, simulation and prediction of topographic evolution or planarization efficiency depends strongly upon an accu-rate removal accu-rate model incorporating P and V.
In this work, efforts will be attempted first to reexamine the def-inition and variation of velocity across a 150 mm wafer during CMP process. Simulation works will follow to investigate the impacts of
velocity variation on polish rate, based on the original Preston equa-tion, Tseng’s model,1and a modified Preston equation which takes into account the deterioration in the abrasion efficiency of slurry. Comparisons (curve fitting) will be made between experimental pol-ish data and the simulated results based on the three models. The pressure dependence of the removal rate models and other parame-ters (e.g., weighting factor) are evaluated. The feasibility of the three models is discussed.
Velocity Simulation
In this study, velocity is defined as the relative velocity (v) be-tween an abrasive particle and a specific point on the wafer, during CMP operation. Several assumptions regarding the movement of wafers and abrasive particles need to be established. First, particles are all embedded in the surface features of pad. In this case, the asperity contact model9is adopted. In this model, particles retained
on the asperity of pad carry out the abrasion action. This suggests that the maximum abrasion capability of particles occurs when par-ticles are embedded on the asperity of pad. Under this circumstance, the velocity of particles is the same as that of the pad. Second, we assume that no slipping and sliding movement occurs between the wafer and carrier during polishing so that the wafer speed is the same as the carrier speed. In addition, the wafer center coincides with the carrier center.
All geometric and machine parameters are constructed based on an IPEC 372M CMP system for 150 mm wafers. Given known pad revolutions per minute (rpm) (vp), wafer rpm (va), and the distance between pad center and wafer center (d), the relative velocity (v) on any specified point on the wafer can be deduced, using the procedure described in the Appendix.
Relative velocities are calculated along the radial direction of a wafer at 13 equally spaced points. From the formulation for v (Eq. A-6 in the Appendix), the relative velocity is found to be a quasi-sinusoidal function of time except at wafer center. The mean velocity vw at a given point i, is defined asi
[3] where T is the total polish time. The nonuniformity of velocity (NUV) can thus be defined as
[4]
where vw is the mean velocity over total polish time T at a given pointi i along the wafer radius, r; and vw is the average value of mean veloc-i
NUV;( / )[ /1 1 ( i ) ]/ ; and ;( / )1 i 1 2 1 2 1 v n v v v n v i n i n 5 5 2
∑
∑
v T v t dt i 0 i T ; 1∫
( )© 1999 The Electrochemical Society. S0013-4651(97)11-028-X. All rights reserved. Manuscript submitted November 12, 1997; revised manuscript received February 4, 1999.
* Electrochemical Society Active Member. zE-mail: [email protected]
ity over n (n5 13) points. The nonuniformity of velocity defined in Eq. 4 represents the degree of variation in the average velocity, vwi
along the radius of a wafer. The difference in the average velocity between wafer center and edge can enlarge the degree of nonunifor-mity of velocity. In case vw all over a wafer are exactly the same, thei
NUV diminishes and the traces of abrasive particles are the same across the wafer.
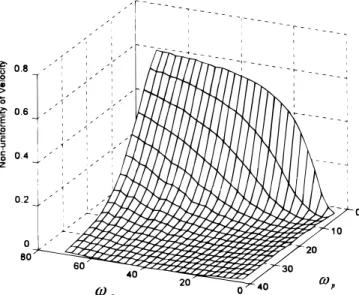
The nonuniformity of relative velocity across a wafer is plotted against carrier (va) and platen (vp) rpms in Fig. 1 for d5 15 cm. The
result indicates that NUV can be minimized by applying a low car-rier speed and a high platen speed simultaneously. Setting a greater d also helps reduce NUV as can be seen in Fig. 2 and 3. Comparison of Fig. 2 and 3 also suggests that (vp) has a more pronounced effect
on NUV than does (va). On the other hand, NUV remains low over
wide ranges of vaand d, but increases abruptly at both low and high
carrier speeds, as shown in Fig. 3. The above finding that vpis more
influential than vain determining NUV has also been reported in at
least one previous study.9
Note that the NUV considered herein may not necessarily corre-spond to the nonuniformity of removal rate, since the latter is a much more complex function of many other factors. Wafer warpage, back pressure, the type of carrier design, pad surface feature, and slurry hydrodynamics, to name a few, all affect removal rate uniformity to certain extent.
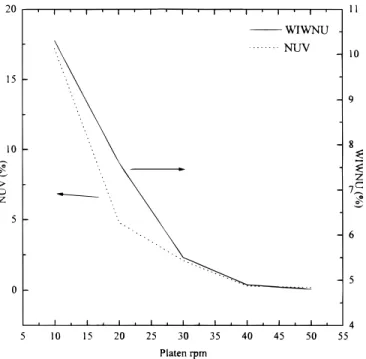
To compare the calculated NUV with within-wafer polish non-uniformity (WIWNU), polish experiments were performed on a 1mm thick thermal oxide grown on 150 mm wafers. The WIWNU presented here was defined similarly as in Eq. 4 averaged over those obtained from five wafers. On each wafer, removal rates were meas-ured at 49 points evenly across the wafer. A 5 mm edge exclusion was applied to the determination of both NUV and WIWNU. The NUV and WIWNU thus calculated are plotted against pad rpm in Fig. 4 under default conditions of va5 42 rpm, d 515 cm, P 5 7 psi
and back pressure 5 2 psi. Although no one-to-one match exists between NUV and WIWNU, the trend is clear. WIWNU decreases as NUV decreases. At low vp, the larger relative velocity at wafer
edge may have been offset by, for example, the wafer bow effect, leading to a higher pressure at the center and the resulting lower WIWNU than NUV. At high vp, on the other hand, uneven slurry
abrasive particle distribution and the persisting wafer bow effect may have contributed to the higher-than-expected WIWNU, despite the minimal difference in relative velocity between the wafer center and the edge.
Modak et al.10evaluated removal rate and its nonuniformity as a function of the carrier-to-pad rpm ratio (va/vp). Their findings
indi-cated that the increase of the va/vpratio over ,1.14 resulted in a
remarkable increase in WIWNU. In the current study, the NUV data in Fig. 1 and 2, and the WIWNU data in Fig. 4 all exhibit a similar trend. Another important factor to consider is the distance, d, be-tween the wafer center and the pad center. Based on the simulation results in Fig. 2 and 3, the combination of a high pad rpm, a medi-um wafer rpm, and a large pad-to-wafer distance should give rise to a minimum nonuniformity of velocity. Overall, the findings from the above simulation can serve as general guidelines for improving re-moval rate uniformity under a well controlled polish condition.
The V1/2dependence of removal rate in Eq. 2 has been verified experimentally.1However, in that study, the V term was meant to represent carrier rpm. Thus, the observation that platen is more influ-ential than carrier on the velocity nonuniformity renders it necessary to further clarify the correlation between the V and the RR, based on a more precise definition of velocity. Since velocity actually varies from point to point on a wafer, relative velocity between abrasive
Figure 1. The correlation between NUV,va, and vp. The distance between wafer and pad centers, d, is set at 150 mm.
Figure 2. NUV vs. vpand d. va5 60 rpm.
particles and a specific point (e.g., wafer center) on the wafer is used in order to truly reflect the removal rate variation.
Degradation of Abrasives during Polishing
Down pressure and velocity are the two most influential process parameters in determining CMP polish characteristics. So far, most of the removal rate models consider pressure and velocity as the most important attributes to removal rate. The role of pressure has been perceived as to force the indenters (abrasives) into the wafer surface.11On the other hand, velocity represents the shearing rate of
the abrasives that plow across the wafer surface, and the rate at which the polish residues get transported away by the flowing slur-ry.12Deviation of removal rate from linear behavior with both
pres-sure and velocity has been observed, and a P5/6V1/2dependence of
removal rate is suggested, as mentioned previously.
From another perspective, the deviation of removal rate from lin-ear behavior can be perceived alternatively as the reduction in the number of, or the gradual degradation in the shearing capability of, effective abrasive particles. Mulhearn and Samuels13introduced the
concept of fractional available cutting points, fn, and related it to the removed mass in the formulation of an abrasive machining model. In order to reflect the true abrasive characteristics, the deterioration of abrasion capability should be considered. Abrasives may be worn out gradually during repeated traverses, resulting in deterioration of polishing efficiency.
In a recent study, Zhong and Yang reported that particle aggrega-tion on the pad surface is directly responsible for removal rate de-cay.14It was experimentally verified that the aggregated slurry
abra-sive particles filled up the pores on pad surface, resulting in the dete-rioration in abrasion capability.
On both accounts, such a deterioration behavior can be described in form of exponential decay
fn5 fo?e2an [5]
where fois the fraction of effective abrasion points in an unused
slur-ry,a is the degradation coefficient, and n is the number of traverses. This deterioration phenomenon can not be underrated in a CMP pol-ish model. At the wafer edge where the slurry is fed freshly to the pad/wafer interface, the abrasives would have high abrasion capabil-ity. As the slurry flows toward the wafer center, the particles are more likely to aggregate, reducing their abrasion capability and mean velocity. In addition, the longer the particles travel per unit time (i.e.,
the three models above with the relative velocity was performed at the wafer center (point A), halfway between the wafer center and edge (point B), and the wafer edge (point C, 75 mm away from wafer center), using MATLAB software. All machine parameters were based on a Westech 372M CMP system for 150 mm wafers. To ver-ify the feasibility of the three models, CMP experiments were con-ducted with 1 mm thick thermal oxide wafers. The following machine parameters were used for polish experiments: d5 180 mm, va5 42 rpm, vp5 10-50 rpm. During experiments, the pressure, P
was varied from 4 to 9 psi in order to examine the intercorrelation between pressure and relative velocity, and its effects on removal rate. The pad rpm and its corresponding relative velocity at points A, B, and C are listed in Table I for comparison.
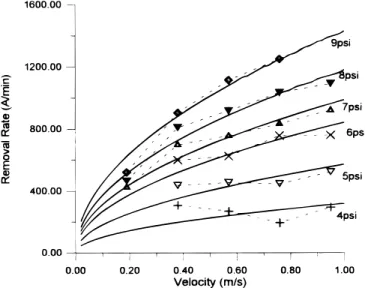
Theoretical removal rates at point A are plotted against the rela-tive velocity, based on the original Preston equation (Eq. 1), Tseng’s model (Eq. 2), and the modified Preston equation (Eq. 7) in Fig. 5, 6, and 7, respectively. A cost function, Co, which is an optimization method, is defined in order to calculate the weighting factors (kp, M, and kc)
[8]
where m is the number of experimental (velocity) conditions, RR(vj) is the calculated removal rate based on the model under consideration, and RRe(vj) is the experimental removal rate. The cost function can also be used to evaluate the match between experimental data and the-oretical prediction by introducing the average value of cost, Cwo
[9] where w 5 6 is the number of pressure condition. Cworepresents the
average degree of fit for the six curves under different pressures, based on the specific model under consideration.
The Cwovalues for all three models are shown in Fig. 8, which
indicates clearly that Tseng’s model and the modified Preston equa-tion proposed in the present study exhibit a much better match with
Co 5( / )1 w
∑
Coq (q54−9) Co m RR v RR v j m 5 2 5 ( / )1 [ ( ) ( )] 1 2∑
j e jFigure 4. NUV and WIWNU as a function of vp. va5 42 rpm; d 5 150 mm.
Table I. Conversion of vpinto relative velocity at the wafer center (point A), halfway between center and edge (point B) and wafer edge (point C). The vais fixed at 42 rpm. The distance between wafer and pad centers, d, is set at 180 mm.
Platen Velocity (m/s) speed (rpm) A B C 10 0.1900 0.2040 0.2660 20 0.3800 0.3834 0.3960 30 0.5700 0.5708 0.5733 40 0.7600 0.7601 0.7601 50 0.9500 0.9501 0.9507
the experimental results than the original Preston equation. This trend is even more distinct at high pressures as the Cwovalues for
Pre-ston equation increase dramatically with increasing pressure. Con-versely, for the other two models, the average value of cost is virtu-ally independent of the applied pressure. Since all three models pre-scribe the similar pressure dependence of removal rate, the large Cwo values of the original Preston equation, i.e., the large fitting error, would very likely be the consequence of the inadequate velocity term in Eq. 1.
The same procedure is repeated for points B and C. The calcu-lated average value of cost at the three wafer locations for the three models are summarized in Table II. Again, the modified Preston equation exhibits the lowest Cwovalues, suggesting the best fit with experimental data. Tseng’s polish rate model also gives low cost val-ues. The original Preston equation, on the other hand, yields Cwo
val-ues that are one order of magnitude higher than the previous two models. Note that, among the three removal rate models considered, only Tseng’s model predicts a P5/6dependence of removal rate as described in Eq. 2. This may be the potential source of greater fitting error associated with Tseng’s model, relative to the modified Preston
equation. Since the difference is slim and the fitting error (i.e., Cwo) does not widen with increasing pressure as Fig. 8 indicates, we believe that the difference in velocity term is the main attribute to the variation in Cwo among the three models. However, whether the removal rate does exhibit a linear dependence on pressure deserves further theoretical as well as experimental work to verify it.
Note in Table II that at the wafer edge (point C) where the edge effect14occurs, the Preston equation exhibits the poorest fit relative
to points A and B, while the other two models seem unaffected by this effect. This may not be attributed to the pressure distribution at the edge as one study pointed out,15since both the original and the
modified Preston equations prescribe the same functional depen-dence of removal rate on pressure. Instead, it would most likely result from the relative velocity and slurry flow characteristics on the edge, in the way described in Eq. 2 and 7. This point is elaborated later.
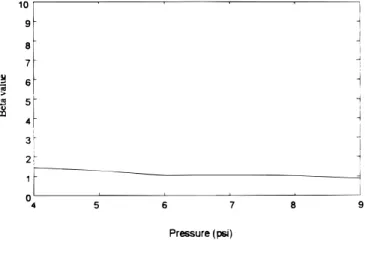
The deterioration coefficient.—The calculated b values are dis-played in Fig. 9a-c for points A-C. b is virtually a constant (1.01) at the wafer edge over the pressure range studied. It increases gradual-ly and exhibits greater variation (up to 35%) as the point moves toward the wafer center. The mean b values at points A and C differ by 47%. For comparison, in a separate polish experiment with d5 10.0 cm, the mean b values differ by 69% between the wafer center
Figure 5. Curve fitting between experimental (dashed) and theoretical (solid)
removal rates based on the original Preston equation in Eq. 1.
Figure 6. Curve fitting between experimental (dashed) and theoretical (solid)
removal rates based on the Tseng’s model in Eq. 2.
Figure 7. Curve fitting between experimental (dashed) and theoretical (solid)
removal rates based on the modified Preston equation in Eq. 7.
Figure 8. The calculated values of cost, Cwo, for the three models as a func-tion of pressure at wafer center.
varies in a range within the standard deviation (,0.29) and is con-sidered a constant. Such a pressure dependence seems contradictory to our intuition, since, under a greater down force, an accelerated polish rate, and hence, faster abrasive degradation would be expect-ed. It is possible that the slurry flow at the wafer center is more ran-dom and less regulated under a lower pressure, due to, for example, wafer warpage and insufficient back pressure. As a consequence, the abrasion action is retarded, giving rise to a higher deterioration coef-ficient. An indirect support for this point is the higher Cwovalues
(greater deviation between experiment and simulation) at the wafer center, as shown in Table II.
The weighting factors.—The calculated kp, M, and kcfactors for
the three models over the pressure range investigated are shown in Fig. 10a, b, and c, respectively, for wafer points A, B, and C. All three weighing factors are highest in magnitude at the wafer edge
chemical reaction rate with time during polishing.
The positional variation of weighting factor is somewhat difficult to justify. It could not be the result of wafer warpage and uneven slurry flow, since all three models are equally prone to these effects. It implies that the chemical erosion rate is slightly more intensive at the wafer edge than at its center, while the reverse is true for its pres-sure dependence. More work related to the fluid behavior is needed to clarify this point.
Pad speed vs. relative velocity.—To evaluate and compare the role of pad speed in the three models with regard to the relative velocity, simulation and curve fitting are repeated for the three models with the V term replaced by vp, the pad rpm. The value of cost for the three models calculated at wafer center in this case is plotted against pres-sure in Fig. 11. Similar to the results in Fig. 8 and Table II, the orig-inal Preston equation yields Cwovalues that are one order of
magni-Figure 9. The calculated deterioration coefficient,b, as a function of
pres-sure at (a, top left) wafer center; (b, above) halfway between wafer center and edge; and (c, left) wafer edge.
tude higher than for the other two models. The calculated weighting factors are shown in Fig. 12 for the three models. Again, the trend is similar to that displayed in Fig. 10. The M factor in Tseng’s model is
a pressure-dependent quantity, while the kpand kcfactors for the
orig-inal and modified Preston equations, respectively, remain virtually unchanged over the pressure range investigated.
Discussion
The low average values of cost of Eq. 7 justify the feasibility of this newly modified removal rate model. Tseng’s model also exhibits a good match with experimental data. Relatively speaking, the Pre-ston equation is inaccurate in predicting the CMP removal rate as a function of pressure and velocity. The deterioration in the cutting efficiency of abrasives or the deceleration of chemical reaction rate may explain the saturation of removal rate with increasing velocity. Such a polish behavior is obeyed more faithfully at the wafer edge than wafer center. This may arise from the fact that the abrasive sup-ply and slurry flow are more uniform at the wafer edge than at the wafer center. The insensitivity of Tseng’s model and the modified Preston equation to the edge effect (rise in polish rate at the edge) may result from the slurry transport characteristics at the edge. In the Tseng model, the velocity term (V1/2) is perceived as the rate at
which the polish residues get transported away from the abraded points. In the modified Preston equation, an exponential term is in-cluded to characterize the deterioration of abrasives with time
Figure 10. The calculated weighing factors, kp, M, kc, respectively, for the original Preston equation, the Tseng’s model, and the modified Preston equa-tion vs. pressure at (a) wafer center; (b) halfway between wafer center and edge; and (c) wafer edge.
Figure 11. The calculated values of cost, Cwo, for the three models as a func-tion of pressure at wafer center. The velocity is defined vp.
Figure 12. The calculated weighting factors for the three models as a
original Preston equation, too, exhibits such a phenomenon. Howev-er, for the modified Preston equation in Eq. 4, kcis essentially a
con-stant throughout the pressure and velocity ranges investigated. Based on the data presented in this study, it is still too early to judge if this parameter is a constant or a process-dependent variable. The argu-ment that the b factor may have accounted for the variation in the chemical process requires more experimental evidence to verify it.
The fact that removal rates based on pad speed fit equally well to Tseng’s model and the modified Preston equation further demon-strates the feasibility and usefulness of the two models. In addition, it justifies the common belief that pad rpm is more influential on pol-ish behavior. In an orbital CMP system, the relative velocity can be best represented (or approximated) by the pad rpm. However, atten-tion must be paid to the relative size of wafer to pad and the wafer-to-pad distance d. More influence from the vawill be felt on the rel-ative velocity as the wafer-to-pad size ratio increases. Also, accord-ing to our simulation there is less room for modifyaccord-ing the nonuni-formity through the adjustment of d, since d has shrunk in this case.
Still more work is ahead for a robust control of CMP process to be realized. One area of future research is the root of pressure distri-bution and the effects it would bring about on removal rate and WIWNU. This should include the mechanical interaction between, at least, the pad, the curved wafer (wafer warpage), and the back pressure. Initial results in our lab indicated that calculated pressure profile across the wafer matches closely to the experimental removal rate variation, when fitted to Tseng’s model and the modified Pre-ston equation proposed in this study.16More experimental work is
undergoing to investigate this issue.
Another subject worth pursuing is the behavior of slurry (fluid) under pressure and velocity, and the distribution of the abrasive par-ticles within it. Given the extremely thin layer and, very likely, the multiphase flow nature of the fluid, this task would be quite chal-lenging. Adding to this difficulty is the complex surface feature of pad and how it directs the flow of slurry. Information obtained from the above-mentioned study would reveal more information on the nature of within wafer nonuniformity and help gain more insight into the physical process involved in the characterization of the deterio-ration coefficient b in this study.
Conclusion
In this study, the kinematics during chemical mechanical polish-ing are investigated. Nonuniformity of relative velocity is simulated. A greater distance between wafer and pad centers can help reduce velocity nonuniformity. A longer travel distance would result in par-ticle aggregation and degradation of abrasion efficiency, manifested by a saturation of removal rate with increasing velocity. Relative velocity between the wafer and the abrasive is more adequate in describing the removal rate and removal rate nonuniformity during CMP, although pad speed can be used also as an approximation for it in an orbital CMP system. The Preston equation is inadequate in describing the polish rate as a function of velocity. Instead, a modi-fied Preston equation incorporating abrasive deterioration behavior
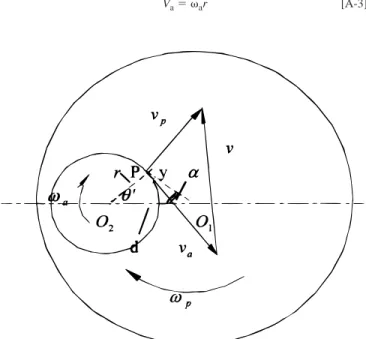
process is shown in Fig. A-1. The following procedure is used to formulate the relative velocity. From the triangle sine theorem, the relationship between angles u9 and a can be expressed as
or
[A-1] where a is the angle between Ow and O1P w2O1,u9 5 the angle between Ow2O1 and Ow, d is the distance between the pad center O1P 1and wafer center O2, and r is the distance between a designated point P on the wafer and wafer center O2.
Applying the triangle sine theorem again, the distance between P and pad center, y, can be solved as
or
[A-2] Finally, solving for the relative velocity, v; the velocity of the wafer (Va), the velocity of the pad (Vp), and the angle between them F, can be ex-pressed as Va5 var [A-3] y5 u9 d u9 1 a sin sin ( ) y d sinu5sin (u9 1 a) a 5 2 u9 u9 2 cot cos sin 1
( )
dr r d sina5sin (u 1 a)Figure A-1. The schematic showing the relative velocity between wafer
Vp5 vpy [A-4]
F 5 p 2 (u9 1 a) [A-5] from which the absolute value of relative velocity can be formulated
[A-6] where vaand vpare angular velocities (rpm) of the wafer and pad, respec-tively, and t is the time elasped.
References
1. W.-T. Tseng and Y.-L. Wang, J. Electrochem. Soc., 144, L15 (1997). 2. I. Ali, S. R. Roy, and G. Shinn, Solid State Technol., 37, 63 (1994). 3. F. Preston, J. Soc. Glass Technol., 11, 247 (1927).
4. P. H. Singer, Semicond. Int., 15, 44 (1992).
5. F. Zhang and A. Busnaina, Electrochem. Solid-State Lett., 1, 184 (1998). 6. D. Ouma, C. Oji, D. Boning, and J. Chung, in Proceedings of the 3rd
Internation-al ChemicInternation-al MechanicInternation-al Planarization for ULSI Multilevel Interconnection Con-ference (CMP-MIC), p. 20, Santa Clara, CA (1998).
7. Q. Luo, M. A. Fury, and S. V. Babu, in Proceedings of the 3rd International
Chem-v 5 Vp 1Va 2 V Vp? a cos[p 2 u 1 a( )] and u9 5 v ?at 2 2 1 2 2 /
ical Mechanical Planarization for ULSI Multilevel Interconnection Conference (CMP-MIC), p. 83, Santa Clara, CA (1997).
8. W. T. Tseng, in Advanced Metallization and Interconnect Systems for ULSI Appli-cations in 1997, R. Cheung, J. Klein, K. Tsubouchi, M. Murakami, and N. Kobayashi, Editors, p. 617, MRS Conference Proceedings, Materials Research Society, Pittsburgh, PA (1998).
9. T. K. Yu, C. C. Yu, and M. Orlowski, Tech. Dig. Int. Electron Devices Meet., 35.4.1 (1994).
10. A. Modak, P. Monteith, and N. Parekh, in Proceedings of the 2rd International Chemical Mechanical Planarization for ULSI Multilevel Interconnection Confer-ence (CMP-MIC), p. 169, Santa Clara, CA (1997).
11. L. Cook, J. Non-Cryst. Solids, 120, 152 (1990).
12. W.-T. Tseng, C.-W. Liu, B.-T. Dai, and C.-F. Yeh, Thin Solid Films, 290-291, 458 (1996).
13. T. O. Mulhearn and L. E. Samuels, Wear, 5, 478 (1962).
14. L. Zhong and J. Yang, in Chemical Mechanical Planarization, S. Raghavan, R. L. Opila, and L. Zhang, Editors, PV 98-7, p. 197, The Electrochemical Society Pro-ceedings Series, Pennington, NJ (1998).
15. A. R. Baker, in Chemical Mechanical Planarization, I, I. Ali and S. Raghavan, Edi-tors, PV 96-22, p. 228, The Electrochemical Society Proceedings Series, Penning-ton, NJ (1997).
16. W.-T. Tseng, L.-C. Kang, and W.-C. Pan, in Proceedings of the 3rd International Chemical Mechanical Planarization for ULSI Multilevel Interconnection Confer-ence (CMP-MIC), p. 87, Santa Clara, CA (1998).