2014 International Conference on Earth Observations and Societal Impacts (2014 ICEO&SI), JUNE 22-24, Miaoli. Taiwan PAPER No.:
High-resolution observation of atmospheric layer
structures using multi-frequency range imaging
Jenn-Shyong Chen
1, Yen-Hsyang Chu
2, and Ching-Lun Su
21Department of Information and Network Communications, Chienkuo Technology University, Taiwan, 500, [email protected] 2Institute of Space Science, National Central University, Taiwan, 320, [email protected],
ABSTRACT
The pulsed atmospheric radar has a finite range resolution that is subjected to the radar pulse length and receiver filter bandwidth. To observe the small-scale structures within the pulse-defined range extent, range imaging (RIM) using a set of transmitter frequencies has been employed. The transmitter frequencies of RIM are transmitted sequentially during each radar pulse, and the radar returns at different transmitter frequencies are received, respectively. With adaptive retrieval algorithms such as the Capon method for the radar returns, it is capable of resolving the echoing structures at meter scale in the range direction. Observations with RIM have disclosed thin layers that exist frequently in the lower atmosphere, and many of the thin layers appear in pairs. Such kind of double-layer structure can not be resolved with conventional single-frequency radar techniques. This paper shows plenty of single and double-layer structures observed by Chung-Li VHF atmospheric radar to demonstrate the capability of RIM in finding small-scale variations of atmospheric structures.
I. INTRODUCTION
Plenty of atmospheric radars at various frequency bands have been employed to monitor the neutral and ionized atmosphere for different purposes of researches. For example, high frequencies (HF) between 3 MHz - 30 MHz are employed to measure the electron density in the ionosphere (>60 km); ultra-high frequencies (UHF) ranging from 300 MHz to 3 GHz can be applied to the examination of precipitation and wind field in the lower atmosphere. To cover a larger altitudinal region above earth surface, very-high-frequency (VHF) band has been employed. VHF radar for the atmosphere is usually constructed with antenna array for the capability of steering the radar beam to different directions by phase control of the signal at each antenna. The echoes of VHF atmospheric radar arise mainly from the fluctuations of refractive index in the clear-air, but the echoes from precipitation in the troposphere and plasma irregularities in the mesosphere/ionosphere can also be received.
VHF atmospheric radar is a kind of pulsed radar, giving a finite range resolution of measurement. That is, the small-scale structure within the pulse-defined range extent (a sampling gate) cannot be disclosed. In view of this, the technique of range imaging (RIM) with several transmitter frequencies was developed to resolve the thin layer and turbulence structures in the sampling gate, yielding a higher range resolution of measurement at meter scale.
In this paper, the range-imaging technique implemented in the Chung-Li VHF radar is introduced (24.9oN, 121.1oE;
Taiwan), which has observed plenty of high-resolution layer structures. Double-layer structure will be discussed in more detail for demonstrating the advantages of range imaging.
II. INSTRUMENT AND METHOD
A. Chung-Li VHF Radar
The Chung-Li VHF radar is operated at the central frequency of 52 MHz. Three sets of antenna arrays have been constructed for observations of neutral atmosphere in the stratosphere and troposphere (denoted as ST briefly), plasma irregularities in the mesosphere/ionosphere, and meteor tail, respectively. The first usage of the Chung-Li VHF radar for range imaging was carried out in 2008 [1] with the ST array. The present radar returns were collected on 9 Nov, 2009, and the process of RIM was based on the successful calibrations of phase and range-weighting effect on the radar returns made by [1]. Seven transmitter frequencies at 51.5, 51.6, 51.75, 52, 52.2, 52.25, 52.5 MHz were used with 1-s pulse length. The pulse shape was in Gaussian form, and the receiver filter bandwidth was 1 MHz. The sampling time of data for each transmitter frequency was ~0.18 s.
B. Range Imaging with Mutiple Frequencies
The RIM technique using several transmitter frequencies was first introduced to the atmospheric radar community by [2], and has been implemented in UHF and VHF radars successfully [3][4]. With RIM, the power distribution (or brightness distribution) in the range direction can be retrieved with inversion algorithms such as the Capon method [2][5]. The inversion processing can be made in both time and frequency domains [2]. For simplicity, the Capon method in the time domain was employed in this study. As a result, the echoing structures at different Doppler velocities are not exposed separately. The power distribution (P) as a function of range (r) is estimated as e R e 1 1 ) ( Pr H , (1)
This work was supported by the National Science Council of ROC (Taiwan), grant no. NSC102-2111-M-270-001.
2014 International Conference on Earth Observations and Societal Impacts (2014 ICEO&SI), JUNE 22-24, Miaoli. Taiwan PAPER No.: where nn n n n n R R R R R R R R R ... . . . . ... ... 2 1 2 22 21 1 12 11 R , (2) e=[ ej2k1r, ej2k2r,…, ej2knr ]T. (3) The superscripts H, -1, and T represent, respectively, the Hermitian, inverse, and transposition operators of the matrices.
kn is the wavenumber of the n-th transmitter frequency. Rmn is
the non-normalized cross-correlation function of two data sets calculated at zero-time lag for a pair of transmitter frequencies. Vector e is the “range steering vector”, obtained by resolving the constrained optimization problem [6][7].
In practical data analysis, two calibrations are essential: (1) correct the phase biases of signals at various transmitter frequencies, and (2) mitigate the range-weighting effect on the brightness value. We have followed the calibration process given in [1] and [8] for the Chung-Li VHF radar.
III. OBSERVATIONS AND DISCUSSION
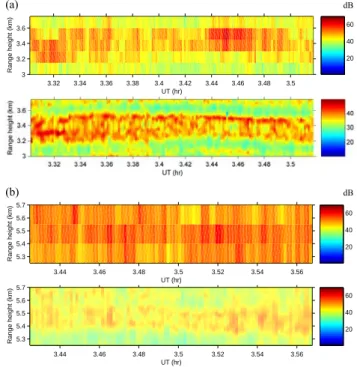
Fig. 1 displays the high-time intensity (RTI) and range-time brightness distribution, with range resolutions of 150 m and 1 m, respectively. Owing to the coarser range resolution, the high-time intensity plot can only indicate some echoing regions at altitudes of below 2.5 km, between 3 km and 4 km, and between 3.5 km and 6 km. By contrast, the brightness distribution discloses plenty of thin layer structures in the echoing regions, demonstrating the benefit of RIM to the observation of atmospheric structures. Some of these thin layers appear in pairs; for example, around the heights of 3.3 km and 5.5 km, before 04:00 UT. Magnified plots of the two cases between limited time intervals are shown in Fig. 2. In Fig. 2a, the RTI shows only a thick echoing region between 3.2 km and 3.6 km, but the RIM reveals fine structures in the echoing region, where a two-layer structure can be seen clearly. The turbulent structures within the two-layer structure resemble in the billows caused by Kelvin-Helmholtz instability (KHI). Also, Fig. 2b presents a similar feature to the KHI billows although it is not as clear as in Fig. 2a.
The KHI billows is related to a vertically-sheared wind field [9], which have been observed frequently by continuous-wave or pulsed radar at UHF or higher frequency bands [9]-[11]. It is more difficult to reveal the KHI billows directly with VHF atmospheric radar because of coarser range resolutions (>150 m). With assistance of RIM, however, excellent examples of thin layers and fine structures have been demonstrated by [1][8][12][13] with VHF atmospheric radar. Fig. 3 illustrates schematically the formation of KHI billows and double-layer structure. In the beginning, an unperturbed layer is corrugated by atmospheric waves. Because of wind shear, the wavy layer is then distorted and the wave hump is tilted to the leeward direction, as shown in the second stage. The refractivity irregularities on the leeward side of the
distorted wavy layer mix up gradually due to overturn of the layer, leading to decreased fluctuation of refractive index for the radar wave. As a result, the radar echoes from the leeward side of the wavy layer become weaker than that from the windward side. In the third stage, the wavy layer is severely distorted to form the structure similar to cat’s eye; the refractive index irregularities within the cat’s eye have mixed up well, causing a lack of radar echo within the cat’s eye sometimes. The structure of cat’s eye will be stretched out gradually due to sustained force of wind shear, and then sloping filaments occur, as shown between the third and forth stages. Eventually, the sloping filaments merge to form two split layers. The gradient of refractive index in the two split layers is much larger than that between the two layers, giving strong radar echoes to form a double-layer structure. In Fig. 2 we can see double-layer structure, quasi-cat’s eye, and the sloping filaments (occurring around 3.42 h). Note the opposite sloping directions of filaments in Fig. 2 and Fig. 3. In Fig. 2, the echoing structures come into the frame from right side, meaning the wind direction is leftward. On the contrary, the wind direction in Fig. 3 is given rightward, resulting in the sloping filament opposite to that observed in Fig. 2.
Another potential interpretation of the double-layer structure was given by [14]. It was proposed that the turbulent layer have refractivity irregularities with different degrees of anisotropism within and at the boundaries of the layer. That is, the anisotropism of refractivity irregularities at upper and lower boundaries of the turbulent layer is higher than that in the interior part of the layer, yielding the echo layers appearing in pairs in radar observations.
IV. CONCLUSIONS
Multi-frequency range imaging (RIM) has been validated for the Chung-Li VHF atmospheric radar. Small-scale structures of refractive index in turbulence or layer morphology within the sampling gate can thus be detected. With the high-resolution capability of RIM in resolving small-scale structures, many atmospheric phenomena such as dynamic mechanisms of turbulence and wave, frontal evolution, precipitation, typhoon, and so on, can be examined in more detail.
It is highly expected to implement the RIM technique in the UHF radars of wind profiler network or at airport for observation of atmospheric boundary layer in the troposphere. Detection of turbulence and layer structures can be of help to the study of dynamic atmosphere such as the effect of upward atmospheric waves/disturbances on the upper atmosphere (stratosphere, mesosphere and ionosphere). At the airport, the turbulent structures in the lower atmosphere could be as important as wind shear for safe takeoff and landing of the aircraft.
ACKNOWLEDGMENT
This study was supported by the National Science Council of ROC (Taiwan), grant no. NSC102-2111-M-270-001. The Chung-Li VHF radar is maintained by the Institute of Space Science, National Central University, Taiwan.
2014 International Conference on Earth Observations and Societal Impacts (2014 ICEO&SI), JUNE 22-24, Miaoli. Taiwan PAPER No.: 3.5 4 4.5 5 5.5 2 3 4 5 6 7 UT (hr) Range height (km) 10 20 30 40 50 60 3.44 3.46 3.48 3.5 3.52 3.54 3.56 5.3 5.4 5.5 5.6 5.7 UT (hr) Range height (km) 20 40 60 3.32 3.34 3.36 3.38 3.4 3.42 3.44 3.46 3.48 3.5 3 3.2 3.4 3.6 UT (hr) Range height (km) 20 40 60 3.44 3.46 3.48 3.5 3.52 3.54 3.56 5.3 5.4 5.5 5.6 5.7 UT (hr) Range height (km) 20 40 60 REFERENCES
[1] J.-S. Chen, C.-L. Su, Y.-H. Chu, G. Hassenpflug, and M. Zecha, “Extended application of a novel phase calibration method of multiple-frequency range imaging to the Chung-Li and MU VHF radars,” J. Atmos. and Oceanic Technol., vol. 26, pp. 2488-2500, November 2009. [2] R. D. Palmer, T.-Y. Yu, and P. B. Chilson, “Range imaging using
frequency diversity,” Radio Sci., vol. 34, pp. 1485–1496, 1999. [3] P. B. Chilson, T.-Y. Yu, R. G. Strauch, A. Muschinski, and R. D.
Palmer, “Implementation and validation of range imaging on a UHF radar wind profiler,” J. Atmos. Oceanic Technol., vol. 20, pp. 987–996, 2003.
[4] H. Luce, G. Hassenpflug, M. Yamamoto, and S. Fukao, “High-resolution vertical imaging of the troposphere and lower stratosphere using the new MU radar system,” Ann. Geophys., vol. 24, pp. 791–805, 2006.
[5] J. Capon, “High-resolution frequency-wavenumber spectrum analysis,” Proc. IEEE, vol. 57, pp. 1408-1418, 1969.
[6] D. G. Luenberger, “Linear and nonlinear programming,” Addison-Wesley, Reading, Mass., 1984.
[7] R. D. Palmer, S. Gopalam, T.-Y. Yu, and S. Fukao, “Coherent radar imaging using Capon’s method,” Radio Sci., vol. 33, pp. 1585-1598, 1998.
[8] J.-S. Chen and M. Zecha, “Multiple-frequency range imaging using the OSWIN VHF radar: Phase calibration and first results,” Radio Sci., vol. 44, RS1010, 2009.
dB
.
[9] K. A. Browning and C. D. Watkins, “Observations of clear air turbulence by high power radar,” Nature, vol. 227, pp. 260-263, 1970. [10] E. E. Gossard, D. R. Jensen, and J. H. Richter, “An analytic study of
tropospheric structure as seen by high-resolution radar,” J. Atmos. Sci., vol. 28, pp. 794-807, July, 1971.
[11] H. Ottersten, “Atmospheric structure and radar backscattering in the clear air,” Radio Sci., vol. 4, pp. 1179-1193, December 1969. [12] H. Luce, G. Hassenpflug, M. Yamamoto, M. Crochet, and S. Fukao,
“Range-imaging observations of cumulus convection and Kelvin-Helmholtz instabilities with the MU radar,” Radio Sci., vol. 42, RS1005, doi:10.1029/2005RS003439, 2007.
[13] H. Luce, G. Hassenpflug, M. Yamamoto, S. Fukao, and K. Sato, “High-resolution observations with MU radar of a KH instability triggered by an inertia-gravity wave in the upper part of a jet stream,” J. Atmos. Sci., vol. 65, pp. 1711-1718, 2008.
[14] R. F. Woodman and Y.-H. Chu, “Aspect sensitivity measurements of VHF backscatter made with the Chung-Li radar: Plausible
mechanisms,” Radio Sci., vol. 24, pp. 113-125. 1989.
(a) dB
(b) dB
Figure 1. (upper) High-time intensity and (lower) range-imaging plot.
Figure 2. KHI billows and double-layer structure. (a) and (b) are two cases shown in Fig. 1. Both high-time intensity (upper) and range-imaging plot (lower) are shown for each case.
I II III IV Figure 3. Schematic plot of formation of KHI billows and double-layer structure in a wind-sheared atmosphere. The dash-arrowed lines indicate horizontal wind. I, II, III, and IV point out the four stages of the distortion in the layer.