Probability Model and Replica Allocation Methods in a Multimedia Mobile Learning System
6
0
0
全文
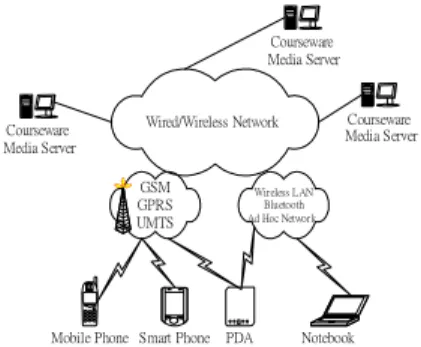
(2) Int. Computer Symposium, Dec. 15-17, 2004, Taipei, Taiwan.. SRAM (static replica allocation method) and DRAM. accessibility. The mobile host can access the needed. (dynamic replica allocation method) to improve the. data items from any connected mobile hosts with the. media access probability. Examples are shown and. data items replicated in it. However, the successful. elaborated to demonstrate the applicability of the. probability may be different to access the data items. proposed algorithms.. from local or remote nodes. This is not discussed in. The rest of the paper is organized as follows. In. [4]. Moreover, Hara supposed that every node can. the next section, a survey of related research works is. replicate any data item in its memory. But, in a real. given. Section 3 describes our proposed probability. mobile learning system, some media servers may be. model and gives an illustrated numerical example.. static and some private mobile hosts may disagree to. Two replica allocation methods and illustrated. replicate any other media in it. Both of the above. numerical examples are presented in section 4.. considerations will be studied in our proposed replica. Section 5 demonstrates the efficiency of the proposed. allocation methods.. replica allocation methods through a simulation study. We provide concluding remarks in section 6.. 3. Media Access Probability Model In this section, we propose a MAP (Media Access. 2. Related Work. Probability) model to evaluate the probability of successful courseware media access in a multimedia. In the literatures, most papers focus on the project design and implementation of a mobile learning. mobile learning system.. system [1, 2]. Several papers have been addressed. 3.1 Probability of a Communication Link. upon issues of data allocation in mobile computing. Works. systems [3, 4, 5]. Peng and Chen [5] proposed a data. The communication links may be wired physical. mining algorithm which involves incremental mining. links or wireless radio links.. for user moving patterns and exploit the mining. 3.1.1 Operational Probabilities of Physical links.. results to develop data allocation schemes for. In Lin and Chen [6, 7], the reliability of a. personal data and shared data. However, there are. communication link is fixed as a constant during the. two limitations in [5]. First, only one data item is. modeling in a distributed computing system. We use. considered each time no matter for personal data or. a simple linear regression model to capture the. shared data. In this paper, many kinds of different. dynamic behavior of the operational probability that. courseware media can be accessed simultaneously. the link can work well under different traffic load in. for. this model.. mobile. users.. Second,. the. considered. performance criterion in [5] is the hit ratio that the. 3.1.2 Operational Probabilities of Radio Links.. user can access the required data only at the local. For a wireless radio link, we can use the. node. But, except for the local node, the mobile users. measurement of the received signals (RSSI) from. can also access the courseware from all connected. each neighbor to represent the operational probability. remote nodes by all possible routing paths. Both the. of the radio link [8].. local and remote media access will be considered in. 3.2 Probability of a Communication Node. our probability model.. Works. Hara [4] proposed some methods of replicating. Although any communication node may be failed. data items on mobile host to improve data. at some time, we may assume that all the nodes are. 614.
(3) Int. Computer Symposium, Dec. 15-17, 2004, Taipei, Taiwan.. perfect. This assumption seems to be unrealistic.. probability for mobile user 1 by conditional. However, we can use a simple transformation to. probability as follows: MAP(U1) = Prob((E1) OR (E2)). transform the node failure rates into a graph with. =Pr(E1)+Pr(E1c|E2)*Pr(E2)=0.9*0.9+(1-0.9*0.9)*0.9. flawless nodes and failing edges [9, 10].. *0.9 = 0.9639.. 3.3 Media Access Probability. When the mobile user moves to another node, the. The media access probability is defined as the. requested media change, or due to the dynamic. probability that the needed media can be accessed. network topology, the media access probability will. successfully from all connected nodes by all possible. be different. We can partition the time dimension into. routing paths. A MST (media spanning tree) is a tree. several time slots. Each time any of the above factors. that connects the user node to some other nodes such. change, we will recalculate the media access. that its vertices hold all required media. And a. probability. We use the mean value of the several. minimal media spanning tree (MMST) is a tree such. media access probabilities as the MAP for some. that no other MST which is a subset of the MMST. specific mobile user. The mean value of the MAP for. exists. There may be many such MMST, and at least. all mobile users in the system is defined as the. one of these media spanning trees must be. system media access probability (sMAP). And then. operational in order to complete the courseware. we use the sMAP as the criterion to represent the. presentation request. In this paper, we use a FREA. performance of a mobile learning system.. algorithm proposed by Lin and Chen [7, 8] to. 3.4 Numerical Example. evaluate the probability that at least one of the. Consider a mobile learning system in Fig. 2.. minimal media spanning trees will work.. Mobile user 1 is resident at node E. Media 1 is. Numerical Example: Consider a wireless network. allocated at nodes A and D. Media 2 is allocated at. that can be modeled by the graph in Fig. 3(a). Mobile. nodes A and B. Media 3 is allocated at nodes B. The. user 1 is resident at node V3. Media 1 is allocated at. resident nodes of the mobile user and the needed. nodes V1 and V4. Media 2 is allocated at nodes V1. media at different time slots are shown in Table 1.. and V2. Media 3 is allocated at nodes V2. Mobile user. We will derive the probability of successful media. 1 needs media 1 and media 3 to complete the media. access according to the proposed model step by step.. access. Fig. 3(b) shows all the minimal media. 3.4.1 Probability of a Communication Link works.. spanning trees to get the required media.. Without loss of generality, we assume that all the links’ operational probabilities are equal to 0.9.. M2, M3. V2. V1 M1 , M2. M2 , M3 M1. U1. V2. V2. 3.4.2 Probability of a Communication Node works.. V4 V1 M1, M2. M1 U1. V3. M2, M3. V4. We assume that all the nodes are perfect, i.e., with. U1 V3. operational probabilities = 1.. V3. Fig. 3.(a) A 4-node network architecture. (b) The minimal media spanning trees to get the required media.. Table 1 The Moving Path and Needed Media Time slot. Resident node. Needed media. T1. E. M1, M2. T2. B. M1, M2, M3. T3. A. M2, M3. V1, and V2 are connected), and E2 = (V3, V4, V2 are. T4. F. M3. connected). Then, we can get the media access. T5. C. M3. Without loss of generality, we assume that all the links’ operational probabilities are 0.9. Let E1 = (V3,. 615.
(4) Int. Computer Symposium, Dec. 15-17, 2004, Taipei, Taiwan.. 3.4.3 Media Access Probability. MAP(U1, T1) = 0.9880461. MAP(U1, T2) = 0.9981000. MAP(U1, T3) = 0.9866125. MAP(U1, T4) = 0.9766640. MAP(U1, T5) = 0.9862876. 3.4.4 The System Media Access Probability. sMAP = ∑(MAP(U1, Ti)) /5 = 0.98714204.. Step 1: Use data mining techniques to get the media access patterns from the logs. Step 2: For the node with memory space to replicate media, choose the media with highest access frequency first to be replicated. Step 3: Discard the pattern record used in step 2. Step 4: Repeat steps 2 and 3 until all nodes have no enough memory to replicate media.. 4.2 Dynamic Replica Allocation Method. 3.4.5 Another Allocation of Media M3. If media M3. SRAM is a simple replica allocation method, but. is allocated at node D, the new sMAP will be. the user mobility patterns were not considered. Some. 0.98674156.. circumstances must be considered due to the mobility. This is smaller than the above probability. So,. characteristics. First, because the user may not. different media distribution will affect the successful. always stay at some node, we should predict the next. probability of media access. In the following section,. move to get the appropriate node to replicate the. we will present two heuristic media replication. needed media. Second, there may be some media to. methods to replicate media into appropriate locations. be replicated to the same local node to achieve the. such that the successful probability of media access. maximum MAP for some individual mobile user. But. can be improved.. what we concern is the system sMAP and the node capacity is not unlimited to replicate all media. So,. 4. Replica Allocation Methods. we need to sort the order of media to be replicated. With the mining results of mobility patterns and. according to some media importance measures. Third,. media access patterns, one can replicate the needed. several mobile users may want to access the same. media in advance to increase the successful. media at the same time slot. We have to replicate the. probability of media access.. media at the ‘center’ of all the concerned mobile. In order to capture the media access patterns and. users. Here, ‘center’ means the node that will cause a. user moving patterns, the history moving logs are. maximum system media access probability. That is,. needed. For each mobile user, the time slot, resident. we must sort the order of media servers to replicate. node and the needed media are recorded in the log. the media selected in the above step.. file such as in table 1. With such logs, we present. The algorithm of the dynamic replica allocation. SRAM (static replica allocation method) and DRAM. replicate the media with highest access frequency. method (DRAM) is as follows: Step 1:Use data mining and Markov chain techniques to get the moving patterns to predict the next move. Step 2: Decide the replica allocation order of the needed media by the weights of the media. Step 3: Decide the replica allocation order of the media servers by the all pairs maximum probability path algorithm. Step 4: Replicate the minimum weight media first to the maximum probability node obtained in steps 2 and 3. Step 5: Repeat until all media servers have not enough memory spaces to replicate any media.. first. The algorithm of the static replica allocation. 4.2.1 Using Data Mining and Markov Chain. method (SRAM) is as follows:. Techniques to Predict the Next Move. If we can. (dynamic replica allocation method) to improve the sMAP in a multimedia mobile learning system.. 4.1 Static Replica Allocation Method (SRAM) Once the movement logs are generated, we can acquire the media access patterns by counting the access frequency of all media that are needed by some mobile user at some node. Based on the media access patterns, we can. 616.
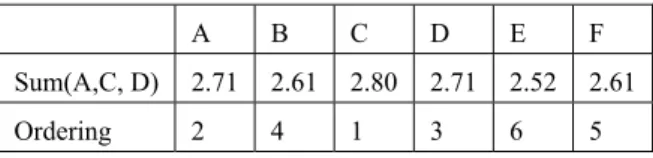
(5) Int. Computer Symposium, Dec. 15-17, 2004, Taipei, Taiwan.. always replicate the needed media into the local node,. in the routing path. The maximum probability path is. we will have a maximum sMAP, i.e., 1. So,. the path that has the maximum probability for the. prediction of the mobile users’ moving path will. two nodes to communicate.. assist in the replica allocation. We use data mining. by one user, we can replicate the media to the nodes. techniques to capture the moving patterns from the. ordered by the probability obtained in the algorithm. movement log file. Based on the moving patterns, we. in descending order. If the media is requested by. use Markov chain to get the probability used as a. several users, we sum the probabilities of the rows of. basis to predict the next move.. the concerned users to represent the maximum. 4.2.2 Deciding the Replication Order of the Media.. probability path to the group users. And then, we can. There will be some media to be replicated to the. replicate the media according to the probability in. same node to achieve the maximum MAP for some. of the probabilities that all the users can access the. descending order. Algorithm: All pairs maximum probability path algorithm Input: The network topology and the operational probability of each communication link Output: All pairs maximum probability path Begin for (k=1; k<=n; k++) for(i=1; i<=n; i++) for(j=1; j<=n; j++) P[i][j]= max(P[i][j] , P[i][k] * P [k][j] ) End Example: Consider the network topology in Fig. 2.. media successfully from all possible routing paths.. We assume that the operational probabilities of all. Our objective is to replicate the media to have a. communication links are equal to 0.9. We can use the. higher sMAP, so we should sort the media with the. above algorithm to calculate the all pairs maximum. smallest weight to be replicated first.. probability paths. Table 2 shows the results.. individual mobile user. But what we concern is the system MAP and the node capacity is not unlimited to replicate all media. So, we need to sort the order of media to be replicated according to some media importance measures. We define the weight of media i as follows. W(Mi,Vj) = ∑(MAP(Vj,Mi))/n, i.e., the mean value. 4.2.3 Deciding the Order of Media Servers to. If the media is needed. Table 2 All Pairs Maximum Probability Paths. Replicate the Selected Media. Once the media. A. B. C. D. E. F. replication order is determined, we will consider. A. 1. 0.9. 0.9. 0.81. 0.81. 0.9. where to replicate the media to achieve higher sMAP.. B. 0.9. 1. 0.81. 0.9. 0.9. 0.81. If the media is needed by only one user at the time. C. 0.9. 0.81. 1. 0.9. 0.81. 0.9. D. 0.81. 0.9. 0.9. 1. 0.9. 0.81. E. 0.81. 0.9. 0.81. 0.9. 1. 0.729. F. 0.9. 0.81. 0.9. 0.81. 0.729. 1. slot, we can replicate the media in the local node to have the MAP to be 1. If the memory space of the local node is not enough or the media is request by. If media 1 is required by node A, C, and D, we sum. several users, we present the following algorithm to. the rows A, C, and D in table 2 to have the following. decide the allocation order of the nodes to replicate. data in table 3. So, Media 1 should be replicated on. the concerned media. The algorithm can output a. the ordering C, A, D, B, F, E.. table showing the all pairs maximum probability path.. Table 3 The Sum of Rows A, C, and D in table 3. There are many paths between two nodes to communicate. The probability of the path is the product of the operational probability of all the edges. 617. A. B. C. D. E. F. Sum(A,C, D). 2.71. 2.61. 2.80. 2.71. 2.52. 2.61. Ordering. 2. 4. 1. 3. 6. 5.
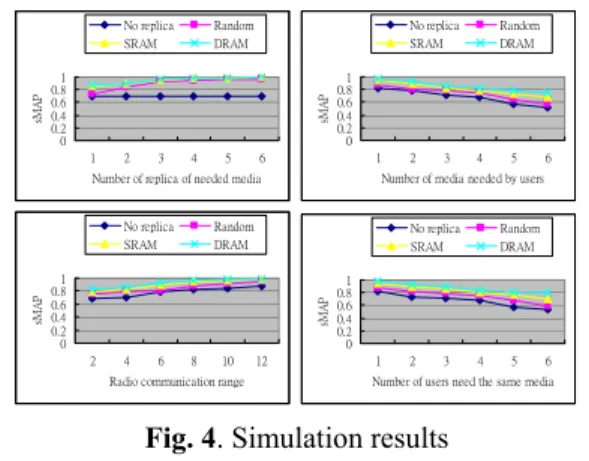
(6) Int. Computer Symposium, Dec. 15-17, 2004, Taipei, Taiwan.. References. 5. Simulation Experiments We use a flatland to simulate the system in our. [1] Chi-Hong Leung, Yuen-Yan Chan, “Mobile. model. There are some fixed media servers and. Learning: A New Paradigm in Electronic. mobile hosts in the plain. Each mobile host can. Learning,” The 3rd IEEE Int’l Conf. on Advance. moves randomly in all directions, and the movement. Learning Technologies, July 2003, P.76.. speed. is. randomly. determined.. The. [2] Mike. radio. Sharples,. Dan. Corlett. and. Oliver. communication range of each mobile host is a circle. Westmancott, “The Design and Implementation. of radius R. Each medium i is held by media server i. of a Mobile Learning Resource,” Personal and. as the original.. Ubiquitous Computing 6, pp.220-234, 2002. [3] N. Shivakumar and J. Jannink, J. Widom,. Figure 4 presents the simulation results regarding sMAP evaluation of our proposed methods compared. “Per-User. with no replication, and random replication methods.. Environments:. The results demonstrate the effectiveness of our. Simulation Results,” ACM J. Mobile Networks. proposed approaches.. and Applications, vol. 2, pp. 129-140, 1997.. sMAP. sMAP. 1 0.8 0.6 0.4 0.2 0 1. 2. 3. 4. 5. 1. 4. 6. 8. 10. 3. 4. No replica SRAM. sMAP. sMAP. Random DRAM. 1 0.8 0.6 0.4 0.2 0 2. 2. 12. Radio communication range. 5. Allocation Schemes by Incremental Mining of 1. 2. 3. 4. 5. User Moving Patterns in a Mobile Computing. 6. Number of users need the same media. System,” IEEE Trans. on Knowledge and Data Engineering, vol. 15, no. 1, pp. 70-85, Feb. 2003.. In this paper, we proposed a MAP (media access. [6] M. S. Lin and D. J. Chen, "New Algorithm for. probability) model to evaluate the successful course. and. [5] W.-C Peng and M.-S. Chen, “Developing Data. 1 0.8 0.6 0.4 0.2 0. 6. Summary and Conclusion. of. Analysis. Management, pp. 79-86, 2002.. Random DRAM. Fig. 4. Simulation results. probability. Mobile. the Third Int’l Conference on Mobile Data. 6. Number of media needed by users. Number of replica of needed media. No replica SRAM. Algorithms,. in. Networks with Periodic Data update,” Proc. of. 1 0.8 0.6 0.4 0.2 0. 6. Replication. [4] Takahiro Hara, “Replica Allocation in Ad Hoc. Random DRAM. No replica SRAM. Random DRAM. No replica SRAM. Profile. materials. access. in. the Reliability Analysis of Distributed Systems,". a. Journal of Information Science and Engineering. multimedia mobile learning system. Based on the. 8(3), pp. 353-391, 1992.. media access patterns and mobile users mobility. [7] M. S. Lin, "Program Reliability Analysis in. patterns, we also present SRAM (static replica. Distributed Computing Systems," Ph.D. thesis,. allocation method) and DRAM (dynamic replica. Department. allocation method) to improve the media access. of. Computer. Science. and. Information Engineering, NCTU, 1994.. probability. The proposed probability model and. [8] T. S. Rappaport, Wireless Communications,. media allocation methods can be used as a network. Principles and Practice. Prentice-Hall, 1996.. planning tool, and assist in the QoS provisioning of. [9] C. J. Colbourn, The Combinatorics of Network. multimedia mobile learning systems.. Reliability. Oxford University Press, 1987.. Acknowledgements. [10] M.. This research was supported in part by National. O.. Ball,. “Complexity. of. Network. Reliability,” Networks 10, pp. 153-165, 1980.. Science Council, MediaTek Inc., and Bestwise Inc.. 618.
(7)
數據
相關文件
We would like to point out that unlike the pure potential case considered in [RW19], here, in order to guarantee the bulk decay of ˜u, we also need the boundary decay of ∇u due to
In this paper, we propose a practical numerical method based on the LSM and the truncated SVD to reconstruct the support of the inhomogeneity in the acoustic equation with
Text A.. The activities that follow on p. 14-18 are designed to demonstrate how teachers can use “scaffolding strategies” to support student learning when using print media
Students are asked to collect information (including materials from books, pamphlet from Environmental Protection Department...etc.) of the possible effects of pollution on our
An information literate person is able to recognise that information processing skills and freedom of information access are pivotal to sustaining the development of a
Access - ICT skills: the technical skills needed to use digital technologies and social media. - Information
Comparing mouth area images of two different people might be deceptive because of different facial features such as the lips thickness, skin texture or teeth structure..
Every sequence of n 2 +1 distinct real numbers contains a subsequence of length n+1 that is either strictly increasing or strictly decreasing.
