The Impact of Trade and Factor Flows on Domestic Taxation
16
0
0
全文
(2) 48. International Journal of Business and Economics. throughout the period. For the labor tax, all countries showed a rising trend, but with different patterns. Differences among countries are also seen in the capital tax rates. Previous literature has discussed the possible link between economic integration and domestic taxation. It is claimed that international trade of goods and services may alter the elasticity of capital and labor and, hence, change the optimal tax rates for capital and labor. At the same time, economic integration encourages the flows of capital and labor between countries. This may directly alter taxation on capital and labor as the tax bases are affected. Although the literature on the link between trade and domestic taxation is quite well developed, the empirical literature that looks at the simultaneous link between trade, factor flows, and domestic taxation is absent. The existing literature also lacks an analysis of how taxes on consumption are affected by globalization. Because of the complex choices that governments face in raising revenues, including the consumption tax along with the labor and capital taxes in the analysis is important. One exception in the literature is Dreher (2006), who used a unique index of globalization composed of trade and factor flows among many others and examined the relationship between the globalization index and various taxes. Our paper shares in this spirit yet differs in that we examine how each feature of international trade, capital flow, and labor flow affects domestic taxation ceteris paribus. Individual focus on the various features of economic integration is not only consistent with the theoretical literature discussed below but also useful in considering the discussions among policy makers and in public debates on policies of free trade and immigration. Therefore, this paper tries to close the existing gaps in the literature by including both trade and factor flows in the analysis and by studying how they affect taxation on capital, labor, and consumption. Despite the emphasis on the effect of economic integration on capital and labor taxes in the literature, our study finds these channels to be rather weak. International trade and factor flows across countries are found to have no significant influence on the capital and labor tax rates. Instead, the paper finds strong and significant evidence that larger net inflows of labor and capital and a greater volume of international trade are associated with lower consumption tax rates. While government may be simply shifting the tax burden away from consumers instead of workers and capital owners, this evidence—especially the link between the consumption tax rate and factor flows—is new in the literature. The rest of the paper is organized in five sections. Section 2 discusses the relevant existing literature. Section 3 describes the data and the variables used in this study. Section 4 discusses empirical specification issues. Section 5 discusses the results, and Section 6 concludes. 2. Literature review In this section, we review relevant theoretical and empirical literature that explains the link between economic integration and domestic taxation. In our.
(3) Ryo Takashima. 49. empirical analysis, we use effective tax rates as measures of domestic taxes. We start the review with a summary of recent developments in the effective tax rate literature. 2.1 Effective tax rates Researchers have developed measures of effective tax rates in various ways to answer critical questions, such as what is the overall burden of taxes and what is the magnitude of tax distortions. The initial studies of effective tax rates focused on capital income. King and Fullerton (1984) provided an important contribution to the literature on effective tax rates on earnings stemming from capital. This paper was based on the work on investment theory by Jorgenson (1963), Hall and Jorgenson (1967), and King (1974). The King-Fullerton approach was criticized due to the complexity of calculation and the number of assumptions required. Responding to this criticism, Mendoza et al. (1994) developed a much simpler method that uses the actual tax revenue data at a macro level. These two developments are distinct in that one takes a forward-looking approach and the other a backward-looking approach. The forward-looking approach hypothesizes a certain investment project and a household to calculate the capital, labor, and consumption tax rates that are expected. For this, it hypothesizes the types of assets, the methods of finance, and the tax status of the investor and household. The tax rates calculated by King and Fullerton (1984) represent this forward-looking approach. The alternative, the backwardlooking approach, uses the actual tax revenue collected and compares it with the before-tax incomes and/or expenditures. The methods of Mendoza et al. (1994) corresponds to this backward-looking approach and were used in Rodrik (1997), who analyzed whether the distribution of taxes shifted from capital to labor. Daveri and Tabellini (2000) also used Mendoza’s tax rates in their study of the relationship between high labor tax rates and systematically high unemployment rates in the European continent. One of the criticisms that Mendoza’s tax rates face is that, due to the backwardlooking nature, it does not provide a picture of how the concurrent tax system affects the incentives of economic agent behavior on investment, labor supply, and consumption ex ante. However, as Sorensen (2004) summarized, the forwardlooking and the backward-looking rates become identical when an economy grows according to the golden rule, the capital stock grows at a constant real interest rate, and the rate of depreciation in the tax code is constant at the true depreciation rate. Carey and Rabesona (2002) claimed that several assumptions in Mendoza et al. (1994) are unrealistic. First, the OECD’s annual Revenue Statistics report does not define the sources of household income as labor income and capital income. Thus, households are assumed to contribute at the same tax rate to the capital tax and the labor tax. Second, self-employed workers’ earning is assumed to be all capital income. Third, the deductibility of social security contributions from taxable income is not incorporated. Finally, taxable income includes social security contributions but not private employer’s contributions to pension funds in Mendoza’s tax rates. Despite a number of restrictions, Mendoza’s approach remains one of the most extensive tax data covering as many countries and time periods, which is valuable.
(4) 50. International Journal of Business and Economics. for panel data analysis such as ours. Also, the efforts by Daveri and Tabellini (2000) extended the available data until 1995. Finally, as it is a backward-looking approach, it provides the actual tax burdens borne in an economy and the actual taxes that are imposed by governments, instead of perceived taxes. Because of these advantages, we utilize these data. 2.2 Theoretical developments There are two major channels that link economic integration and domestic taxation. First, trade in goods and services affect the demand elasticity of factors of production such as capital and labor. This change in elasticity alters the optimal tax rate on factor inputs based on the excess burden of taxation. Second, in an open economy, capital and labor can move across national borders. This factor mobility can impact tax rates. The inflows of production factors alter the taxable bases that government can impose taxes. Hence a government may change various tax rates in the face of budget constraints and political incentives. Below, we provide a summary of this literature. Slaughter (2001) provided a summary of how economic integration can make labor demand more elastic. Labor demand elasticity ( η L ) is the weighted sum of the constant-output elasticity of substitution between labor and other factors ( σ ) and the product demand elasticity ( η ); see also Hamermesh (1993). Symbolically:. η L = − (1 − s ) σ − sη ,. (1). where s is the share of labor in income and σ captures the extent of labor that is substituted with other factor inputs holding output constant when the cost of labor becomes more expensive relative to other inputs. Greater openness increases σ as firms have more access to foreign factor inputs including labor that can be obtained by shifting production abroad or buying intermediate inputs from abroad. Opening up to trade also increases the product demand elasticity ( η ) as firms face more foreign competition. Both of these contribute to an increase in the labor demand elasticity (Slaughter, 2001). The empirical work in Slaughter (2001) provided evidence that an increase in international trade has made the demand for production labor in manufacture industries more elastic. In a partial equilibrium model, when labor demand and/or labor supply become more elastic, the excess burden of labor tax increases. If opening up to trade increases the labor demand elasticity, as claimed by Slaughter (2001), the labor tax rate has to be lowered in consideration of the excess burden. Furthermore, the tax incidence literature shows that the incidence of the labor tax increases if demand for labor becomes more elastic. Thus, the burden of the labor tax as well as other nonlabor costs fall more on laborers and less on employers for any given tax rate. Rodrik (1997) pointed out two other impacts of an increase in labor demand elasticity on the labor market. As labor demand becomes more elastic, it takes bargaining power away from laborers. Thus, it becomes easier for employers to pass non-labor costs on to laborers. Also, it makes the labor market more volatile as.
(5) Ryo Takashima. 51. external shocks that affect labor demand result in a larger change in the wage rate. With these considerations in mind, governments with a greater degree of integration may opt to lower the labor tax rate. A similar logic can be applied to capital taxation. Economic integration may make capital demand more elastic (Rodrik, 1997). If that is the case, further economic integration may lead to lower optimal capital tax rates. Trade theory usually assumes that once an economy is opened to the world market, domestic demand becomes infinitely elastic for firms. This pushes optimal commodity taxes toward zero. This is rather extreme, because in reality there are numerous barriers to trade, including not only tariffs and non-tariff barriers, but also non-policy barriers such as differences in business customs, language, and culture. However, it still remains that increasing economic integration lowers the optimal consumption tax rate. On the other hand, studies including Keen and Ligthart (2002), Hatzipanayotou et al. (1994), and Michael et al. (1993) argue that elimination of tariffs combined with increases in consumption taxes to maintain revenue is welfare enhancing for small open economies. It is left to empirical studies to examine whether and to what extent economic integration affects consumption tax rates. Economic integration also influences domestic taxation through changes in the taxable base. Economic integration typically implies an increase in flows of goods as well as production factors such as capital and labor. Net inflows of capital and labor increase the taxable base for governments. Due to the nature of public goods in publicly provided goods and services, labor inflow may not increase the cost of government services per head linearly, and indeed it may very well decrease. Alternatively, one can assume that government’s production function follows an increasing return to scale. Thus, the average cost to provide government services could decline. Net inflow of capital also expands the taxable base, and this allows governments to lower not only the capital tax rate but also other tax rates. Alternatively, factor inflow, particularly labor inflow, may alter the political structure, as claimed in Razin et al. (2002), which may influence domestic taxation. Increasing immigration may lower the share of government spending that is appropriated for native citizens. Hence, native citizen voters may vote in favor of lower government spending per head and lower tax rates. Whether inflows of capital and labor have lowered the various tax rates is an empirical question we tackle in this paper. 2.3 Review of relevant empirical work Rodrik (1997) estimated how trade volume and the exposure to external risk are associated with capital and labor tax rates. External risk is defined as the income variation due to exchange volatility. He found that trade volume is associated with a rise in the labor tax rate and a fall in the capital tax rate at statistically significant levels. When external risk is taken into account, the erosion of the capital tax rate becomes insignificant. He claimed that economic integration changes the structure of domestic taxation in such a way that the tax burden shifts from capital to labor. Factor flows are not considered in his work, however..
(6) 52. International Journal of Business and Economics. Razin et al. (2002) studied the effect of migration on the labor tax rate and found that a larger share of immigrants in population leads to a lower labor income tax. They suggested that as the share of immigrants grows, a larger proportion of tax revenue is spent on immigrants. Thus, a median voter, not affected by immigration, tends to vote in favor of lower labor income tax. While trade itself is not a major concern for their paper, it is included in their estimation, and in most of their specifications it has a negative but insignificant coefficient. This contradicts the finding of Rodrik (1997). While most of the literature has focused on either the capital tax or the labor tax, there is a possibility that the government responds by shifting taxation to consumption in response to increased integration. Mendoza et al. (1994) noted that countries with low capital tax rates tend to have high consumption tax rates. This is consistent with the idea that though economic integration may lower the capital tax rate, it may just shift the burden of taxation toward consumption (to maintain a balanced budget). Therefore, it is also important to look at how economic integration influences the tax rate of consumption along with the capital and labor tax rates. In addition, it is crucial to include both trade and factor flows in the analysis since these are features of economic integration that influence domestic tax rates. One exception to the existing literature is Dreher (2006), which investigates the relationship between globalization and all taxes on capital, labor, and consumption. Dreher (2006) utilizes an index of globalization that features the sub-indices of economic, social, and political integration. The index of economic integration is comprised of trade volume and foreign direct investment (FDI) as a percent of GDP, along with many other measures, such as restrictions on flows of goods and services and of capital. The index of political integration includes the presence of embassies and participation in the UN and other international organizations. Labor flow is encompassed in the index of social integration, along with information on telephone use, international tourism, and the prevalence of Internet, cable TV, and newspapers. The index of globalization is the weighted average of these three sub-indices. Dreher (2006) uses these indices to scrutinize their relation to taxes on capital, labor, and consumption. The index of globalization is found positively associated with the capital tax rate at a statistically significant level while it is negatively associated, though statistically insignificant, with labor and consumption taxes. Depending on the specification of the estimation, different indices of economic, social, and political integration are found statistically significant in the capital tax estimate but are always insignificant in the labor and consumption tax estimates. The use of aggregate indicators of globalization and economic integration is useful in grasping the general impacts on various taxations. However, it also hides what factors in fact affect those taxes. As discussed in the previous section, there are different channels through which trade and net inflows of production factors affect domestic taxation. In what follows, we proceed with our empirical analysis by focusing on different features of globalization, namely international trade, capital flow, and labor flow. This allows us to see how each affects domestic taxation..
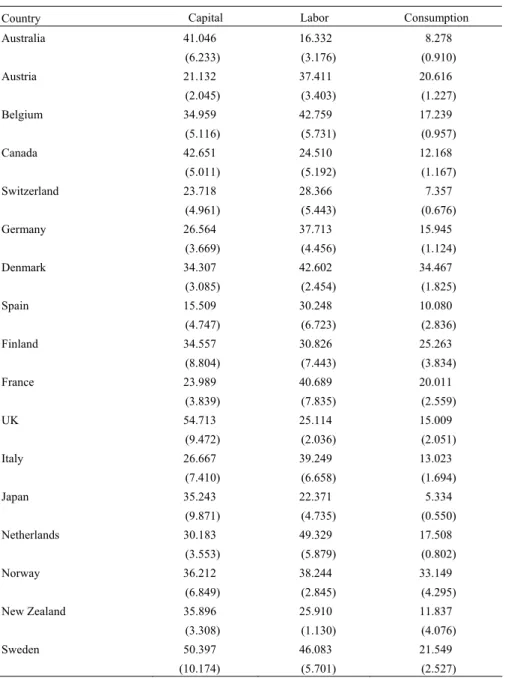
(7) Ryo Takashima. 53. 3. Data description We consider annual data over the period of 1970 to 1995 for OECD countries. The dependent variables in all estimations are the average effective tax rates on capital, labor, and consumption. Tax rates in the data set are in percentage points; these rates are defined and calculated as in Mendoza et al. (1994). The countries that are included are Australia, Austria, Belgium, Canada, Denmark, Finland, France, Germany, Italy, Japan, Norway, Spain, Sweden, Switzerland, the UK, the Netherlands, and New Zealand. The explanatory variables include the share of trade volume in GDP, net inflow of FDI, the share of the foreign population in total population, GDP per capita, general government final consumption expenditure, general government gross financial liability, external risk, the standard deviation (SD) of monthly spot exchange rate, the share of the labor force in total population, the inflation rate, and unemployment rate. All exchange rate data is expressed in terms of US dollars; thus, US data is excluded from the analysis. The external risk variable is calculated following Rodrik (1997). It is defined as the SD of the change in the logarithm of the monthly spot rate multiplied by the share of trade volume, and it measures unanticipated income effects due to the exchange rate. Government liability data is taken from the OECD economic outlook. Exchange rate data are obtained from Thomson Datastream. All other data are from the World Development Indicators. Table 1 provides summary statistics of the tax rates for each country. 4. Specification and Estimation Strategy Our main focus in the empirical analysis is to estimate the effects of trade volume, net FDI inflow, and the share of foreign population on capital, labor, and consumption taxes. We regress on each tax separately. The general specification is: Taxkit = α i + β X it + γ Z it + ε kit ,. (2). where k , i , and t index tax type, countries, and years, respectively, X contains trade, FDI, and the share of the foreign population, and Z contains other control variables such as GDP per capita, government consumption, government liability, exchange rate volatility, inflation rate, unemployment rate, and total population. However, as Mendoza et al. (1994) showed, the tax rate trends exhibit some persistence over the period. Thus, capturing the dynamic aspect may be more appropriate. We add a lagged tax rate term and estimate the following model: Taxkit = α i + β X it + γ Z it + δ Taxkit −1 + ε kit .. (3). This specification is problematic especially when we suspect X it is endogenous and correlated with the error term because this gives biased estimates. If specification (3).
(8) 54. International Journal of Business and Economics. does not have serial correlation, then the potential endogeneity problem can be solved by instrumental variable estimation with the lags as instruments. Table 1. Summary Statistics of Tax Rates: Means and SDs in 1970–1995 Country Australia. Capital. Labor. Consumption. 41.046. 16.332. 8.278. (6.233). (3.176). (0.910). 21.132. 37.411. 20.616. (2.045). (3.403). (1.227). Belgium. 34.959. 42.759. 17.239. (5.116). (5.731). (0.957). Canada. 42.651. 24.510. 12.168. (5.011). (5.192). (1.167). 23.718. 28.366. 7.357. (4.961). (5.443). (0.676). 26.564. 37.713. 15.945. (3.669). (4.456). (1.124). Denmark. 34.307. 42.602. 34.467. (3.085). (2.454). (1.825). Spain. 15.509. 30.248. 10.080. (4.747). (6.723). (2.836). Finland. 34.557. 30.826. 25.263. (8.804). (7.443). (3.834). 23.989. 40.689. 20.011. (3.839). (7.835). (2.559). UK. 54.713. 25.114. 15.009. (9.472). (2.036). (2.051). Italy. 26.667. 39.249. 13.023. (7.410). (6.658). (1.694). 35.243. 22.371. 5.334. (9.871). (4.735). (0.550). 30.183. 49.329. 17.508. (3.553). (5.879). (0.802). Norway. 36.212. 38.244. 33.149. (6.849). (2.845). (4.295). New Zealand. 35.896. 25.910. 11.837. (3.308). (1.130). (4.076). Sweden. 50.397. 46.083. 21.549. (10.174). (5.701). (2.527). Austria. Switzerland Germany. France. Japan Netherlands. Note: SDs are in parentheses..
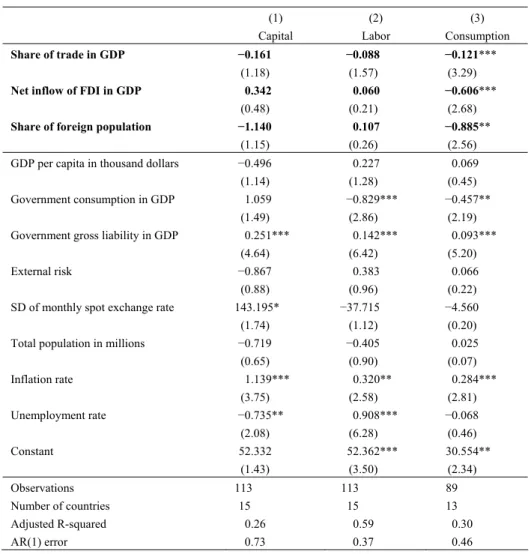
(9) Ryo Takashima. 55. Alternatively, the specification developed by Arellano and Bond (1991) may be used, which we pursue below. In this case, it is assumed that the error term includes the individual-specific term, which can be a cause of serial correlation. The presumption is that the unexpected change in the effective tax rates can be partitioned into two terms: a country-specific portion and a random portion. Thus, the specification can be written as: Taxi ,t = δ Taxi ,t −1 + β X i ,t + γ Z i ,t + ν i + ui ,t .. (4). If there is a possibility of serial correlation and an endogeneity problem with X it , we cannot use a simple instrumental variable method. Using the fixed or random effect estimation of (4) also leads to biased estimates (see Baltagi, 2001, p. 130; Nickell, 1981; and Kiviet, 1995). Among others, Arellano and Bond (1991) developed a consistent and efficient estimation method, which uses a generalized method of moment procedure with the instruments discussed below. The basic estimation model takes first differences to remove the country-specific error term in (4) as follows:. ΔTaxi ,t = δΔTaxi ,t −1 + βΔX i ,t + γΔZ it + Δui ,t ,. (5). where Δ is the first difference operator. As the error term in (5) is still correlated with ΔTaxi ,t −1 , an instrumental variable technique is needed. Arellano and Bond (1991) argue that a dependent variable lagged two periods or more can be used as an instrumental variable in addition to exogenous variables ( Z ) to obtain unbiased estimates of β . We conduct empirical analyses in the sequence described above and provide the results in the following section. 5. Results and Discussion Table 2 shows the estimation result from the fixed effects model (2). In both the capital and the labor equations, the sign of coefficient of trade volume is negative, consistent with the elasticity explanation for the optimal taxation. The estimates show that capital inflow is positively associated with capital and labor tax rates. Labor inflow is negatively associated with the capital tax rate, but positively associated with the labor tax rate. However, the estimates of trade volume and factor flows, such as capital and labor, turned out to be insignificant in both the capital and the labor equation. This suggests that the link between economic integration and taxation on the production factors is rather weak. Furthermore, the claim that increasing economic integration shifts tax burden from capital to labor can only be supported weakly with regard to the labor flow and not at all with regard to other features of economic integration. The strong link was rather found in the consumption equation. Trade volume, net inflow of FDI, and the share of the foreign population were all negatively associated with the consumption tax at statistically.
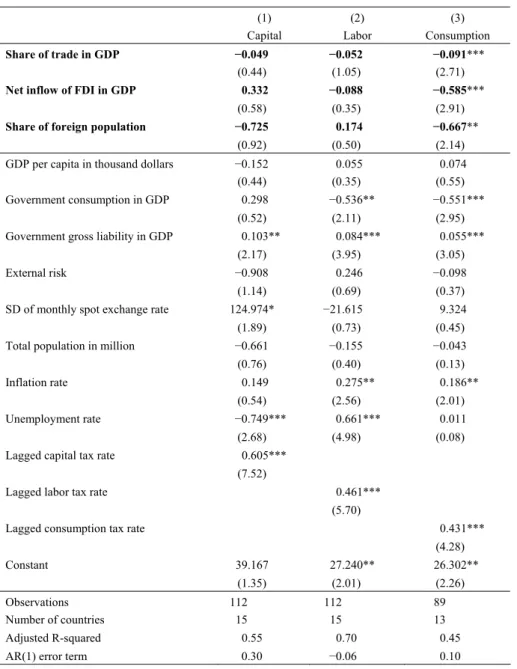
(10) 56. International Journal of Business and Economics. significant levels. The impact of the foreign population is particularly large. A 1% increase in the share of the foreign population is associated with a near 0.9% percentage point reduction of the consumption tax rate. The impacts of trade and capital flow are also nontrivial. The results show that increasing pressure of economic integration does affect domestic taxation, and that its impact falls on consumption taxes rather than on capital and labor taxes. Table 2. Fixed Effects Estimation—Model (2). Share of trade in GDP Net inflow of FDI in GDP. (1). (2). (3). Capital. Labor. Consumption. −0.161. −0.088. (1.18). (1.57). 0.342. 0.060. −0.121*** (3.29) −0.606***. (0.48). (0.21). Share of foreign population. −1.140. 0.107. (1.15). (0.26). GDP per capita in thousand dollars. −0.496. 0.227. 0.069. (1.14). (1.28). (0.45). −0.829***. −0.457**. (2.86). (2.19). Government consumption in GDP. 1.059 (1.49). Government gross liability in GDP. 0.251*** (4.64). External risk SD of monthly spot exchange rate Total population in millions Inflation rate. Constant. Number of countries Adjusted R-squared. 0.093*** (5.20). 0.383. 0.066. (0.88). (0.96). (0.22). 143.195*. −37.715. −4.560. (1.74). (1.12). (0.20). −0.719. −0.405. 0.025. (0.65). (0.90). (0.07). 1.139*** −0.735**. 0.320** (2.58) 0.908***. 0.284*** (2.81) −0.068. (2.08). (6.28). (0.46). 52.332. 52.362***. 30.554**. (1.43) Observations. (6.42). (2.56). −0.867. (3.75) Unemployment rate. 0.142***. (2.68) −0.885**. (3.50). (2.34). 113. 113. 89. 15. 15. 13. 0.26. 0.59. 0.30. AR(1) error 0.73 0.37 0.46 Notes: Absolute values of t-statistics are in parentheses. *, **, and *** denote significance at 10%, 5%, and 1% levels.. The robustness of our main finding can be seen in other specification as well. Table 3 provides estimates of model (3). The estimates of the lagged tax rates are significant in all three equations. The values are also significantly high, ranging from 0.43 to 0.60, showing strong persistence over time. The estimates of trade.
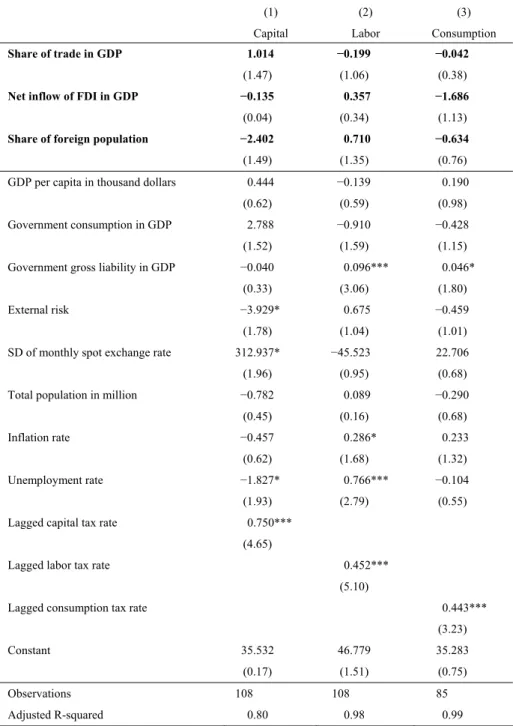
(11) Ryo Takashima. 57. volume and factor flows are similar to the previous estimates for all three taxes. In both capital and labor tax equations, trade volume has a negative coefficient but remains insignificant. The estimated associations of trade and factor flows with the consumption tax are all negative and significant, with values slightly smaller than in the previous specification. Table 4 provides the results from the instrumental variable estimation. The significant estimates of trade and factor flows in the consumption equation disappeared, but the signs remain all negative. Table 5 shows the Arellano-Bond estimates from the equation (5). The estimates of trade volume and capital flow are once again negative and significant, while that of the share of the foreign population is negative but insignificant. Our findings are robust in that trade volume and factor flows are not significantly associated with the capital and labor taxes, while they are significantly negatively associated with consumption taxes. A direct comparison with Dreher (2006) is difficult because aggregate indicators rather than the specific measures of trade and factor flows were used. However, both found the effect on the labor tax statistically insignificant. Our findings differ from Dreher (2006) in that we found the effect on the consumption tax to be statistically significant, while the effect on the capital tax to be insignificant, contrary to Dreher (2006). We believe these differences stem from the differences in the measurements of globalization and economic integration. 6. Conclusion In this paper, we examined whether different paths toward economic integration among OECD countries have affected their domestic taxation policies. These industrial countries are integrated with the world economy to varying degrees, and they differ in terms of policies concerning openness to trade, capital flows, and immigration. Along the way, these countries exhibited different patterns and trends of capital, labor, and consumption tax rates. The existing literature studied how international trade in goods and services is associated with taxes on capital and labor. International trade is said to decrease the capital tax rate and increase the labor tax rate. This paper advances the existing literature by (1) incorporating factor flows as a part of economic integration and (2) examining the impact on the consumption tax. Our study did not confirm the linkage between capital and labor tax rates and the features of economic integration considered, such as trade of goods and services and factor flows. The variations in trade volume and flows of capital and labor across countries were unable to explain the differences in the capital and labor tax rates across countries. Interestingly, a strong relation between economic integration and domestic taxation was found in the consumption tax rate. Previous empirical studies have missed this point. This paper tries to explain the link between economic integration and consumption taxation by studying the effect of goods and factor flows on the elasticity of the goods market. However, the actual link may be more complex than the one described here. Since governments can choose different ways to raise.
(12) 58. International Journal of Business and Economics. revenues, the effects of economic integration may not be felt in the labor and capital markets at all. Indeed, it is quite possible that the benefits of labor and capital inflows are felt in the goods market in the form of lower consumption taxes. Table 3. Fixed Effects with Lagged Tax Rates—Model (3) (1) Capital Share of trade in GDP Net inflow of FDI in GDP. (2) Labor. (3) Consumption. −0.049 (0.44). −0.052 (1.05). −0.091*** (2.71) −0.585***. 0.332. −0.088. (0.58). (0.35). Share of foreign population. −0.725. 0.174. (0.92). (0.50). (2.14). GDP per capita in thousand dollars. −0.152 (0.44). 0.055 (0.35). 0.074 (0.55). −0.536**. −0.551***. (2.11). (2.95). Government consumption in GDP. 0.298 (0.52). Government gross liability in GDP. 0.103** (2.17). External risk SD of monthly spot exchange rate Total population in million Inflation rate. (3.05). −0.908. 0.246. −0.098. (1.14). (0.69). (0.37). 124.974*. −21.615. 9.324. (1.89). (0.73). (0.45). −0.661. −0.155. −0.043. (0.76). (0.40). (0.13). 0.149 −0.749*** (2.68). Lagged capital tax rate. 0.055***. (3.95). (0.54) Unemployment rate. 0.084***. (2.91) −0.667**. 0.275** (2.56) 0.661*** (4.98). 0.186** (2.01) 0.011 (0.08). 0.605*** (7.52). Lagged labor tax rate. 0.461*** (5.70). Lagged consumption tax rate. 0.431*** (4.28). Constant Observations Number of countries Adjusted R-squared. 39.167. 27.240**. (1.35). (2.01). 112 15 0.55. 112 15 0.70. 26.302** (2.26) 89 13 0.45. AR(1) error term 0.30 −0.06 0.10 Notes: Absolute values of t-statistics are in parentheses. *, **, and *** denote significance at 10%, 5%, and 1% levels..
(13) 59. Ryo Takashima Table 4. Instrumental Variable Estimation—Model (3). Share of trade in GDP Net inflow of FDI in GDP Share of foreign population. GDP per capita in thousand dollars. (1). (2). (3). Capital. Labor. Consumption. 1.014. −0.199. −0.042. (1.47). (1.06). (0.38). −0.135. 0.357. −1.686. (0.04). (0.34). (1.13). −2.402. 0.710. −0.634. (1.49). (1.35). (0.76). 0.444. −0.139. 0.190. (0.62). (0.59). (0.98). Government consumption in GDP. 2.788. −0.910. −0.428. (1.52). (1.59). (1.15). Government gross liability in GDP. −0.040 (0.33). (3.06). (1.80). External risk. −3.929*. 0.675. −0.459. SD of monthly spot exchange rate Total population in million Inflation rate. (1.78). (1.04). (1.01). −45.523. 22.706. (1.96). (0.95). (0.68). −0.782. 0.089. −0.290. (0.45). (0.16). (0.68). −0.457 −1.827* (1.93). Lagged capital tax rate. 0.046*. 312.937*. (0.62) Unemployment rate. 0.096***. 0.286* (1.68) 0.766*** (2.79). 0.233 (1.32) −0.104 (0.55). 0.750*** (4.65). Lagged labor tax rate. 0.452*** (5.10). Lagged consumption tax rate. 0.443*** (3.23). Constant. 35.532 (0.17). Observations Adjusted R-squared. 108 0.80. 46.779 (1.51) 108 0.98. 35.283 (0.75) 85 0.99. Notes: Absolute values of t-statistics are in parentheses. *, **, and *** denote significance at 10%, 5%, and 1% levels..
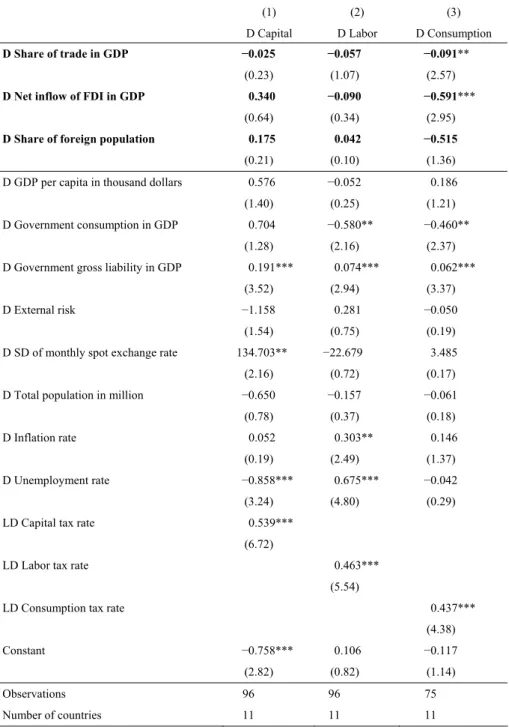
(14) 60. International Journal of Business and Economics Table 5. Arellano-Bond Dynamic Panel Data Estimates—Model (5). D Share of trade in GDP D Net inflow of FDI in GDP D Share of foreign population. D GDP per capita in thousand dollars. (1). (2). (3). D Capital. D Labor. D Consumption. −0.025. −0.057. −0.091**. (0.23). (1.07). (2.57). 0.340. −0.090. −0.591***. (0.64). (0.34). (2.95). 0.175. 0.042. −0.515. (0.21). (0.10). (1.36). 0.576. −0.052. 0.186. (1.40) D Government consumption in GDP. 0.704 (1.28). D Government gross liability in GDP D External risk D SD of monthly spot exchange rate D Total population in million D Inflation rate. 0.191***. (2.16). (2.37). 0.074***. 0.062***. (3.52). (2.94). (3.37). 0.281. −0.050. (1.54). (0.75). (0.19). 134.703**. −22.679. 3.485. (2.16). (0.72). (0.17). −0.650. −0.157. −0.061. (0.78). (0.37). (0.18). 0.052 −0.858*** (3.24). LD Capital tax rate. (1.21) −0.460**. −1.158. (0.19) D Unemployment rate. (0.25) −0.580**. 0.303** (2.49) 0.675*** (4.80). 0.146 (1.37) −0.042 (0.29). 0.539*** (6.72). LD Labor tax rate. 0.463*** (5.54). LD Consumption tax rate. 0.437*** (4.38). Constant. −0.758***. 0.106. −0.117. (2.82). (0.82). (1.14). Observations. 96. 96. 75. Number of countries. 11. 11. 11. Notes: D denotes the first difference and LD denotes the lagged first difference. Absolute values of tstatistics are in parentheses. *, **, and *** denote significance at 10%, 5%, and 1% levels..
(15) Ryo Takashima. 61. References Arellano, M. and S. Bond, (1991), “Some Tests of Specification for Panel Data: Monte Carlo Evidence and an Application to Employment Equations,” Review of Economic Studies, 58(2), 277-297. Baltagi, B. H., (2001), Econometric Analysis of Panel Data, England: John Wiley & Sons, West Sussex. Carey, D. and J. Rabesona, (2002), “Tax Ratios on Labour and Capital Income and on Consumption,” OECD Economic Studies, No. 35. Daveri, F. and G. Tabellini, (2000), “Unemployment and Taxes – Do Taxes Affect the Rate of Unemployment?” Economic Policy, 15(30), 48-104. Dreher, A., (2006), “The Influence of Globalization on Taxes and Social Policy: An Empirical Analysis for OECD Countries,” European Journal of Political Economy, 22, 179-201. European Commission, (1997), Towards Tax Co-Ordination in the European Union: A Package to Tackle Harmful Tax Competition, COM(97) 495 final. Hall, R. E. and D. W. Jorgenson, (1967), “Tax Policy and Investment Behavior,” American Economic Review, 57(3), 391-414. Hamermesh, D. S., (1993), Labor Demand, Princeton: Princeton University Press. Hatzipanayotou, P., M. S. Michael, and S. Miller, (1994), “Win-Win Indirect Tax Reform: A Modest Proposal,” Economics Letters, 44, 147-151. Jorgenson, D. W., (1963), “Capital Theory and Investment Behavior,” American Economic Review, 53(3), 247-259. Keen, M. and J. E. Ligthart, (2002), “Coordinating Tariff Reduction and Domestic Tax Reform,” Journal of International Economics, 56, 489-507. King, M. A. and D. Fullerton, (1984), The Taxation of Income from Capital: A Comparative Study of the United States, the United Kingdom, Sweden, and West Germany, Chicago: University of Chicago Press. Kiviet, J. F., (1995), “On Bias, Inconsistency and Efficiency of Various Estimators in Dynamic Panel Data Models,” Journal of Econometrics, 68, 53-78. Mendoza, E. G., A. Razin, and L. L. Tesar, (1994), “Effective Tax Rates in Macroeconomics: Cross-Country Estimates of Tax Rates on Factor Incomes and Consumption,” Journal of Monetary Economics, 34, 297-323. Michael, M. S., P. Hatzipanayotou, and S. Miller, (1993), “Integrated Reforms of Tariffs and Consumption Taxes,” Journal of Public Economics, 52, 417-428. Nickell, S., (1981), “Biases in Dynamic Models with Fixed Effects,” Econometrica, 49, 1417-1426. Razin, A., E. Sadka, and P. Swagel, (2002), “Tax Burden and Migration: A Political Economy Theory and Evidence,” Journal of Public Economics, 85, 167-190. Rodrik, D., (1997), Has Globalization Gone Too Far?, Institute for International Economics, Washington, DC. Slaughter, M. J., (2001), “International Trade and Labor-Demand Elasticities,” Journal of International Economics, 54, 27-56..
(16) 62. International Journal of Business and Economics. Sorensen, P. B., (2004), Measuring the Tax Burden on Capital and Labor, Cambridge: The MIT Press..
(17)
數據
+2
相關文件
You are given the wavelength and total energy of a light pulse and asked to find the number of photons it
好了既然 Z[x] 中的 ideal 不一定是 principle ideal 那麼我們就不能學 Proposition 7.2.11 的方法得到 Z[x] 中的 irreducible element 就是 prime element 了..
Wang, Solving pseudomonotone variational inequalities and pseudocon- vex optimization problems using the projection neural network, IEEE Transactions on Neural Networks 17
volume suppressed mass: (TeV) 2 /M P ∼ 10 −4 eV → mm range can be experimentally tested for any number of extra dimensions - Light U(1) gauge bosons: no derivative couplings. =>
For pedagogical purposes, let us start consideration from a simple one-dimensional (1D) system, where electrons are confined to a chain parallel to the x axis. As it is well known
The observed small neutrino masses strongly suggest the presence of super heavy Majorana neutrinos N. Out-of-thermal equilibrium processes may be easily realized around the
Define instead the imaginary.. potential, magnetic field, lattice…) Dirac-BdG Hamiltonian:. with small, and matrix
incapable to extract any quantities from QCD, nor to tackle the most interesting physics, namely, the spontaneously chiral symmetry breaking and the color confinement..
