生技產業IPO風險因子、策略聯盟與折價之關聯性研究 - 政大學術集成
72
0
0
全文
(2) 謝辭 短短兩年的時間,在政大會研所的碩班生活轉眼即逝。在這兩年中,從修 課、做報告到撰寫論文的過程中,皆充滿了回憶,讓我不僅習得專業知識,也 擴充我的視野,讓我感到無比踏實。如今能夠順利的完成論文,需要感謝的人 很多,如果沒有指導老師的照顧與提攜、家人的支持、朋友隨時在旁的關心與 提醒,這篇論文可能無法如期完成。在此,我想對一路走來照顧我的人表達最 誠摯的謝意。 首先,感謝諶家蘭教授在碩班期間對論文指導所付出的用心與耐心,對研 究內容與方向給予引導與支持,讓我能夠更嚴謹的探究研究主題,使得論文得 以圓滿地完成。同時,也十分感激王大維老師,在進行研究的期間,給予很多. 政 治 大 感謝論文口試委員王泰昌教授和蔡揚宗教授,在百忙之中不辭辛勞的審閱 立. 的幫助與指導,協助釐清疑問與盲點,讓研究內容更形完善。. ‧ 國. 學. 論文,並給予不同的觀點與見解,啟發甚大,並讓論文的內容更為完整與充實。 在碩班的生涯中,感謝家人始終如一的支持與鼓勵,謝謝爸媽無怨無悔的 包容與照顧,謝謝哥哥與姐姐的關心與叮嚀,讓我在求學的過程中,無後顧之. ‧. 憂。. y. Nat. 最後,要感謝這段日子,陪伴在我身邊的好朋友。念研究所,第一次住宿. sit. 舍,感謝住在莊敬九舍的如如、香菇、凱西、蕣涵、安柏、一合,感謝有你們. al. er. io. 的陪伴,讓我的宿舍生活充滿樂趣,因為有你們的陪伴,讓我一點都不孤單。. n. v i n Ch 惱並給予我鼓勵,是我最好的夥伴。感謝唯真,總是在我失落時,推我一把, engchi U. 感謝怡靜,陪伴我一起寫論文,總是很有耐心的為我解答,傾聽我的焦慮與煩 不斷鼓勵我,讓我能夠勇敢的往前走。感謝欣穎和婉婷對我的關心與照顧,讓 我感到滿滿的溫暖。感謝子齡學姐和琬琪學姊,在研究所期間的照顧與鼓勵, 和我分享的許多寶貴經驗,對我受益良多。感謝巧意,總是親切地與我分享經 驗並給予我幫助。最後,要感謝我的大學好友鏡樺與高中好姊妹們,總是耐心 的傾聽我的煩惱並直接的鞭策我,讓我能夠積極的面對問題,因為有你們的陪 伴,讓我度過許多煎熬的日子,謝謝你們。 如今,論文順利完成,即將畢業,內心充滿了複雜的情緒,我會好好珍惜 這兩年來所構築的一切回憶,帶著感恩之心繼續前進。.
(3) 摘要 本研究主要探討生技產業公開說明書之風險因子揭露以及首次公開發行 (IPO, initial public offering)前之策略聯盟關係對首次公開發行折價所產生之影 響。本研究以美國生技產業首次公開發行公司為研究對象,樣本期間為 1997 年 至 2012 年。 許多文獻指出當初級市場認購人間資訊不對稱程度越大時,IPO 價值之事前 不確定性(ex ante uncertainty)越高,因此以事前不確定性的概念來衡量資訊不對 稱程度,並透過公開說明書中資訊之揭露作為事前不確定性的代理變數以探討 其與 IPO 折價現象之關聯。本研究即利用公開說明書之風險因子揭露作為事前 不確定性的代理變數,並預期揭露的數量多寡與內容描述將影響 IPO 折價。另. 政 治 大 業特性所造成的不確定性,因此本研究預期生技公司於 IPO 前擁有策略聯盟關 立. 外,由於文獻指出策略聯盟所傳達的正面訊號,可能有助於生技公司減少因產. ‧ 國. 學. 係將影響 IPO 折價。. 本研究參考過去文獻,建立資訊揭露的四級指標加上風險因子所揭露的項 目多寡,系統性地衡量生技公司公開說明書之風險因子,並以多元迴歸分析檢. ‧. 測假說。實證結果顯示:風險因子的內容描述越具量化或越具體,IPO 折價越大,. y. Nat. 並且發現大公司之風險因子揭露數量與 IPO 折價具正向關係,而生技公司於 IPO. sit. 前擁有策略聯盟關係對 IPO 折價幅度具有顯著負向關係。研究結果顯示公開說. al. n. 性。. er. io. 明書之風險因子揭露及策略聯盟與事前不確定性所產生之 IPO 折價現象之關聯. Ch. engchi. i n U. v. 關鍵詞:首次公開發行、生技產業、首次公開發行折價、公開說明書、風險因 子、策略聯盟.
(4) Abstract This study investigates whether disclosure of risk factors in the prospectus and the effect of strategic alliances before IPO date will influence underpricing of the biotech firms. Data is collected for biotech companies of U.S IPOs issued from 1997 to 2012 as the research sample. Much literature indicates that the greater is the information asymmetry between different investors, the higher is the ex ante uncertainty about an initial public offering’s value. Hence, the ex ante uncertainty is measured as the degree of asymmetric information. And there are a number of studies that use different measurement as a proxy for ex-ante uncertainty including disclosures in the. 政 治 大. prospectus to examine its relation to underpricing. This study uses risk factors in the. 立. prospectus as a proxy for ex-ante uncertainty and expects that the quantity of risk. ‧ 國. 學. factors and the content or description of risk factors will influence underpricing. Furthermore, since previous studies consider that strategy alliances convey a positive signal to investors which would reduce the uncertainty from the industrial. ‧. characteristics of the biotech industry and would mitigate investors’ concern, this. io. y. sit. underpricing.. Nat. study expects that a biotech IPO with strategic alliances before IPO date will affect. al. er. Referring to past literature, this study builds four-class index for disclosure. n. v i n C h show that a biotech prospectus. The empirical results e n g c h i U IPO with more quantitative. score and uses the number of risk factors to systematically measure risk factors in the. information or some specific information of risk factors will experience higher underpricing. In addition, in larger firms the greater are risk factors disclosed no matter the quantity or the content and its description, the higher is underpricing. And there is a significantly negative relation between strategic alliances before IPO date and underpricing. In conclusion, disclosure of risk factors in the prospectus and the effect of strategic alliances are related to underpricing as expected.. Keywords: Initial public offerings, Biotech industry, Underpricing, Prospectus, Risk factor, Strategic alliance.
(5) Table of Contents 1. INTRODUCTION .................................................................................................. 1 1.1 Research Purpose and Motivation .................................................................. 1 1.2 Research Questions ........................................................................................ 4 1.3 Research Structure ......................................................................................... 5 2. LITERATURE REVIEW ...................................................................................... 6 2.1 IPO Underpricing and Asymmetric Information ........................................... 6 2.2 Risk Factor ................................................................................................... 12. 政 治 大 2.4 The Biotech Industry and Strategic Alliance ............................................... 16 立 2.3 Disclosures and Content Analysis ................................................................ 13. ‧ 國. 學. 3. METHODOLOGY............................................................................................... 20 3.1 Hypothesis Development ............................................................................. 20. ‧. 3.2 Data Collection............................................................................................. 25. sit. y. Nat. 3.3 Research Method .......................................................................................... 28. io. al. er. 3.4 Research Model ............................................................................................ 31 4. RESEARCH RESULTS AND ANALYSIS......................................................... 36. n. v i n C h.................................................................................... 4.1 Descriptive Statistics 36 engchi U 4.2 Empirical Results ......................................................................................... 40. 5. CONCLUSIONS AND DISCUSSION ............................................................... 47 5.1 Conclusions .................................................................................................. 47 5.2 Limitations and Future Research ................................................................. 50 References. ............................................................................................................. 52. Appendix. ............................................................................................................. 56.
(6) List of Tables Table 3-1 Frequency Distribution .............................................................................. 26 Panel A. By Year ................................................................................................ 26 Panel B. By Industry .......................................................................................... 27 Panel C. By Alliance .......................................................................................... 27 Table 3-2 Four-class index ......................................................................................... 30 Table 4-1. Descriptive Statistics ................................................................................. 38 Panel A. Full Sample .......................................................................................... 38. 政 治 大 Table 4-2. Pearson/Spearman Correlation .................................................................. 39 立 Panel B. Sample divided by Size ....................................................................... 38. ‧ 國. 學. Table 4-3. Results for Underpricing and Strategic Alliances ..................................... 41 Table 4-4. Results for Underpricing and Risk Factors ............................................... 44. ‧. Table 4-5. Results for Underpricing and Risk Factors under Different Firm Size..... 46. n. er. io. sit. y. Nat. al. Ch. engchi. i n U. v.
(7) List of Figures Figure 1-1. Research Structure ..................................................................................... 5. 立. 政 治 大. ‧. ‧ 國. 學. n. er. io. sit. y. Nat. al. Ch. engchi. i n U. v.
(8) List of Appendixes Appendix 1. Variable Definitions ............................................................................... 56 Appendix 2. The Results of the Content Analysis about Risk Factors from 210 Biotech Companies ............................................................................... 57. 立. 政 治 大. ‧. ‧ 國. 學. n. er. io. sit. y. Nat. al. Ch. engchi. i n U. v.
(9) 1. INTRODUCTION 1.1 Research Purpose and Motivation Underpricing of initial public offerings is proved to be prevalent in many countries’ stock market. In the past, a great amount of theoretical literature analyzes what reasons lead to underpricing of initial public offerings. One of the previous theories is based on asymmetric information. The first and best known study of asymmetric information about IPO underpricing is modeled by Rock (1986) and addresses “winner’s curse” that IPO. 政 治 大. underpricing is a consequence of rational behavior by issuing firms in an. 立. environment characterized by information asymmetry between different investors. ‧ 國. 學. (Givoly and Shi 2008). In order to attract uninformed investors, issuers have to. ‧. compensate uninformed investors for the risk of subscribing the shares of inferior offerings. Afterward Beatty and Ritter (1986) quote Rock’s theory and introduce ex. y. Nat. io. sit. ante uncertainty to measure the degree of asymmetric information. They predict that. n. al. er. there is a positive association between the ex ante uncertainty about the value of an. Ch. i n U. initial public offering and its expected initial return.. engchi. v. Subsequently, there is a great deal of literature that uses different measurement as a proxy for ex ante uncertainty including the information disclosed in the prospectus. Disclosure of use-of-proceeds or risk factors in the prospectus is regarded as a proxy for ex-ante uncertainty. Beatty and Ritter (1986) finds that issues for which there is greater ex ante uncertainty tend to have greater the number of use-of-proceeds listed. And the result corroborates the proposition that the greater is the ex ante uncertainty about the value of an issue, the greater is the expected underpricing. Beatty and Welch (1996) indicates that firms citing more risk factors must increase IPO underpricing. More recently, Hanley and Hoberg (2008) use word 1.
(10) content analysis to make a study of the relation between disclosures in the prospectus and initial returns. Arnold, Fishe, and North (2010) also find that ambiguous information in the risk factors section is positively related to underpricing. According to previous research, this study regards disclosure of risk factors as a proxy for ex-ante uncertainty to analyze its relation to IPO underpricing. In order to measure risk factors in the prospectus, two approaches are applied. The first approach that counting the number of captioned risks in the risk factors section is similar with past study. In addition to the quantity of disclosure, this study also. 政 治 大. focuses on the content and description of risk factors which is coded on the basis of. 立. four-class index to be disclosure score under the second approach. Therefore, this. ‧ 國. 學. study examines the association between disclosure of risk factors and underpricing by the number of risk factors and disclosure score separately. Moreover, because. ‧. there may be greater losses that large companies can bring about from facing risks,. Nat. sit. y. investors will pay more attention to the information disclosed in the prospectus. This. n. al. er. io. study will think over the effect of firm size on the relation between disclosure of risk factors and underpricing.. Ch. engchi. i n U. v. Furthermore, this study focuses on the biotech companies in the U.S IPO market because industrial characteristics of the biotech industry will affect investor’s evaluation of the company value and ex ante uncertainty of issues. Recently many scholars begin to explore the valuation of biotech IPOs or information disclosed in the biotech industry. They think the biotech industry is growing fast and its products under development are novel. Thus, there is the large information asymmetry between managers and investors and it is difficult for investors to evaluate the value of the biotech firms. However, much prior literature indicates that one way that biotech companies have tried to moderate investors’ concern is to ally with major 2.
(11) pharmaceutical and health care companies which have prominent marketing and sales expertise as well as financial capital that can support the biotech firms through product development process (Guo, Lev, and Zhou 2004). Stuart, Hoang, and Hybels (1999) indicates that if young firms in the biotech industry tie to major pharmaceutical and health care companies, it can signal a firm’s quality to key external resource holders, which affects IPO performance. Besides, Jensen (2004) also argues that a firm’s alliance activity provides valuable market signals because alliances are widely observable and reflect the extent to which a firm’s resources and. 政 治 大. capabilities are in demand by other organizations. According to previous research,. 立. this study thinks that strategy alliance conveys a positive signal to investors. It means. ‧ 國. 學. firms with strategic alliances will be less risky and less uncertainty. Consequently, this study also discusses the impact of strategic alliances on the association with. ‧. underpricing and predicts that a biotech firm with strategic alliances before IPO date. Nat. sit. y. will experience lower underpricing.. n. al. er. io. Based on above discussion, this study analyzes biotech firms of IPOs in. i n U. v. America during 1997-2012 and considers the impact of strategic alliances during. Ch. engchi. 1990-2012 to examine the effect of disclosure of risk factors and strategic alliances on underpricing.. 3.
(12) 1.2 Research Questions According to the research purpose and motivation, the research questions of this study are as follows: 1.. How does disclosure of risk factors impact on underpricing?. 2.. How is disclosure of risk factors associated with underpricing under different firm size?. 3.. How is the effect of strategic alliances before IPO date associated with underpricing?. 政 治 大. The remainder of this paper is organized as follows. Section 2 presents relevant. 立. literatures. Research methodology is described in Section 3. In Section 4, the study. ‧ 國. 學. presents the empirical results. Finally, conclusion is provided in Section 5.. ‧. n. er. io. sit. y. Nat. al. Ch. engchi. 4. i n U. v.
(13) 1.3 Research Structure The research structure in this study is presented as follows: Figure 1-1. Research Structure. Introduction. Literature Review. 立. 政 治 大 Research Methodology. ‧. ‧ 國. 學. n. al. er. io. sit. y. Nat. Empirical Results and Analysis. C h ConclusionsU n i engchi. 5. v.
(14) 2. LITERATURE REVIEW 2.1 IPO Underpricing and Asymmetric Information Underpricing of initial public offering (IPO) is first found by Stoll and Curley (1970)、Logue (1973)、Reilly (1973) and Ibbotson (1975). Afterward many scholars begin researching into the causes of underpricing. There are many explanations for IPO underpricing including: asymmetric information, signaling, litigation, agency cost and so on. However, this study primarily analyzes the relation between risk factors in the prospectus and underpricing. Therefore, in this section this study. 政 治 大. focuses on the literature related to asymmetric information.. 立. The first and best known study of asymmetric information about IPO. ‧ 國. 學. underpricing is modeled by Rock (1986). Rock theorizes “winner’s curse” and. ‧. develops a model showing that IPO underpricing is a consequence of rational behavior by issuing firms in an environment characterized by information asymmetry. y. Nat. io. sit. between different investors (Givoly and Shi 2008). There are “informed investors”. n. al. er. like investment institution and “uninformed investors” in the stock market. Informed. Ch. i n U. v. investors have superior information about the true value of the issue. If the real value. engchi. of superior IPO firms is underestimated or the price after offering is expected to exceed the offer price, informed investors will invest. That is to say, superior offerings will attract informed investors and uninformed investors simultaneously and it will cause oversubscription. But inferior offerings will be subscribed only by uninformed investors. As a result of this information asymmetry, uninformed investors have a greater probability of buying undesirable offerings. In the long run, uninformed investors will reduce the aspirations to invest and withdraw from the stock market. Therefore, in order to induce uninformed investors to participate in the IPO market, issuers must underprice the securities to compensate uninformed 6.
(15) investors for the risk of subscribing the shares with overestimated offer price. In order to further explain the winner’s curse in IPO market, Rock’s model has been validated by a number of empirical studies. Beatty and Ritter (1986) quote Rock’s theory and introduce ex-ante uncertainty 1 to measure the degree of asymmetric information. They regard the number of use of proceeds listed in the prospectus as a proxy for ex ante uncertainty and prove there is a positive relation between the ex ante uncertainty about an initial public offering’s value and its expected initial return. This means that as the ex ante uncertainty increases, potential. 政 治 大. investors have an incentive to become informed investors to incur costs doing. 立. security analysis to discern which issues are likely to appreciate in price.. ‧ 國. 學. Consequently, the problem of winner’s curse intensifies. In order to make uninformed investors be willing to submit a purchase order for shares in an offering. ‧. with greater ex ante uncertainty, issuers have to underprice.. Nat. sit. y. Subsequently, there are a number of studies that use different measurement as a. n. al. er. io. proxy for ex-ante uncertainty including characteristics of company or underwriting,. i n U. v. certification, disclosure in the prospectus and after-market variables.. Ch. engchi. First, characteristics of company comprise firm age which is the age of the issuing firm at the time of the offer. Megginson and Weiss (1991) use firm age as a control for the degree of information asymmetry. Similar to Muscarella and Vetsuypens (1989), there is a significantly negative relationship between the age of the firm and initial returns. In general, more public information is available about the value of older firms, which can reduce information asymmetries. This implies that older firms have a lower degree of information asymmetry than do younger firms. 1. “ex-ante uncertainty” means the degree of uncertainty about the value of the IPOs for investors in primary market. Even though on average initial public offerings are underpriced, an investor submitting a purchase order cannot be certain about an offering’s value once it starts publicly trading (Beatty and Ritter 1986). 7.
(16) Second, characteristics of underwriting involve gross proceeds raised in an offering. Beatty and Ritter (1986) use the inverse of the gross proceeds to be a proxy for ex ante uncertainty because smaller offerings are more speculative, on average, than larger offerings. Small offering tend to be issued by more speculative firms, whereas larger offerings tend to be issued by more established firms where there is less information asymmetry. Hence, offering size can send signals to the market about the relative quality and stability of an offering (Ibbotson and Ritter 1995). And the empirical analysis indicates that smaller offerings, ceteris paribus, have. 政 治 大. substantially higher average initial returns (Beatty and Ritter 1986).. 立. Third, certification comprises venture capital backing indicating whether a firm. ‧ 國. 學. has venture financing prior to its IPO. Some previous research has suggested that the certification and monitoring role of venture capitalists diminishes underpricing. ‧. (Barry, Muscarella, Peavy and Vetsuypens 1990; Megginson and Weiss 1991).. Nat. sit. y. Megginson and Weiss (1991) support for the certification role of venture capitalists. n. al. er. io. in bringing new issues to market by examining the impact of venture capitalists on. i n U. v. the pricing. There is a negative and statistically significant relation between the. Ch. engchi. presence of venture capitalists and initial returns in IPOs. These suggest that by reducing the information asymmetry between the issuing firm and investors, venture capitalists are able to lower underpricing. The evidence reported in Ljungqvist and Wilhelm (2003) also support that the greater is the investment bank’s equity holding, the lower are first-day returns. Last, many scholars study the influence of information disclosed in the prospectus. They regard use of proceeds or risk factors in the prospectus as a proxy for ex-ante uncertainty. The SEC’s Regulation S-K governs the required disclosure in the non-financial portions of the prospectus. The number of use of proceeds listed is 8.
(17) a proxy for ex ante uncertainty largely as a result of Securities and Exchange Commission (SEC) regulation which requires more speculative issues to provide relatively detailed enumerations of use of proceeds, while not requiring more established issuers to be very explicit. As a result of this regulation, issues for which there is greater ex ante uncertainty tend to have a greater number of use of proceeds listed (Beatty and Ritter 1986). After the empirical analysis, the positive coefficient on this variable indicates that investors interpret this measurement as positively correlated with ex ante uncertainty. And the result corroborates the proposition that. 政 治 大. the greater is the ex ante uncertainty about the value of an issue, the greater is the. 立. expected underpricing.. ‧ 國. 學. However, while U.S. securities regulation mandates disclosure of the intended use of IPO proceeds in the prospectus, each firm voluntarily chooses the extent of. ‧. specificity. In practice, registrants can exercise considerable latitude with respect to. Nat. sit. y. the specificity of information they provide (Leone, Rock, and Willenborg 2007).. n. al. er. io. Leone et al. (2007) use Rock (1986) theory and suggest that IPO issuers with an. i n U. v. increase in the extent of dollar detail regarding their intended use of proceeds have. Ch. engchi. less ex ante uncertainty and lower IPO underpricing. This study indicates that IPO firms in order to reduce ex ante uncertainty regarding the value of their shares and the extent to which the IPO is underpriced, they may choose to detail use of proceeds in the prospectus. Following a recently developed measurement (Leone et al. 2007), Nam, Arthurs, Nielsen, Mousa and Liu (2008) find a negative relationship between information disclosure and underpricing. This means that disclosing information can reduce the uncertainty of the firm to make investors be able to forecast the value of the issue. In addition to use of proceeds, IPO underpricing has been tested by a number of 9.
(18) studies that use risk factors in the prospectus as a proxy for ex-ante uncertainty. Beatty and Welch (1996) imply that firms in which investors have been given adverse information in the prospectus that will reduce their chances of prevailing in a subsequent lawsuit are indeed riskier for first-day investors. Because Section 11 of the Securities Act of 1933 imposes legal liability on members of the IPO coalition for misrepresentation in the registration statement, an increase in the quantity of potentially adverse disclosures (proxied by the number of risk factors and use of proceeds) in the registration statement reduces the likelihood of a successful. 政 治 大. class-action lawsuit (Beatty and Welch 1996). The cost of this liability reduction is a. 立. loss of issue desirability, for both IPO offer price and after-market valuation.. ‧ 國. 學. Consequently, firms citing more risk factors must increase IPO underpricing, indicating that first-day investors must be compensated for accepting more firm. ‧. caution.. Nat. sit. y. In America, SEC expects that full disclosure of material facts about the offering. n. al. er. io. will help investors evaluate the condition of the company and may make informed. i n U. v. investment decisions. However, Item 503(c) of Regulation S-K requires companies. Ch. engchi. to “provide a discussion of the most significant factors that make the offering speculative or risky.” This rule specifies that companies should “set forth each risk factor under a subcaption that adequately describes the risk,” but gives only limited guidance as to what defines a “significant” risk factor. Therefore, management requires greater judgment regarding what to say and what to be included in risk factors section. Besides, ambiguity arises in risk factors section which is written to lack certainty. Management cannot declare that unknown future events will or will not happen. It is left to investors to consider what is likely to occur regarding each risk. Therefore, the interpretation of these risks will vary across investors. And 10.
(19) ambiguous information in risk factors section will influence investors’ portfolio choices, because IPO issuers are without public records regarding company news and returns. Therefore, investors are more likely to rely on the prospectus when formulating investment decisions and will expect a premium from firms that expose them to more ambiguous information. Consequently companies with more ambiguity in their offering prospectuses experience higher underpricing at the IPO (Arnold, Fishe, and North 2010). Furthermore, there is some literature analyzing the whole prospectus to study. 政 治 大. underpricing of IPOs. Hanley and Hoberg (2010) use word content analysis to. 立. decompose information in the initial public offering prospectus into its standard and. ‧ 國. 學. informative components. The sections contained in the prospectus are“Prospectus Summary,” “Risk Factors,” “Use of Proceeds,” and “Management’s Discussion and. ‧. Analysis.” Their approach used to decompose text is to identify the standard content. Nat. sit. y. which has two components: content from recent and content from IPOs in the same. n. al. er. io. industry (industry-specific content). Recent IPOs are those that were filed in the. i n U. v. ninety-day period preceding the current IPO’s initial filing date. And the. Ch. engchi. same-industry IPOs were filed before this ninety-day window to one year. The content not explained by these two sources is defined to be informative content. The empirical results show that greater standard content will result in greater offer price changes and higher underpricing as compensation to investors for revealing information. On the contrary, greater informative content results in more accurate offer price and less underpricing because it decreases the issuing firm’s reliance on bookbuilding to price the issue.. 11.
(20) 2.2 Risk Factor The most commonly used approach to measure risk factors in the prior literature is the number of risk factors listed in the prospectus. Since personal legal liability stemming from the Securities Act of 1933 is imposed on top management's presentation of risk factors in the registration statement, differences in the number of risks described in the registration statements capture fundamental differences in the riskiness of IPO firms (Feltham, Hughes, and Simunic, 1991). Hence, top management must explicitly list and discuss risk factors faced by the IPO firms.. 政 治 大. Beatty and Zajac (1994) regard the number of risk factors described in the IPO. 立. registration statement as a proxy for risk and has shown that this measure is a useful. ‧ 國. 學. way to code risk.. Welbourne and Andrews (1996) code risk factors to be a summated risk measure. ‧. indicating the level of a firm's risk. The presence of the following risk factors is. Nat. sit. y. included in this measure: technological obsolescence, new product, few or limited. n. al. er. io. products, low number of years in operation, inexperienced management, technical. i n U. v. risk, seasonality, customer dependence, supplier dependence, inexperienced. Ch. engchi. underwriters, competition, legal proceedings against company, liability, and government regulation. Consistent with prior research (e.g. Welboume and Andrews 1996), Cyr, Johnson, Welbourne (2000) use a summated measure of eighteen different types of risk factors. Some of the more commonly cited risk factors include competition,. dependence. on. key. employees,. competitive. labor. markets,. technological obsolescence, government regulation, and few or limited products. Arthurs, Hoskisson, Busenitz and Johnson (2008) also use Welbourne and Andrews (1996) summated risk factors and find that there is a positive relation between risk factors and underpricing. 12.
(21) Certo, Covin, Daily and Dalton (2001) consider that while all risk factors are not equally impactful, more risk factors generally indicate a higher risk position. Examples of the types of issues listed as risk factors in the sampled firms’ prospectuses include manufacturing capacity limitations, rapid technological change, intense competition, need for additional capital, and uncertainty regarding patents and protection of proprietary rights. And they think that risk factors associated with a firm can affect both performance expectations and realized performance.. 2.3 Disclosures and Content Analysis. 政 治 大. Some literature has dealt with information disclosure in annual report or. 立. prospectus to study a variety of topics. In order to analyze the influence of word. ‧ 國. 學. content, there is a common way to be applied. The way is content analysis which is a set of procedures to make valid inferences from messages (Weber 1990). In other. ‧. words, content analysis is a technique for gathering data that involves codifying. Nat. sit. y. qualitative and quantitative information into predefined categories to derive patterns. n. al. er. io. in presenting and reporting information. Thus, content analysis seeks to analyze. i n U. v. published information systematically, objectively and reliably (Krippendorf, 1980; Guthrie and Parker, 1990).. Ch. engchi. Freedman and Stagliano (1992) suggest that assessments of quality are more important because this method of content analysis focuses on what is included in the theme, rather than how much is said. The meaning of the message is what is important, as considering only the quantity of disclosures does not convey the importance of the disclosures. Therefore, Walden and Schwartz (1997) use two systems of enumeration to capture the quantity of disclosures and establish assessments of the quality. The first system of enumeration considers the quantity of disclosures. The quantity score is the 13.
(22) summation of the number of sentences or financial statement lines per environmental theme. The second system of enumeration considers the quality or information content of the disclosures. It is referred to as a disclosure score which is the summation of the disclosure quality per environmental theme. The four elements used are: 1) effect--significant or not significant; 2) quantification--monetary or not monetary; 3) specificity--specific as to actions, persons, events, or places, or not specific, and 4) time frame--past, present, or future. Each element of the index which is present in the disclosure receives one point. If the disclosure involves the future, or. 政 治 大. the disclosure is monetary, it receives two points for each. If the disclosure involves. 立. the current reporting period, it receives one point. No points are given if the. ‧ 國. 學. disclosure involves the past or the element is not present. Therefore, each environmental disclosure by theme can receive a minimum of zero point and a. ‧. maximum of six points based on the four-element index. The nature, extent, and. Nat. sit. y. timing of environmental disclosures are examined to measure objectively the. al. n. for analysis.. er. io. information contained in the disclosures and to provide a systematic numerical basis. Ch. engchi. i n U. v. Based on previous research, recent studies use content analysis to analyze information content of disclosures. Hughesa, Andersonb and Goldenc (2001) evaluate the content of each sentence in listed 23 items by weighting score. Content is classified as: 1) Quantitative which carries a weight of four - the environmental impact is clearly defined in monetary terms or actual physical quantities; 2) Descriptive which carries a weight of three - the impact on the company or its policies is clearly evident; 3) Vague which carries a weight of two - disclosures are limited to passing comments of environmental effects within discussions of other topics; and 4) Immaterial which carries a weight of one- those disclosures that state 14.
(23) environmental issues are immaterial to the financial condition and results of the corporation. This weighting method is used in conjunction with environmental ratings of US corporations and is investigated whether disclosures differ between firms who have been rated good, mixed or poor in their environmental activities and whether these disclosure differences could be used to differentiate between actual environmental performance levels. Hali (2002) recognizes three categories of voluntary disclosure in an annual report including (1) background and non-financial information, such as principal. 政 治 大. products and markets and organizational structure or operational efficiency, to. 立. provide insights into a firm's competitive environment and into its performance. ‧ 國. 學. where not properly reflected in current financial statements; (2) trend analysis and management discussion and analysis, such as sales trends over the last several years. ‧. and qualitative discussion of last year's change, to allow investors to evaluate a. Nat. sit. y. company's financial history; (3) risk, value-based and projected information, such as. n. al. er. io. risk exposure, management compensation or earnings forecasts, to assess. i n U. v. management's contribution to create shareholder value and to enlighten the firm's. Ch. engchi. future prospects. Three categories contain 27 items. Each item scores two points if there is a detailed description including quantified information or qualitative discussion, one point if it is mentioned in annual reports but only generally and zero otherwise. No weighting is used so that the overall score represents a simple summation of its components suggesting that every item analyzed is equally important. The empirical result indicates that there is a negative and highly significant association between the disclosure quality and cost of equity capital. Cerbioni and Parbonetti (2007) use content analysis to examine the relationship between governance variables and voluntary intellectual capital disclosure in annual 15.
(24) reports in a sample of European biotechnology firms. They examine both the quantity and the quality of voluntary disclosures provided. The sentence is chosen as a recording unit because it is considered a more reliable unit of analysis. A sentence is coded with a score of 0 if it provides no information; with a score of 1 if it provides qualitative information; with a score of 2 if it provides quantitative information. Sentences containing general assumptions (e.g. ‘we strongly believe that . . .’) or information already given are coded as 0 to prevent firms from the possibility of simply adding more sentences to a report to obtain a higher disclosure. 政 治 大. score while a concise report could have a lower score. This methodology allows. 立. building both a total score for a company and various scores for more specific. ‧ 國. 學. aspects of its disclosure. The results of this study indicate that corporate governance mechanisms and voluntary disclosure can be used strategically to reduce agency. ‧. conflicts.. Nat. sit. y. In addition to the presence or absence of information, according to the previous. n. al. er. io. studies, content of information will be analyzed systematically through the method of. i n U. v. weighting score which will facilitate doing research into non-financial information.. Ch. e nStrategic 2.4 The Biotech Industry and g c h i Alliance Regarding uncertainty of the company value, category of industries will affect investor’s evaluation of the company value. The young biotech firms are in an intense competition to discover and patent a new drug because biotech firms are highly dependent on the intellectual property generated through their large R&D expenditures and, as such, are among the most intangible-intensive of businesses. The value chain of the typical biotech firms stretches some 10–15 years from founding through patenting to successful FDA approval and product sales. Therefore, it has large capital needs over a long period of time. In the early stages of life, the 16.
(25) firm’s capital needs are met by venture capital and strategic equity investments from pharmaceutical companies. However, capital needs typically become so large that they can only be satisfied through an IPO or mergers and acquisitions by a large pharmaceutical company. Successful biotech firms therefore tend to go public rapidly. Consequently, biotechnology is a very risky but potentially very lucrative equity investment (Hand 2005). Due to many industrial characteristics in the biotech industry such as the complexity of biotech products, long development time and rapid pace of innovation,. 政 治 大. there is the large information asymmetry between managers and investors and it is. 立. difficult for investors to evaluate the value of the biotech firm. Hence, recently many. ‧ 國. 學. scholars make a study of the valuation in the biotech industry. Guo, Lev, and Zhou (2004) consider that in terms of the number of companies,. ‧. innovative products, and contribution to social welfare, the biotech industry is among. Nat. sit. y. the largest and fastest growing sectors of the economy. Because most companies. n. al. er. io. develop only a few products and the entrance of a competitor poses a serious survival. i n U. v. threat, the biotech industry is fiercely competitive and disclosure costs are generally. Ch. engchi. high. And they find that biotech firms’ disclosures affect their bid-ask spreads and stock return volatility. Guo, Lev, and Zhou (2005) think that the unique challenge to the valuation of IPOs lies in the meager information about the firm and its prospects that is publicly available at IPO date. There are generally no established histories of sales, earnings or cash flows for the firms going public and in biotech IPOs the primary assets are intangibles which are notoriously difficult to value. However, it is important to gain a thorough understanding of the valuation of enterprises that are newly introduced into capital markets because the valuation of IPOs is of considerable practical and 17.
(26) theoretical importance, particularly in dynamic economies. In order to examine the valuation of biotech IPOs, they introduce the number of alliance agreements to be one of potential value driver. Alliance agreements may be value-relevant because they generally involve the contribution of research capabilities or capital by partners. Furthermore, they often carry a positive signal about the future market potential of the product under development. However, they find a negative association between IPO price and the issuer’s the number of alliances/joint ventures. The argument may be that the IPO firm relinquishes equity in exchange for research and marketing. 政 治 大. support in the process, and it apparently reflects investors’ assessment that issuers. 立. transfer too much value to alliance partners. Although there is a negative relation. ‧ 國. 學. between alliances variable and IPO prices, alliances variable has a positive and significant coefficient in the long-term regressions. The potential explanation is that. ‧. the benefits of alliances (higher revenues and earnings) become clear over time and. Nat. sit. y. investors revise the early valuation to reflect the contribution of alliances.. n. al. er. io. Speaking of the benefits of alliances, much prior literature researches into the. i n U. v. impact of strategic alliances on the company value in the biotech industry. Pisano. Ch. engchi. (1991) indicates that due to the long product development cycles and the needs for cash in the hundreds of millions of dollars, biotechnology firms tend to be far from generating revenues when they try to go public. And one way that biotech firms have tried to moderate investors’ concern is to ally with major pharmaceutical and health care companies which have prominent marketing and sales expertise as well as financial capital that can support the biotech firms through product development process. Gulati (1999) considers that strategic alliances may provide opportunities for codevelopment, the sharing of capital, technology or firm-specific assets. And in the 18.
(27) same year, Stuart, Hoang, and Hybels(1999) indicate that if young firms in the biotech industry tie to major pharmaceutical and health care companies, it can signal a firm’s quality to key external resource holders, which affects IPO performance. Based on above arguments, Gulati and Higgins (2003) propose that the signal associated with a firm’s strategic alliances may vary with the types of uncertainty that characterize different market situations and the extent to which these alliance partners are most actively engaged in evaluating young firms. During hot markets, a young biotechnology firm’s concerns regarding its ability to sustain the long. 政 治 大. discovery and development process are not as acute as during cold markets when the. 立. availability of funding is much scarcer. Therefore, during cold markets, prominent. ‧ 國. 學. pharmaceutical/health care firms necessarily attend more closely to the potential of young biotechnology firms since so many firms come knocking on their doors for. ‧. resources. Consequently, the fact that a major strategic alliance partner chooses a. Nat. sit. y. particular firm during an unfavorable market, may send a particularly powerful. n. al. er. io. signal to outsiders, such as investors, that it is a firm worth investing in.. i n U. v. Besides, Jensen (2004) also argues that a firm’s alliance activity provides. Ch. engchi. valuable market signals because alliances are widely observable and reflect the extent to which a firm’s resources and capabilities are in demand by other organizations. According to previous research, strategy alliances convey a positive signal to investors. Thus, a firm’s strategic alliances may influence its capabilities as well as others’ perceptions of its capabilities. If a new firm lacks resources and suffers from uncertainty about its products and alliances can provide an access to resources it lacks, then a firm’s alliances should provide a significant buffer against the hazards. This means firms with strategic alliances would be less risky and less uncertainty. 19.
(28) 3. METHODOLOGY 3.1 Hypothesis Development In this section, there are three hypotheses discussed and provided as follows: 3.1.1 The Relation between Underpricing and Strategic Alliances In the light of prior theoretical literature, there are many factors leading to underpricing of initial public offerings. One of the theories is about asymmetric information. Beatty and Ritter (1986) cite Rock’s theory and introduce ex-ante uncertainty to measure the degree of asymmetric information. That is to say,. 政 治 大. when investors are conscious of more uncertainty about the value of IPOs, there. 立. is the greater degree of asymmetric information between investors. This means. ‧ 國. 學. that as the ex ante uncertainty increases, potential investors have an incentive to. ‧. do analysis to discriminate which issues are likely to appreciate in price. Therefore, the problem of winner’s curse becomes acute. In order to prompt. y. Nat. io. sit. uninformed investors to invest in an offering with greater ex ante uncertainty,. n. al. er. issuers have to underprice. And the empirical results show that there is a positive. Ch. i n U. v. relation between the ex ante uncertainty and underpricing.. engchi. The reasons for high ex ante uncertainty are different. One of causes is the risks IPO firms encounter. There are generally no established histories of sales, earnings or cash flows for the firms going public. The biotech firms, particularly, face greater uncertainty and risk in IPO market because of intense competition, long period in research and development and great need for capital. Besides, in biotech IPOs the primary assets are intangibles which are notoriously difficult to value (Guo et al. 2005). In order to mitigate investors’ concern, biotech firms will ally with major pharmaceutical and health care companies which have prominent marketing and 20.
(29) sales expertise as well as financial capital that can support the firms through product development process (Pisano1991). In addition, alliances are widely observable and reflect the extent to which a firm’s resources and capabilities are in demand by other organizations which provides valuable market signal for investors (Jensen 2004). Therefore, by means of strategic alliances, biotech firms will reduce the concern investors feel. And the ex ante uncertainty will be decreased to lessen the level of asymmetric information. Accordingly, this study hypothesizes that a. 政 治 大. negative relationship exists between strategic alliances and underpricing.. 立. 學. there is a strategic alliance occurred before the IPO date.. ‧. ‧ 國. Hypothesis 1. Underpricing will be likely to decrease in biotech firms when. n. er. io. sit. y. Nat. al. Ch. engchi. 21. i n U. v.
(30) 3.1.2 The Relation between Underpricing and Risk Factors In prior research, for the purpose of analyzing the relation between underpricing and ex-ante uncertainty, some studies use risk factors in the prospectus as a proxy for ex-ante uncertainty. Beatty and Welch (1996) demonstrate that an increase in the quantity of potentially adverse disclosures proxied by the number of risks in the registration statement reduces the likelihood of a successful class-action lawsuit. Hence, firms citing more risk factors must increase IPO underpricing indicating that first-day investors must be. 政 治 大. compensated for accepting more firm caution. Moreover, Arnold et al. (2010). 立. think that risk factors in the prospectus lack certainty. Management cannot. ‧ 國. 學. declare that unknown future events will or will not happen. It is left to investors to consider what is likely to occur with respect to each risk. Therefore, the. ‧. information disclosed in the risk factors section is ambiguous. And IPO issuers. Nat. sit. y. are without a public record about company news and returns. Investors are more. n. al. er. io. likely to depend on the prospectus when making investment decisions and will. i n U. v. expect a premium from firms that expose them to more ambiguous information.. Ch. engchi. Consequently, this study hypothesizes that there is a positive relation between underpricing and risk factors. In order to measure risk factors in the prospectus, the first approach applied is on the basis of previous literature2 using a summated measure of different types of risk factors presented in the prospectus. This study compiles 20 items which commonly listed as risk factors from prior studies. Certo et al. (2001) consider that more risk factors generally indicate a higher risk position. And Arthurs et al. (2008) find that there is a positive relation between risk factors and 2. Beatty and Zajac (1994) ; Welbourne and Andrews (1996) ; Cyr, Johnson and Welbourne (2000) ; Certo, Covin, Daily and Dalton (2001) 22.
(31) underpricing. Therefore, this study hypothesizes that the greater number of risk factors among 20 items presented in prospectus, the greater is underpricing. In addition to analyzing the number of items listed in the risk factor section, the second approach is based on the literature about information disclosure and content analysis. Freedman and Stagliano (1992) suggest that the meaning of the message is what is important and what is included in the theme, rather than how much is said. Therefore, this study evaluates the content of each item in listed twenty risk factors by weighting score. The summation of disclosure score in. 政 治 大. each item presented indicates the level of a firm's risk. That is to say, if the. 立. disclosure score is higher, the level of a firm's risk is higher. Hence this study. ‧ 國. 學. expects that the greater is the disclosure score of risk factors among 20 items presented in the prospectus, the greater is underpricing.. ‧. According to the above inference, the hypotheses are following: Underpricing becomes greater when the summated number of risk factors among twenty items increases.. er. io. sit. 2.1. y. Nat. Hypothesis. n. a l Underpricing becomes greater v when the summated i n Ch e nscore disclosure g c hof iriskU factors among twenty items. 2.2. increases.. 23.
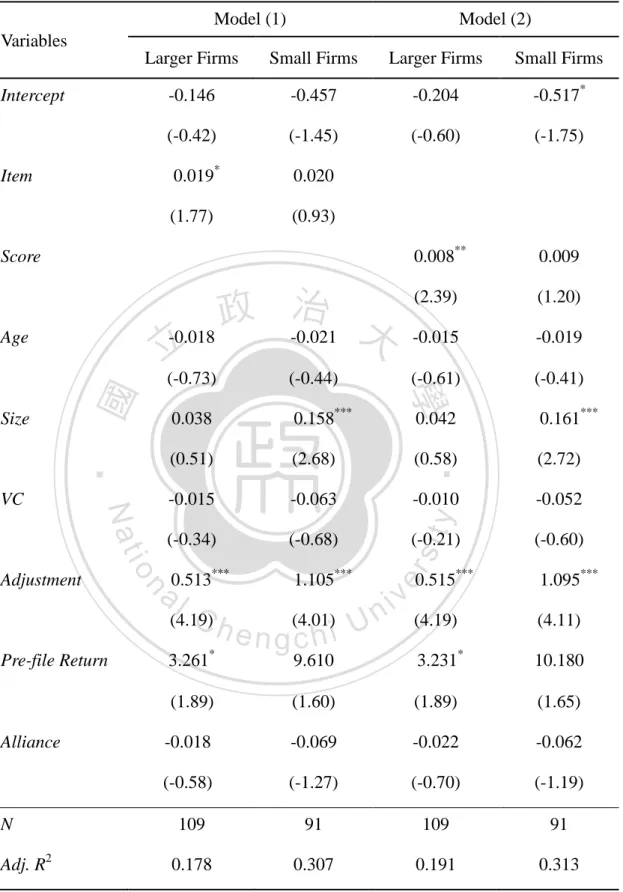
(32) 3.1.3 The Relation between Underpricing and Risk Factors under Different Firm Size In addition, the firm size may influence the relation between underpricing and risk factors because investors may prefer to find the information about larger firms owing to higher profits that investors can generate by trading in larger firms (Atiase 1980, 1985). In other words, there may be greater losses that large companies can bring about from facing the risks. And Atiase (1980) argues that the amount of private predisclosure information production and dissemination is. 政 治 大. an increasing function of firm size. Therefore, the impact of information. 立. disclosed in the prospectus provided for investors in larger firms will be more. ‧ 國. 學. obvious. That is to say, the association between risk factors and underpricing will have a better effect. Accordingly, this study expects that considering the firm size,. ‧. there is more likely to be a positive relation between underpricing and risk. sit. y. Nat. io. Hypothesis 3.1. Underpricing is more likely to become greater with larger. er. factors.. n. afirms i v when the summated number l C than with smaller firms n U items increases. h e n gamong of risk factors c h i twenty. 3.2. Underpricing is more likely to become greater with larger firms than with smaller firms when the summated disclosure score of risk factors among twenty items increases.. 24.
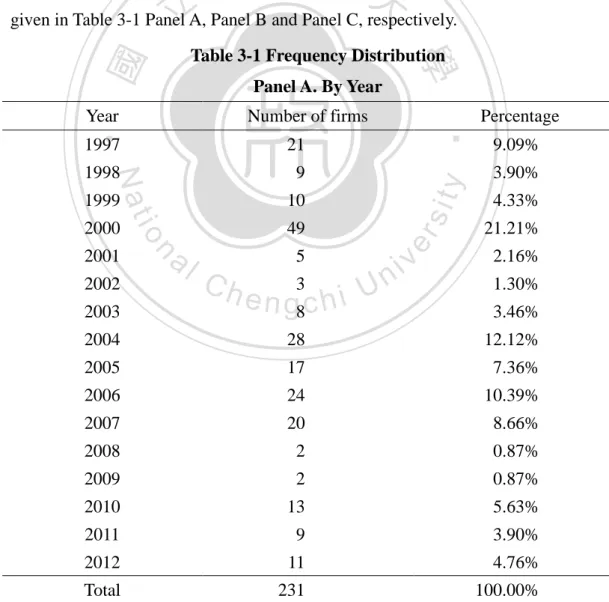
(33) 3.2 Data Collection This study focuses on biotech companies in the U.S IPO market and the influence of risk factors in the prospectus and strategic alliances on underpricing. The sample data consists of 231 biotech companies of U.S IPOs issued from 1997 to 2012, from Securities Data Company U.S New Issues Database (SDC). The choice of the biotech industry is driven by the fact that this industry has several interesting characteristics which make it a good candidate for a single industry study of IPOs. The biotech industry is highly competitive and faces significant. 政 治 大. technological change. And it is also characterized simultaneously by prospects for. 立. high profits, as well as significant downside risks due to regulatory and legal. ‧ 國. 學. uncertainties. This provides opportunities for many start-ups and, consequently, a relatively large number of IPOs (Galant 1992).. ‧. The sources of variables in this study including offer price, original filing. Nat. sit. y. amount, original middle of filing price range, venture capital backed and information. n. al. er. io. about strategic alliances are from SDC. The closing price on the first day and returns. i n U. v. of equal-weighted portfolio are from CRSP in Wharton: University of Pennsylvania. Ch. engchi. WRDS: Wharton Research Data Services. And the founding date, risk factors listed in the IPO prospectus are obtained from S-1 filings in Securities and Exchange Commission’s (SEC’s) website. In order to find out the effect of risk factors and strategic alliances, the data about those companies which have a strategic alliance before IPO date and its prospectus are collected. Then the methods to collect data are described as follows: First, the information about transactions of strategic alliances from 1990 to 2012 is collected from SDC. Through comparing the IPO date with alliance date if the. 25.
(34) sample company has a strategic alliance, those companies which have a strategic alliance before IPO date can be found out. Second, S-1 filings of sample companies are obtained from Securities and Exchange Commission’s website. There are 210 S-1 filings altogether. Therefore, the summated items and disclosure score of risk factors in each company can be collected from these 210 companies. Lastly, because of some missing values, only 200 sample companies are remained. To show the outcome of 231 firms in this study, three panels consolidated in. 政 治 大. Table 3-1 regarding frequency distributions by year, by industry and by alliance are. 立. given in Table 3-1 Panel A, Panel B and Panel C, respectively.. ‧ 國. Panel A. By Year Number of firms. 1999. 10. 2000. 49. 2003. al. n. 2002. io. 2001. Ch. y. 9. sit. 1998. er. 21. Nat. 1997. ‧. Year. 學. Table 3-1 Frequency Distribution. 5 3 e n g8c h i U. v ni. Percentage 9.09% 3.90% 4.33% 21.21% 2.16% 1.30% 3.46%. 2004. 28. 12.12%. 2005. 17. 7.36%. 2006. 24. 10.39%. 2007. 20. 8.66%. 2008. 2. 0.87%. 2009. 2. 0.87%. 2010. 13. 5.63%. 2011. 9. 3.90%. 2012. 11. 4.76%. Total. 231. 100.00%. 26.
(35) Table 3-1 Panel A shows that the number of firms is concentrated in 2000(49 firms), 2004(28 firms) and 2006(24 firms). And the proportion of firms in these three years is 43.72%. In Table 3-1 Panel B, the largest industry is biotech industry in Pharmaceutical Preparations (54.98%). Table 3-1 Frequency Distribution Panel B. By Industry 4-digit SIC. Definition. Number of firms. Percentage. 2834. Pharmaceutical Preparations. 127. 54.98%. 2835. In Vitro and In Vivo Diagnostic Substances. 7. 3.03%. 2836. Biological Products, Except Diagnostic Substances. 66. 28.57%. ‧ 國. Commercial Physical and Biological Research. 231. 100.00%. sit. Table 3-1 Frequency Distribution. n. al. Panel C. By Alliance. Ch. i n U. Number of firms. e n173 gchi. er. io 0. 13.42%. y. Nat Alliance. 31. ‧. Total. 學. 8731. 立. 政 治 大. v. Percentage 74.89%. 1. 58. 25.11%. Total. 231. 100.00%. Alliance labeled 0 means the companies have no strategic alliance or have strategic alliances after IPO date. And alliance labeled 1 means that the companies have strategic alliances before IPO date.. Table 3-1 Panel C shows that most companies have no strategic alliance or have strategic alliances after IPO date (74.89%).. 27.
(36) 3.3 Research Method 3.3.1 Approaches to Measure Risk Factors For the purpose of analyzing the influence of risk factors on IPO underpricing, this study adopts two approaches to measure 210 biotech firms from 1997 to 2012 to provide for a source of subsequent empirical analysis. This section is mainly to explain the content of the approaches. Referring to prior research on risk factors being a proxy for ex ante uncertainty, the first approach is to count the number of risk factors listed in the. 政 治 大. prospectus. Consistent with Beatty and Zajac (1994) considering a firm’s risk. 立. position is operationalized as the number of risk factors reported in the. ‧ 國. 學. prospectus, the assumption is that while all risk factors are not equally impactful, more risk factors generally indicate a higher risk position. On the basis of. ‧. previous research (e.g. Welboume and Andrews 1996; Cyr et al. 2000; Certo et al.. Nat. sit. y. 2001), the presence of the following twenty different types of risk factors. n. al. er. io. commonly listed in the prospectus are included in this measure and are coded (i.e. 0 = No, 1 = Yes):. Ch. engchi. i n U. v. (1) Technological obsolescence/ rapid technological change (2) New product (3) Few or limited products (4) Low number of years in operation (5) Inexperienced management (6) Technical risk (7) Seasonality (8) Customer dependence (9) Supplier dependence 28.
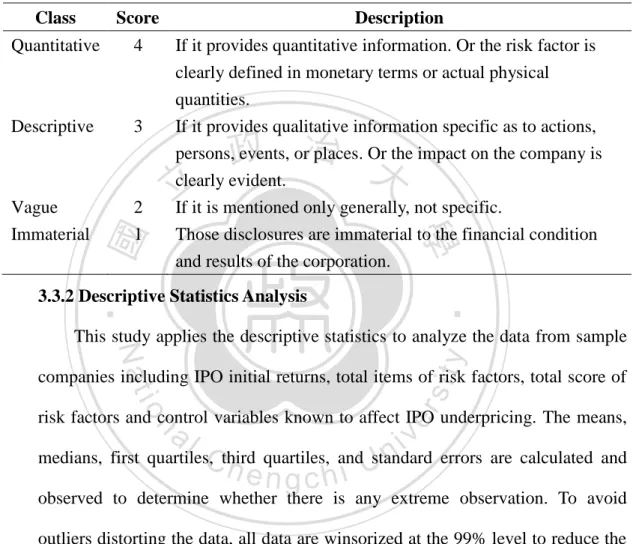
(37) (10) Inexperienced underwriters (11) Intense competition (12) Legal proceedings against company (13) Liability (14) Government regulation (15) Manufacturing capacity limitations (16) Need for additional capital (17) Uncertainty regarding patents or proprietary rights. 政 治 大. (18) Termination of contract. 立. (19) Dependence on key employees. ‧ 國. 學. (20) Competitive labor markets. In addition to capturing the quantity of disclosure, this study creates and. ‧. tests a coding scheme similar to other studies (e.g. Hughesa et al. 2001; Cerbioni. Nat. sit. y. and Parbonetti 2007; Hali 2002). Coding is the process by which raw data are. n. al. er. io. transformed systematically and aggregated into units, which permit precise. i n U. v. description of relevant content characteristics (Holsti 1969). Two researchers who. Ch. engchi. shared the same approaches conduct the coding scheme and code for the content analysis. In order to consider the content or description of the disclosure, the result of the coding scheme is referred to as a disclosure score. The disclosure score per sample company is the summation of per risk factors coded. This study uses a four-class index which attempts to assess the disclosure related to per risk factor presented among 20 items. Table 3-2 shows the four-class index used in this study.. 29.
(38) The results of the content analysis about risk factors from 210 biotech companies contain total items presented in the prospectus, total score summed by per risk factor coded and total words calculated to completely present the content of risk factors. The outcome is listed in the Appendix 2. Table 3-2 Four-class index Class. Score. Quantitative. 4. Vague Immaterial. 2 1. clearly defined in monetary terms or actual physical quantities. If it provides qualitative information specific as to actions, persons, events, or places. Or the impact on the company is clearly evident. If it is mentioned only generally, not specific. Those disclosures are immaterial to the financial condition and results of the corporation.. 立. ‧ 國. 3. If it provides quantitative information. Or the risk factor is. 政 治 大. 學. Descriptive. Description. ‧. 3.3.2 Descriptive Statistics Analysis. sit. y. Nat. This study applies the descriptive statistics to analyze the data from sample. io. er. companies including IPO initial returns, total items of risk factors, total score of risk factors and control variables known to affect IPO underpricing. The means,. al. n. v i n medians, first quartiles, and standard errors are calculated and Cthird h e quartiles, ngchi U observed to determine whether there is any extreme observation. To avoid outliers distorting the data, all data are winsorized at the 99% level to reduce the impact of outliers on the empirical results. 3.3.3 Regression Analysis This study utilizes multiple regression models to test hypotheses and to analyze the effect of risk factors and strategic alliances on IPO underpricing. In order to test the linear relationships between variables, this study uses Pearson Correlation and Spearman Correlation to make sure whether there are collinear problems between independent variables. 30.
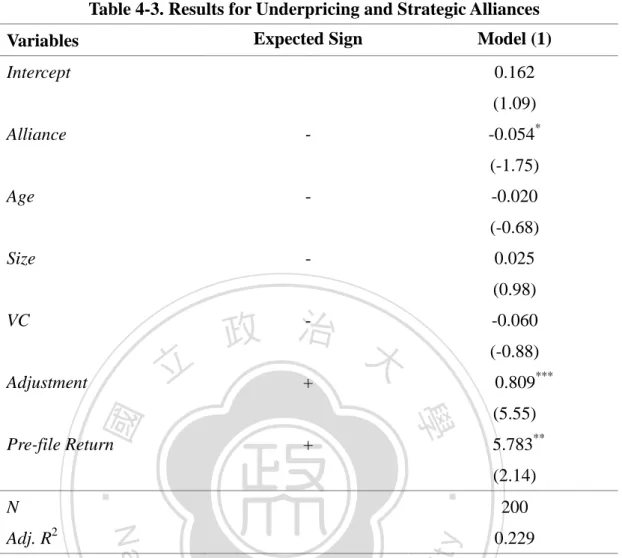
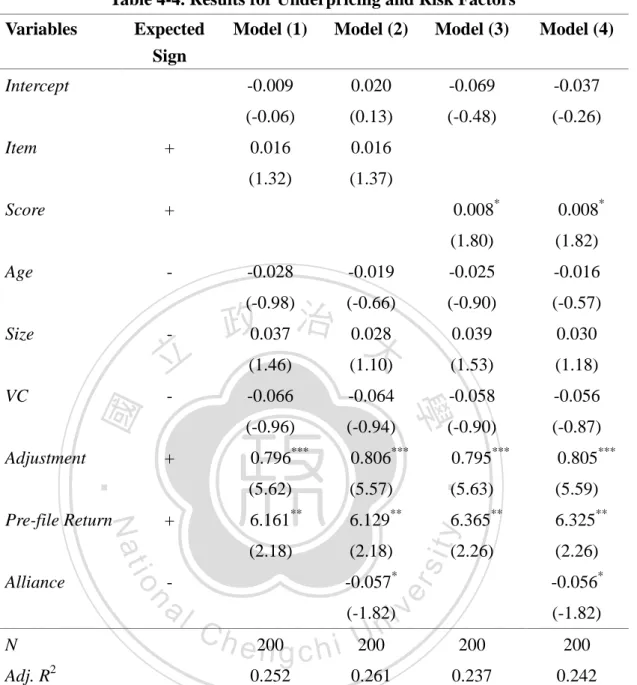
(39) 3.4 Research Model Equation (1) is to test hypothesis 1 which investigates the association between underpricing and strategic alliances before IPO date. In order to analyze the relation between underpricing and risk factors, total items presented in the prospectus and total score summed by the index per item are considered an independent variable in Equation (2) and Equation (3), respectively. Furthermore, taking the influence of strategic alliances into account to observe the overall effect on the underpricing, Equation (4) and Equation (5) are constructed. 政 治 大. by adding Alliance to Equation (2) and Equation (3).. 立. All equations are estimated by using ordinary least squares (OLS) model after. ‧ 國. 學. controlled for the industry-year clustered standard error. The Equations are listed below:. ‧. 𝐼𝑅 = 𝛽0 + 𝛽1 𝐴𝑙𝑙𝑖𝑎𝑛𝑐𝑒 + 𝛽2 𝐴𝑔𝑒 + 𝛽3 𝑆𝑖𝑧𝑒 + 𝛽4 𝑉𝐶 + 𝛽5 𝐴𝑑𝑗𝑢𝑠𝑡𝑚𝑒𝑛𝑡. Nat. (1). sit. y. +𝛽6 𝑃𝑟𝑒 − 𝑓𝑖𝑙𝑒 𝑅𝑒𝑡𝑢𝑟𝑛 + 𝜀. n. al. +𝛽6 𝑃𝑟𝑒 − 𝑓𝑖𝑙𝑒 𝑅𝑒𝑡𝑢𝑟𝑛 + 𝜀. Ch. engchi. er. io. 𝐼𝑅 = 𝛽0 + 𝛽1 𝐼𝑡𝑒𝑚 + 𝛽2 𝐴𝑔𝑒 + 𝛽3 𝑆𝑖𝑧𝑒 + 𝛽4 𝑉𝐶 + 𝛽5 𝐴𝑑𝑗𝑢𝑠𝑡𝑚𝑒𝑛𝑡. i n U. v. (2). 𝐼𝑅 = 𝛽0 + 𝛽1 𝑆𝑐𝑜𝑟𝑒 + 𝛽2 𝐴𝑔𝑒 + 𝛽3 𝑆𝑖𝑧𝑒 + 𝛽4 𝑉𝐶 + 𝛽5 𝐴𝑑𝑗𝑢𝑠𝑡𝑚𝑒𝑛𝑡 +𝛽6 𝑃𝑟𝑒 − 𝑓𝑖𝑙𝑒 𝑅𝑒𝑡𝑢𝑟𝑛 + 𝜀. (3). 𝐼𝑅 = 𝛽0 + 𝛽1 𝐼𝑡𝑒𝑚 + 𝛽2 𝐴𝑔𝑒 + 𝛽3 𝑆𝑖𝑧𝑒 + 𝛽4 𝑉𝐶 + 𝛽5 𝐴𝑑𝑗𝑢𝑠𝑡𝑚𝑒𝑛𝑡 +𝛽6 𝑃𝑟𝑒 − 𝑓𝑖𝑙𝑒 𝑅𝑒𝑡𝑢𝑟𝑛 + 𝛽7 𝐴𝑙𝑙𝑖𝑎𝑛𝑐𝑒 + 𝜀. (4). 𝐼𝑅 = 𝛽0 + 𝛽1 𝑆𝑐𝑜𝑟𝑒 + 𝛽2 𝐴𝑔𝑒 + 𝛽3 𝑆𝑖𝑧𝑒 + 𝛽4 𝑉𝐶 + 𝛽5 𝐴𝑑𝑗𝑢𝑠𝑡𝑚𝑒𝑛𝑡 +𝛽6 𝑃𝑟𝑒 − 𝑓𝑖𝑙𝑒 𝑅𝑒𝑡𝑢𝑟𝑛 + 𝛽7 𝐴𝑙𝑙𝑖𝑎𝑛𝑐𝑒 + 𝜀. (5). Where: IR = the initial return from IPO offer price to closing price on the first day obtained from CRSP. 31.
(40) Alliance = a dummy variable equals to 1 if the firm has a strategic alliance before IPO date and 0 otherwise. Item = total items presented among the selected twenty different types of risk factors commonly listed in the prospectus. Score = total score, the sum of the index per item presented among the selected twenty different types of risk factors commonly listed in the prospectus. Age = the natural logarithm of years between IPO year and the firm’s. 政 治 大. founding year which is obtained from IPO prospectus.. 立. Size = the size of a firm, the natural logarithm of the original filing amount.. ‧ 國. 學. VC = a dummy variable equals to 1 if the firm is venture capital (VC) backed and 0 otherwise.. ‧. Adjustment = the percentage change between the middle of the original file. Nat. sit. y. price range and the offer price.. n. al. er. io. Pre-file Return = the return to the CRSP equal-weighted portfolio of NYSE-,. i n U. v. AMEX-, and NASDAQ-listed stocks for the thirty trading days preceding the filing date.. Ch. engchi. 3.4.1 Dependent Variable The dependent variable of this study is IR which is the initial return. According to much prior literature, underpricing is measured by the difference between the offer price to the closing price of the first day, assuming the closing price has fully reflected the available information. The calculation is as follows:. 𝐼𝑅 =. 𝑃𝑚𝑘𝑡 −𝑃𝑖𝑝𝑜 𝑃𝑖𝑝𝑜. Where: 𝑃𝑚𝑘𝑡 = the closing price of the first day 32.
(41) 𝑃𝑖𝑝𝑜 = the offer price 3.4.2 Independent Variables The independent variable in Equation (1) is Alliance, a dummy variable equals to 1 if the firm has a strategic alliance before IPO date and 0 otherwise. In the light of previous research, strategic alliances provide valuable market signal for investors to decrease the level of ex ante uncertainty. Thus this study expects that there is a negative association between Alliance and underpricing. The independent variable in the remaining Equations is risk factors. 政 治 大. measured by Item and Score. Risk factor is a proxy for ex ante uncertainty.. 立. Referring to prior studies, more risk factors generally indicate a higher risk. ‧ 國. 學. position and much ex ante uncertainty. As foregoing inference, this study expects that risk factors have a positive relation with underpricing.. ‧. 3.4.3 Control Variables. Nat. sit. y. First, Age is included in the regression equations as a control variable. In. n. al. er. io. general, more public information is available about the value of older firms,. i n U. v. which can reduce information asymmetries. And Similar to Muscarella and. Ch. engchi. Vetsuypens (1989) finding that older firms have a lower degree of information asymmetry than do younger firms, this study expects a negative relationship between firm age and initial return. Second, this study uses original filing amount to control for offering size and predicts that it is negative with underpricing (Megginson and Weiss 1991; Hanley and Hoberg 2010). Offering size can send signals to the market about the relative quality and stability of an offering (Ibbotson and Ritter 1995). And larger IPOs often made by more established firms where there is less information asymmetry are likely to be less risky than smaller companies (Beatty and Ritter 33.
(42) 1986; Carter, Dark, and Singh 1998). This variable is logged to reduce the effect of extreme values. Third, VC backed firms are expected to lower initial returns. Megginson and Weiss (1991) support the role of venture capitalists in lowering initial returns. They indicate that the venture capitalists lower initial returns in IPOs. Venture capitalists can certify that the offering price of the issue reflects all available and relevant inside information. They will partially substitute for the certification provided by prestigious auditors and underwriters. Some previous research has. 政 治 大. suggested that the certification and monitoring role of venture capitalists. 立. diminishes underpricing (Barry et al. 1990; Megginson and Weiss 1991). In a. ‧ 國. 學. recent IPO study, Ljungqvist and Wilhelm (2003) indicate that the greater the investment bank’s equity holding, the lower are first-day underpricing returns. Li. ‧. and Masulis (2006) also find that venture capital banking is associated with lower. Nat. sit. y. IPO underpricing.. n. al. er. io. Fourth, Adjustment is defined as the difference between the final offer price. i n U. v. and the midpoint of the initial offer price range, divided by the midpoint of the. Ch. engchi. initial offer price range. This variable controls for the “partial adjustment” effect, in which the IPO underpricing is positively associated with prior revisions in offer prices (Ibbotson, Sindelar and Ritter 1988; Hanley 1993). Benveniste and Spindt (1989) hypothesize that firms with greater uncertainty about the true value of the shares are more likely to have revision in their offer price. In addition, they indicate that with share rationing, the offer price will only partially adjust to good information, and underwriters will use underpricing, along with increased share allocation, to compensate investors for revealing their information. Therefore, underpricing is positively related to prior revision in offer prices. 34.
(43) Last, prior research has shown that hot markets are associated with higher underpricing than cold markets (Ritter 1984). Logue (1973) first examines whether past market returns can predict future underpricing and finds a positive relationship between pre-IPO market returns and IPO first-day returns. Many studies indicate that if the market can immediately reflect the true price of the stock, the investment in IPOs during the hot issue would be more beneficial. On the other hand, in the hot market investors’ willingness to participate in the stock market will increase and anticipate more premiums which results higher. 政 治 大. underpricing. Referring to Loughran and Ritter (2002) and Hanley and. 立. Hoberg(2010), this measure is the return to the CRSP equal-weighted portfolio of. ‧ 國. 學. NYSE-, AMEX-, and NASDAQ-listed stocks for the thirty trading days preceding the filing date.. ‧. In a word, this study assumes that Age, Size, and VC have the negative. Nat. sit. y. relationship with IR. Conversely, Adjustment and Pre-file Return are expected to. n. al. er. io. be positive with IR.. Ch. engchi. 35. i n U. v.
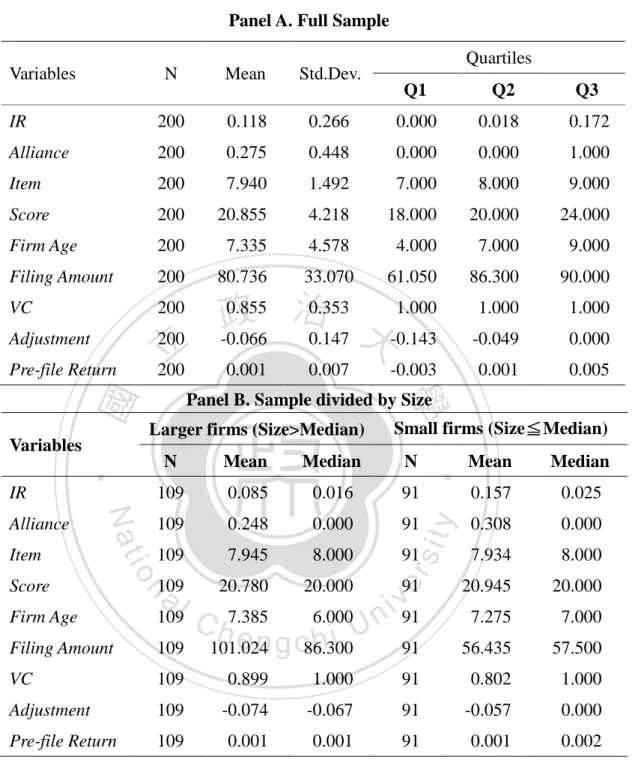
(44) 4. RESEARCH RESULTS AND ANALYSIS In this chapter, the descriptive statistics of the variables are presented in section 4.1. All data are winsorized at the 99% level to reduce the impact of outliers on the empirical results. And then move to section 4.2 to discuss the empirical results to verify the hypotheses and understand the effect of dependent variables on the underpricing.. 4.1 Descriptive Statistics Table 4-1 Panel A provides descriptive statistics regarding all variables for full. 政 治 大. sample of 200 biotech IPOs during 1997-2012. On average, this sample has an. 立. average initial return of 11.8% with a lower median of 1.8%. And the first quartile. ‧ 國. 學. shows 0% representing that at least 75% of IPO initial returns are larger than zero,. ‧. indicating there is an underpricing phenomenon. In this sample, about 27.5% of the firms have strategic alliances before IPO date. Besides, the mean of total items. y. Nat. io. sit. among selected twenty risk factors is close to 8 items similar to the median. And the. n. al. er. mean of total score is approximately 21. The average change in the offer price from. Ch. i n U. v. the midpoint of the initial offer price range to the final offer price is -6.6%. The mean. engchi. of filing amount an IPO offers is approximately $81 million. The mean of firm age is about seven years. And close to 86% of the IPOs have VC backed. Last, an average return in the thirty days prior to filing is 0.1%. According to the hypothesis 3.1 and hypothesis 3.2, these IPO firms are divided into subsamples by the median of firm size. Larger firms are the subsample greater than the median of original filing amount. Conversely, small firms are equal and less than the median of original filing amount. The result of descriptive statistics is given in Table 4-1 Panel B. Larger firms have lower mean of initial return than small firms, consistent with Beatty and Ritter (1986) and Carter et al. (1998).And the percentage 36.
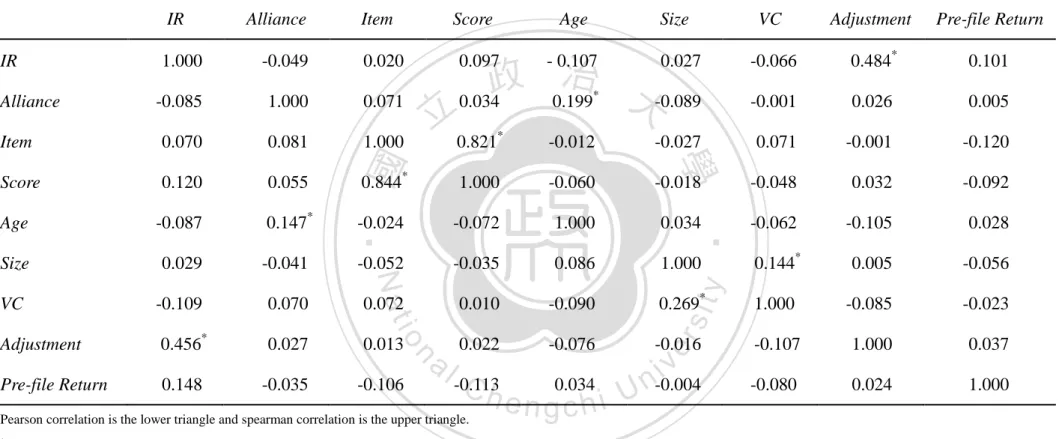
(45) of having strategic alliances before IPO date in larger firms is lower than small firms. In addition, about 90% of IPOs in larger firms have VC backed while 80% of IPOs in small firms have VC backed. However, comparing the mean of remaining variables between larger and small firms, there are no significant differences. The correlations of the variables are given in Table 4-2. This study uses two correlation analyses, pearson and spearman correlation, to understand the relation between the variables. As expected, Adjustment is positively associated with IR. And because Score is coded on the basis of Item, Score and Item have a positive. 政 治 大. association. Substantially, there is no strong correlation that may be problematic for. 立. the analyses.. ‧. ‧ 國. 學. n. er. io. sit. y. Nat. al. Ch. engchi. 37. i n U. v.
數據


+6
相關文件
substance) is matter that has distinct properties and a composition that does not vary from sample
- Informants: Principal, Vice-principals, curriculum leaders, English teachers, content subject teachers, students, parents.. - 12 cases could be categorised into 3 types, based
好了既然 Z[x] 中的 ideal 不一定是 principle ideal 那麼我們就不能學 Proposition 7.2.11 的方法得到 Z[x] 中的 irreducible element 就是 prime element 了..
Wang, Solving pseudomonotone variational inequalities and pseudocon- vex optimization problems using the projection neural network, IEEE Transactions on Neural Networks 17
volume suppressed mass: (TeV) 2 /M P ∼ 10 −4 eV → mm range can be experimentally tested for any number of extra dimensions - Light U(1) gauge bosons: no derivative couplings. =>
Define instead the imaginary.. potential, magnetic field, lattice…) Dirac-BdG Hamiltonian:. with small, and matrix
incapable to extract any quantities from QCD, nor to tackle the most interesting physics, namely, the spontaneously chiral symmetry breaking and the color confinement..
• Formation of massive primordial stars as origin of objects in the early universe. • Supernova explosions might be visible to the most
