Damping Characteristics of TiNi Shape Memory Alloys
H.C. LIN, S.K. WU, and M.T. YEH
The damping characteristics of TiNi SMAs have been systematically studied by using techniques of resonant-bar and low-frequency inverted torsion pendulum. Experimental results show that both the martensite phase (M) and R phase (R) have high damping due to the movement of twin boundaries. Because the B2 parent phase (B2) has smaller damping, it is suggested that this may come from the dynamic ordering process of lattice defects. In the transformation re- gions of B2 ~-~ M, B2 ~ R, and R ~ M, there are maxima of the damping capacity which are attributed to two contributions. One arises from the plastic strain and twin-interface move-
amax v s
ment during the thermal transformation, which obeys a linear variation of peak heights -1 i/" at i/" -> 1 ~ The other originates from the stress-induced transformation formed by the applied external stress which dominates at T < 1 ~ The elastic modulus E of martensite and the R phase is lower than that of the B2 phase, and a modulus minimum appears in the transformation region.
I. I N T R O D U C T I O N
TiNi
alloys are known as the most important shape memory alloys (SMAs) because o f their many applica- tions based on the shape memory effect (SME) and pseudoelasticity (PE). This comes from the fact that TiNi alloys have superior properties in ductility, strength, fa- tigue, corrosion resistance, recoverable strain, etc. It is also well known that TiNi alloys can exhibit high me- chanical damping. I~-41 However, our understanding in this area is incomplete. No systematic investigation has been reported on the damping characteristics of TiNi SMAs.Damping mechanisms, in general, involve the stress- induced movement of defects. For high-damping metals, the major mechanisms are the stress-induced movement of dislocations or planar defects, tS1 Most of these mech- anisms can be phenomenologically split into three classes: dynamic hysteresis, static hysteresis, and transformation mechanisms. Dynamic hysteresis is produced by the stress- aided ordering of defects overcoming local barriers by thermal activation and yields damping that is frequency dependent and amplitude independent. Static hysteresis appears due to the stress-induced "unpinning" or "break- away ~ process of the defects I5,6,7] and yields damping that is frequency independent and amplitude dependent. Some metals exhibit a high level of damping in the region of a transformation, for example, in the temperature range of a thermoelastic martensitic transformation, tS'm Such thermoelastic damping is frequently amplitude indepen- dent and proportional to
ITI/T,
where ITI is the heating or cooling rate and f is the frequency of vibration.In this study, by using both resonant-bar and low- frequency inverted torsion pendulum techniques, the damping capacity of TiNi alloys was investigated in the high-temperature cubic B2 parent phase (B2), the low- temperature monoclinic B I9' martensite phase (M), and
H.C. LIN, Associate Professor, is with the Department of Materials Science, Feng-Chia University, Taichung, Taiwan 400, Republic of China. S.K. WU, Professor, is with the Institute of Materials Science and Engineering, National Taiwan University, Taipei, Taiwan 106, Republic of China. M.T. YEH is with the Materials R&D Center, Chung-Shan Institute of Science and Technology, Lung-Tan, Taiwan 325, Republic of China.
Manuscript submitted February 15, 1993.
the intermediate rhombohedral R phase (R). The domi- nant damping mechanisms occurring in these phases and the characteristics associated with the thermoelastic transformations of TiNi SMAs are also discussed.
II. EXPERIMENTAL PROCEDURES
A. Materials
The conventional tungsten arc-melting technique was employed to prepare Tia9.sNis0.2 and Ti49Nisl alloys. Ti- tanium (purity, 99.7 pct) and nickel (purity, 99.98 pct), totaling about 150 g, were melted and remelted at least six times in argon atmosphere. Pure titanium buttons were also melted and used as a getter. The mass loss during melting was negligibly small. The as-melted buttons were homogenized at 1050 ~ for 72 hours and quenched in water, then hot-rolled to plates with 2-mm thick- ness. Specimens for the resonant-bar damping test (size: 200 x 15 z 2 mm) were carefully cut from these plates with a low-speed diamond saw. The rest of these plates were then hot-rolled to 1-mm thickness and sub- sequently cut to be the specimens for the electrical re- sistivity measurement (size: 50 x 1 x 1 mm) and internal friction test (size: 110 x 4 x 1 mm). The cut specimens were sealed in evacuated quartz tubes, annealed at 800 ~ for 2 hours, and quenched in water. Some Tia9Nis~ spec- imens were then aged in a 400 ~ salt bath for 5 or 20 hours and quenched in water. The martensitic and premartensitic transformation temperatures were tested by using four-probe electrical resistivity and internal friction measurements.
B. Damping Experiments
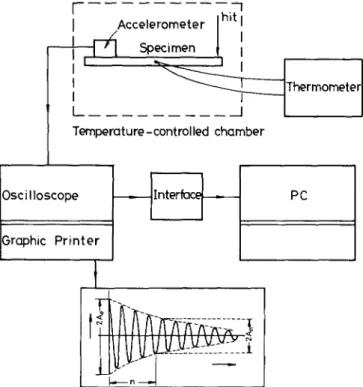
There are a variety of experimental methods available to measure the damping properties of a material. Each technique has its own unique advantages, but they all yield equivalent measures of damping, lSl In this study, two techniques, the flexural resonant-bar damping sys- tem and the internal friction, were used to measure the damping properties of TiNi alloys. The resonant-bar damping system is illustrated in Figure 1. The simple
[ l
ihit
I
Accelerometer
,
i---~[i .---I~'l.
Specimen 1 Ii
I '
.~....__
i I I II
I
~ T h e r m o m e t e r
I
t I I I
Temperat ure -cont roiled chamber
I
osc
illoscope
~ ~
Graphic Printer
I
PC
Fig. 1 - - S c h e m a t i c diagram of the resonant-bar damping system used in this study.
free-free cantilever beam can be excited into its funda- mental mode of flexural vibration I~~ by an exciting steel ball. After the exciting steel ball hits the specimen, the amplitude of vibration gradually decreases with time as the vibrational energy is dissipated. These decayed am- plitudes and frequency of vibration are transfered to an oscilloscope by an accelerometer attached on specimen's end. Measurement of successive strain amplitudes from the oscilloscope will then yield the logarithmic decre- ment, 6 as follows:
6 = In (A,/A,+,) [11
Where A. and A,+I are the amplitudes of successive cycles in free decay. The relationship between 6, internal fric- tion factor Q - l , and damping ratio s r is given by tSI
6
Q-l - 2 ~ : - - [2]
'IT
The specimen's temperature can be measured in situ by
a thermometer and be controlled by a temperature- controlled chamber, as shown in Figure 1. Internal fric- tion tests were carried out using a SINKU-RIKO 1500-M/L series inverted torsion pendulum in the tem- perature range from - 1 5 0 ~ to + 100 ~ The measur- ing frequency was about 1 Hz, and the temperature changing rate Ii#[ was set to be 1, 2, and 3 ~ Figure 2 shows typical experimental results of both the resonant-bar damping test and the internal friction mea- surement for Ti49.sNis0.2 alloy. In Figure 2, one can find that the variation of the damping property measured by these two techniques behaves with a similar tendency. Namely, the higher the internal friction, the faster the amplitude decay (or the higher the 6 value).
O 5" o I AJAAA
,. ...
IlrVWV' ....
!v
\
\'\i
80-6,
W 'I
4 8 \\,
[ J . . v'V o II 1.IAA IAAI AAA LAA, , , . . . .] ~'1 IlrlV vv,, . . .
ii L'
9 IYI IVW vvv m-,/
\ 3 2 o 16- o 0 o~ -15~ -100 -50 0 50 " 180TEMPERATURE (*C)
Fig. 2--Typical experimental plots of both the resonant-bar damping test and internal friction measurement for the Tiag.sNiso.2 alloy.
III. EXPERIMENTAL RESULTS
A. Experimental Results of the Resonant-Bar Damping Test
In order to understand the damping property of TiNi SMAs, including the B2 and R phases and B19' mar- tensite, the resonant-bar damping tests were carried out at various temperatures, where TiNi alloys exhibit dif- ferent phases during cooling. All the experimental re- sults, involving testing temperatures, existing phases, the damping ratio ~, and resonant frequency f are summarized in Tables I and II for Ti498Nis0.2 alloy and 400 ~ • 20 h aged Ti49Nis~ alloy, respectively. In order to further show the relationship between the damp- ing property and existing phases, damping ratio g: and electrical resistivity are plotted vs temperature in
Figures 3 and 4 for the solution-treated Ti49.8Nis0.2 and 400 ~ • 20 h aged Ti49Nisx alloy, respectively. In Figure 3, the damping ratio ~ of martensite is larger than that of the B2 phase and there is a sharp peak of ~: in the temperature range of the B2 --> M transformation. In Figure 4, the damping ratio ~: of martensite has nearly the same magnitude as that of the R phase but is larger than that of the B2 phase. The peaks of the damping ratio ~ appear in the temperature ranges of the B2 --> R and R ~ M transformations. The characteristics of the damping shown in Figures 3 and 4 will be discussed in Section IV.
B. Experimental Results of lnternal Friction Measurement
Figures 5(a) and (b) show plots of the internal friction
Q-~ vs temperature for the solution-treated Ti49.8Nis0.2 and
400 ~ • 5 h aged Ti49Nis~ alloys, respectively. In Figure 5(a), it appears that transformation peaks, Pc] and Pro, and relaxation peaks, PcR and PHR, on the cooling and heating cycles. Peaks PcJ and Pm are associated with
Table I. The Existing Phases, Damping Ratio ~, and Resonant
Frequency f in Different Damping Testing Temperatures for the Ti49.sNis0.z Alloy
Temperature (~ 60 Phases B2 Damping ratio ~ 0.009 f (Hz) 167 45 34 30 25 20 10 0 - 9 B2 B2 + M B2 + M B2 + M B2 + M M M M 0.010 0.013 0.030 0.051 0.036 0.021 0.020 0.021 166 158 153 150 151 155 155 156
Table II. The Existing Phases, Damping Ratio ~, and Resonant Frequency f in Different Damping Testing Temperatures for the 400 ~ • 20 h Aged Ti49Nisl Alloy
Temperature (~ 75 60 45 39 37 30 15 - 5 - 1 5 - 2 1 - 3 0 - 4 5 Phases B2 B2 B2 + R B2 + R B2 + R B2 + R R R + M R + M R + M M M Damping ratio ~ 0.009 0.010 0.014 0.025 0.045 0.034 0.028 0.037 0.053 0.040 0.026 0.026 f ( H z ) 155 155 138 130 119 125 136 137 135 141 146 147 El "-' 0 > LjJCr
J
~ Jo
/'1
Mortensite 0.00 -10 0 10 ~ , ~ 0.04 0 -- 0.03. c~ cr 0.02, 03 (-- ' ~ . 0.01 E r f B2 ph(~se 20 30 40 50 60 70 T e m p e r a t u r e (*C) 80 90Fig. 3 - - D a m p i n g ratio ~ and electrical resistivity v s temperature curves
for the Ti49.sNis0.z alloy.
c 7 ~ 0 > .4-, 0 0 5 0.04 0 :,7, 0.03 El r 0.02 - -cn c" "~_ 0.01 E C~ o 09 -60
J
/'\
._phose/,
Vl~ t e n s i t i / ~ . J " i - 3 0 0 30 60 90 T e m p e r a t u r e (*C)Fig. 4 - - D a m p i n g ratio ~ and electrical resistivity v s temperature curves
for the 400 ~ x 20 h aged TiaDNisi alloy.
the martensitic transformation, tl'31 while peaks PCR and P.~ are related to the relaxation of dislocation damp- ing. TM In Figure 5(b), the Pc1 and Pm peaks are also as-
sociated with the martensitic transformation while Pc2 and PH2 peaks are associated with the premartensitic R phase transformation. Comparing Figures 5(a) and (b) to Figures 3 and 4, one can find that the Q-~ value from the internal friction measurement as a function of tem- perature behaves similarly to the damping ratio ~: ob- tained from resonant-bar damping tests. Both the B19' martensite and R phase exhibit a same-order damping capacity which is larger than the B2 phase, and the damping capacity peaks appear in the temperature ranges of the martensitic and premartensitic transformation re- gions in TiNi SMAs.
The height of the transformational peaks, Pc~, pro, Pc2, and PH2, of Figure 5 can be affected by the heating or cooling r a t e / ' , as shown in Figure 6. Figures 6(a) and (b) present these peak heights as a function of 7 ~ without subtraction of the background for the TiaD.sNis0.2 and 400 ~ • 5 h aged Tin9Nisj alloys, respectively. A linear variation of these heights vs T is observed. When ex- trapolated to 7 ~ = 0, these heights do not approach zero
but some constant value higher than the background. This characteristic will be discussed in Section IV.
IV. D I S C U S S I O N
A. The Damping Capacity and Damping Mechanism of B2, B19', and R Phases in TiNi Alloys
As mentioned in Section I, most damping mechanisms involve the stress-induced movement of defects, tSJ Point defects give rise to damping in the range of low to inter- mediate levels, line defects give rise to damping levels in the intermediate to high range, and planar defects give rise to damping levels in the high range. It is well known that there are abundant twin boundaries in the B 19' mar- tensite and R phase of TiNi alloys, tl~'lzj These twin boundaries can be easily moved by the external stress to accommodate the strain. This phenomenon is the well- known "accommodation/reorientation" process occur- ring in the martensite and R phase of the deformed TiNi alloys. We postulate that this accommodation/reorientation phenomenon is closely related to the high damping ca- pacity of TiNi alloys and propose the following damping
Q - i X 10 s GO
,8]
32 l & i - 1 5 0 r = 2 . 3 2 x I 0 - ~ + HEATING 0 COOLING P c l o o o o o o o P~.~ o o § ,,-%., o , ; + § o o + + - 5 0 ~ 5 0 1 0 0 T E M P E R A T U R E (*C) Q - x X I0 s ,' 40 32] "t 2 4 ' i 1 6 (a) r = 1.74 x 10 - b = 2 ~ o J~c i + HEATING o COOLING 0 o P.i 5= ++ o ~ + o o § + § 9 , o o ~+§ ~P + ~o 9 o ~ , , o § ~ o ~ o + o*, - - " i i l # i " i -~s* 4 0 -do o do ~;o TEMPERATURE ( ' C > (b)Fig. 5--1nternal friction v s temperature curves for (a) Tin98Niso.2
alloy and (b) 400 ~ x 5 h aged Ti49Nis~ alloy.
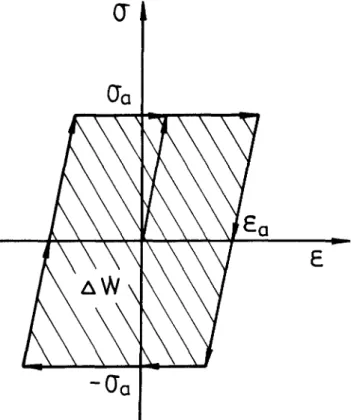
mechanism to account for this relationship. The stress- strain diagram for the accommodation/reorientation pro- cess during the damping test is schematically drawn in Figure 7. Also, Muller et al. had recently studied the
stress-strain curve of the pseudoelastic hysteresis on the CuZnAI single crystal, u31 However, in our proposed dia- gram of Figure 7, it is shown that after an elastic re- sponse to the stress, an accommodated strain e, in some microdomains can be produced at a critical value of the stress, O'a. This strain is due to the stress-induced move- ment of twin boundaries between the variants of mar- tensite or R phase. The accommodated strain is retained during the unloading but can be reoriented to the op- posite direction due to the movement of twin boundaries induced by the following opposite-direction stress, -o'a. This opens up a relatively large static hysteresis loop, AW, for the cyclic movement of twin boundaries. There- fore, the martensite and R phase of TiNi alloys have a high-damping capacity, comparable to or even higher than cast irons. [~uS} The high-damping properties due to the movement of twin boundary have also been observed in
(a) -1 Qmax ~ 0.07. ~ . a 0 06 ~, .0<05 0.04 0.03 0.02 Cooling 0.01 (b) ' -~3 - - '2 - - 'I 0 - I Q m a x 0.04 '%~ ~ '' 9 4;).0 c 2 " - Coo li ng 0.01-
-~
"2
"1
o
E = 2 . 3 2 x l O 4 f =0.90 Hz / & / Heating "r [*C/m in] I 4 2 3 E= 1 . 7 4 x 1 0 4 f =0.56 Hz _~o~" 4 / v Heating i" [*C/m i n] I I 1 2 :3 ---Fig. 6 - - T h e internal friction peak heights (Q~x) v s temperature
changing rate (T) for (a) Ti498Nis0.2 alloy and (b) 400 ~ x 5 h aged Ti49Nisl alloy.
the Mn-Cu-based alloys ll6] and some Cu-based shape memory alloys. 117,a
No twin boundaries exist in the parent B2 phase of TiNi alloys, and the dislocation density in the matrix is quite low. 1191 Hence, the damping capacity is suggested simply to come from the dynamic hysteresis of lattice defects, such as vacancy or interstitial. The stress-induced ordering process of these defects leads to an anelastic strain, and the damping mechanism is referred to as a linear reversible anelastic relaxation and opens up the dynamic hysteresis loop. Because the dynamic hysteresis loop generally dissipates a smaller quantity of energy, the damping capacity in the B2 phase of TiNi alloys is smaller, as shown in Figures 3 through 5.
B. The Damping Property Associated with
Thermoelastic Phase Transformations in TiNi Alloys
As discussed in Section I V - A , the martensite and R phase of TiNi alloys have a high damping capacity due to the movement of twin boundaries, but the parent B2 phase shows a low-damping capacity which is suggested simply to come from the dynamic ordering process of lattice defects. In Figures 3 through 5, there are peaks of damping capacity in the transformation regions of B2 (--) M, B2 (--) R, and R (--) M. The maximum value of the damping capacity occurring in the temperature ranges of transformation is two times or even higher that
0"
t
\ \ \ \
-(Ia
of
v
E
Fig. 7 - - S c h e m a t i c stress-strain diagram for the martensite/R phase accommodation/reorientation process. AW indicates the energy loss for the cycling movement of twin boundaries.
occurring in martensite or the R phase. This feature of high-damping capacity associated with the phase trans- formations of TiNi alloys needs to be further understood. Postnikov et al. 12~ had shown that all the first-order phase transformations should be accompanied with an internal friction peak, which is explained by the differ- ence in volume between the two phases. Delorme et al. t2jl extended the Postnikov's model by considering the plas- tic strain during transformation and deduced the internal friction factor Q-~ as a function of temperature rate,
dT/dt:
l d~b(Vm) dVm dT
Q l . . . [3]
w dVm dT dt
where Vm is the volume fraction of martensite, w is the angular frequency of applied stress, and ~O(Vm) is a monotonic function associated with the transformation volume change a n d / o r shape strain. Equation [3] indi- cates that the internal friction factor Q-~ is proportional to the heating and cooling rate, T. Dejonghe et al.,t221 in order to take account of the special character of the mar- tensite which can be induced or reoriented by an external stress o-, introduced the stress dependence to dVm/dt as the following:
dVm OVm OT OVm Otr
. . . + - - ' - - [4]
dt OT Ot Otr Ot
In Eq. [4], the first term is identical to the Delorme's model and the second term is the stress-dependent one.
In Figures 6(a) and (b), an approximately linear vari-
Qmax of PHI, P c I , PH2, and Pc2 vs
ation of peak heights -1
J" (i" = 1 , 2 , 3 ~ is observed. This result indicates that both martensitic and R-phase transformations agree with the Delorme's model at ]/" = 1 ~ to 3 ~ Besides, in Figures 6(a) and (b), as T is extrapolated to zero, the peak heights are higher than the background. At T = 0, no martensite or R phase is formed by a ther- mal driving force, but either can be formed by the ap- plied external stress. In TiNi alloys, the deformation behavior shows that the stress-induced transformation occurs before the reorientation of variants of martensite or R phase in the temperature range of forward trans- formations on cooling. I~9~ Hence, the damping capacity appearing at T = 0 on cooling, as shown in Figure 6, is ascribed to the stress-induced transformation. Tadaki
et al.la3] have reported that the volume change and shape strain associated with the martensitic transformation are much larger than those associated with the R-phase transformation. Based on this report, dqJ(Vm)/dVm for martensitic transformation is larger than that for R-phase transformation. Therefore, the internal friction of the R ~ M transformation should be much larger than that of the B2 ~ R transformation. Therefore, the Pcl peak (R ~ M) at ~/" = 0 is much higher than the Pc2 peak (B2 R) at the same strain amplitude. However, in the heating process, the existing martensite or R-phase vari- ants should be reoriented to accommodate the applied strain. As discussed in Section I l l - A , the damping ca- pacities due to the stress-induced movement of the twin boundary in the accommodation/reorientation process for martensite and R phase have nearly the same magnitude. Hence, the peak heights Qm~x of PH~ and PH2 at ~/" = 0 have nearly the same values, as shown in Figure 6(b).
Recently, Zhu et al. 1241 reported that the relationship between Q-~ and J ' / f for TiNi alloy is nonlinear, espe- cially for 7 ~ < 1 ~ contrary to the linear relation of Delorme's theory. This feature can be reasonably ex- plained as follows. As discussed earlier, the damping can arise from both thermal (cooling or heating) and me- chanical (external stress) driving forces. If T is higher, the damping capacity is dominated by the thermal driv- ing force, hence, Delorme's model is reasonable and the relation between Q-~ and ~/'/f is approximately linear, as shown in Figure 6 for T = 1 ~ to 3 ~ How- ever, when T is lower (e.g., < 1 ~ the damping capacity is dominated by the external stress and cannot be predicted by Delorme's theory.
C. The Elastic Modulus E in TiNi Alloys
In addition to the variation of the damping capacity with temperature in TiNi alloys, it can also be found that in Tables 1 and 2, the resonant frequencies f of mar- tensite and R phase are lower than that of the B2 phase. There are frequency minima in the temperature ranges for both martensitic and R-phase transformations. This phenomenon was also found in internal friction measure- ments, t2"3~ The resonant frequency is proportional to the square root of the elastic modulus E, f ~ X/E. Hence, the experimental results indicate that the B2 phase has a higher elastic modulus than the martensitic and R phases, and there are modulus minima in the temperature ranges
of transformations. This result is consistent with some reports in which the modulus is measured from stress- strain curves, t25J Comparing the resonant frequency in Table I with that in Table II, one can find that the res- onant frequency of Tiag.8Nis0.2 alloy is higher than that of 400 ~ • 20 h aged Tia9Nisi alloy. This indicates that the elastic modulus of the former alloy is higher than that of the latter alloy. The precipitates and/or matrix composition difference may be related to this feature.
V. C O N C L U S I O N S
The damping characteristics of TiNi SMAs have been systematically studied by using resonant-bar and low- frequency inverted torsion pendulum techniques. Both B19' martensite (M) and R phase (R) have a high-damping capacities due to the stress-induced movement of twin boundaries. On the other hand, the parent B2 phase has a smaller damping capacity which is suggested simply to come from the dynamic ordering process of lattice defects. In the transformation regions of B2 ~ M, B2 R, and R o M, there are damping capacity maxima which are two or more times higher than the damping capacity of martensite or R phase. Two contributions are proposed to account for the occurrence of the maxima of damping capacity. One arises from the plastic strain and twin-interface movement during the thermal-induced transformation, which obeys a linear variation of
peak heights amax -1 v s heating or cooling rate l/" at J" ->
1 ~ The other originates from the stress-induced
transformation caused by the applied external stress which
dominates at i/" < 1 ~ The experimental results
indicate that the elastic moduli E of martensite and the R phase are lower than that of the B2 phase in TiNi SMAs, and there are modulus minima existing in the transformation regions.
A C K N O W L E D G M E N T S
The authors are pleased to acknowledge the financial support of this research by the National Science Council (NSC), Republic of China, under Grant No NSC 82-0405- E002-080. The authors thank Mr. T.S. Chou, China Steel Corporation, for his excellent assistance in the internal friction measurement. Also, we would like to thank Dr.
Y.C. Lo, Institute of Materials Science and Engineering, National Taiwan University, Taipei, Taiwan, for helpful discussions during the research process.
R E F E R E N C E S
1. O. Mercier, K.N. Melton, and Y.De. Preville: Acta Metall., 1979, vol. 27, pp. 1467-75.
2. K. Iwasaki and R. Hasiguti: Trans. JIM, 1987, vol. 28, pp. 363-67. 3. S.K. Wu, H.C. Lin, and T.S. Chou: Acta Metall. Mater., 1990,
vol. 38, pp. 95-102.
4. C.M. Jackson, H.J. Wagner, and R.J. Wasilewski: NASA-SP 5110, 1972, pp. 35-41.
5. I.G. Ritchie and Z.-L. Pan: Metall. Trans. A, 1991, vol. 22A, pp. 607-16.
6. R. de Batist: I n t e r n a l Friction of Structural Defects in Crystalline Solids, North-Holland Publishing Co., Amsterdam, 1972.
7. D.W. James: Mater. Sci. Eng., 1969, vol. 4, pp. 1-8. 8. R. de Batist: J. Phys., 1983, pp. C9-39.
9. J. Van Humbeeck: Proc. ASM Materials Week and TMS/AIME
Fall Meeting, Role of Interfaces on Materials Damping, 1985,
pp. 5-24.
10. A.S. Nowick and B.S. Berry: Anelastic Relaxation in Crystalline
Solid, Academic Press, New York, NY, 1972.
11. T. Saburi and S. Nenno: Proc. Int. Conf. on Solid to Solid Phase
Trans., ASM, Metals Park, OH, 1982, pp. 1455-79.
12. S. Miyazaki and C.M. Wayman: Acta Metall., 1988, vol. 36, pp. 181-92.
13. I. Muller and H. Xu: Acta Metall. Mater., 1991, vol. 39, pp. 263-71.
14. M.T. Yeh, H.C. Lin, and S.K. Wu: National Taiwan University,
Taipei, Taiwan, unpublished research, 1993.
15. W.J. Buehler and R.C. Wiley: Report NOLTR 61-75, U.S. Naval
Ordinance Laboratory, Silver Spring, MD, Aug. 3, 1961.
16. A.F. Schwaneke and J.W. Jensen: J. Appl. Phys., 1962, vol. 33, pp. 1350-51.
17. K. Sugimoto, T. Mori, K. Otsuka, and K. Shimizu: Scripta Metall., 1974, vol. 8, pp. 1341-46.
18. M. Morin, G. Guenin, S. Etienne, and P.F. Gobin: Trans. JIM, 1981, vol. 22, pp. 1-5.
19. S. Miyazaki and K. Otsuka: Metall. Trans. A, 1986, vol. 17A, pp. 53-63.
20. V.S. Postnikov, S.A. Gidnev, B.M. Darinskii, and 1.M.
Sharashakov: N u o v o Cim. B, 1976, vol. 33, pp. 324.
21. J.F. Delorme, R. Schmid, M. Robin, and P. Gobin: J. Phys., 1971, vol. 32, pp. C2-101-09.
22. W. Dejonghe, R. De Batist, and L. Delaey: Scripta Metall., 1976, vol. 10, pp. 1125-28.
23. T. Tadaki, Y. Nakata, and K. Shimizu: Trans. JIM, 1987, vol. 28, pp. 883-90.
24. J.S. Zhu, R. Schaller, and W. Benoit: Phys. Status Solidi A, 1988, vol. 108, pp. 613-18.
25. K.N. Melton and O. Mercier: Acta Metall., 1980, vol. 29, pp. 393-98.