行政院國家科學委員會專題研究計畫 成果報告
超音波操控向列型液晶排列之研究(III)
研究成果報告(精簡版)
計 畫 類 別 : 個別型
計 畫 編 號 : NSC 98-2221-E-009-007-
執 行 期 間 : 98 年 08 月 01 日至 99 年 09 月 30 日
執 行 單 位 : 國立交通大學機械工程學系(所)
計 畫 主 持 人 : 尹慶中
報 告 附 件 : 出席國際會議研究心得報告及發表論文
處 理 方 式 : 本計畫可公開查詢
中 華 民 國 99 年 12 月 27 日
行政院國家科學委員會專題研究計畫成果報告
超音波操控向列型液晶排列之研究
(III)
Ultrasonic Alignment of Nematic Liquid Crystals (III)
計畫編號:NSC 98-2221-E-009-007
執行期限:98 年 8 月 1 日至 99 年 9 月 30 日
主持人:尹慶中 國立交通大學機械工程學系
計畫參與人員:許世明、溫子逵、吳昱瑾 國立交通大學機械系
摘 要 本研究將液晶盒玻璃表面之聚乙烯醇(PVA)配向層 模型簡化為具黏滯係數之等向性固體,推導具流體薄層 負載的平板導波波傳。以數值模擬聲導波的頻散與衰減 曲線,並分析各模態出現衰減驟減時的頻率、波數與相 速度關係、運動模態與平板表面質點軌跡。隨著頻率逐 漸增加,平板 A0模態之擾動逐漸集中於固液界面,具 有雷利表面聲波特徵;S0模態則集中於平板下表面。液 體層上下表面間的壓力梯度及均勻特性與平板表面質 點軌跡運動的偏振狀態有直接關係。PVA 配向層之厚度 與黏度因受熱而改變,控制超音波激發的頻率與波長, 在配向層內產生不同的壓力梯度,影響配向層分子的排 列。分子排列整齊之配向層經焗烤固化後,透過分子鍵 結吸附作用,會影響液晶分子的排列。 關鍵字:藍姆波、黏滯液體負載、頻散、衰減、配向層 ABSTRACTThe report presents an investigation on acoustic guided wave propagation in a glass substrate coated with the poly-vinyl-alcohol (PVA) layer. The PVA layer is modeled as a hypothetical isotropic solid with viscosity. Dispersion and attenuation curves, mode shape, surface trajectory of plate, and pressure difference in fluid layer are numerically simulated. With increasing frequency, the concentrations of displacement, stress, and energy flow occurs near the top surface of plate for A0 mode and the
bottom surface for S0 mode, respectively. The gradient of
pressure different and its uniform distribution are directly related with the shape and amplitude of surface trajectory of plate. However, the pressure difference with variations in thickness and viscosity of PVA layer plays an important role on realignment of PVA molecules. After curing process the well-ordered alignment layer will have significant influence on the molecular alignment of liquid crystals.
Keywords: Lamb waves, viscous fluid loading, dispersion, attenuation, alignment layer.
1. 前言 配向技術為目前平面顯示面板產業中相當重要的 製程之ㄧ,此技術可直接決定面板產品的品質好壞,目 前產業界使用之摩刷配向技術雖具有一定的品質與水 準,但仍有待改進的空間。超音波用於操控微小物質[1-5] 是一種新型的研究技術,過去有學者利用此技術控制氣 泡位置、微粒的排列或奈米碳管的方向,獲得到良好的 效果,但實際應用性較低,鮮少有人將此應用於實際製 程技術上。此外,超音波在配向層內所激發的聲場會使 液體產生不同型式的應變,並使其中的高分子微粒有不 同的運動方式,例如:聲輻射力(acoustic radiation force) 使液體中高分子發生凝聚或分散的現象、液體受超音波 激發而使內部出現聲流動(acoustic streaming)現象等 [6-8]。因此,瞭解配向層內液體的聲場分佈(例如密度、 速度、壓力差變化等)乃是一件重要的課題。 本研究以聚乙烯醇(poly-vinyl-alcohol, PVA)作為配 向材料,旋鍍於玻璃基材上,並在不同操作條件,激發 基材之聲波,造成配向層高分子產生重排效果,尋得最 佳操縱參數。分析模型將 PVA 配向層簡化為一個具動 態黏滯係數之類等向性固體,推導具液體薄層負載之平 板聲導波的波傳特徵方程式,數值計算並且分析其頻散 與衰減特性,及各模態的位移、應力、液體薄層壓力差 分佈與平板表面質點運動軌跡。 1916 年,Lamb [9]發現在上下表面為自由邊界之等 向性平板中存在一種沿平板傳遞的頻散波,稱之藍姆波 (Lamb waves),當頻率跟厚度之乘積趨近於無窮大時, 藍姆波之特徵方程式會蛻變為雷利表面聲波(Rayleigh surface acoustic waves)。在 1948 年,Scholte [10]發現沿 著固液界面上存在一種相速度略低於雷利波波速的波 傳模態,其固體中大部分的能量均侷限於界面附近,此 波傳模態稱為Scholte waves。 1992 年,Wu 與 Zhu [11]在忽略液體黏滯效應的條 件下,推導一單層平板上下兩側毗鄰有限厚度液體層的 藍姆波頻散方程式,並以數值模擬方式說明應用於生醫 感測器上的可行性。在1995 年,Zhu 與 Wu [12]則考慮 了液體黏滯特性並忽略熱傳導效應,推導單層平板浸沒 於無限域黏滯性液體中,及平板上下兩側毗鄰有限厚度 黏滯性液體的藍姆波頻散方程式,以數值方法分析比較
A0 與 S0 模態在不同黏滯係數下的相速度頻散及波數衰 減情形。
在1997 年,Nayfeh 與 Nagy [13]延續之前 Zhu 與 Wu [12]的理論,將結構中的黏滯性液體視為一具剛性 55 c i之假想的等向性固體(hypothetical isotropic solid),其中為黏滯係數,為角頻率,模擬液體於不 同黏滯係數時相速度的變化,發現將平板浸沒或覆著於 具黏滯性的液體中,皆會在特定頻率下使得平板藍姆波 最低階對稱模態 S0 出現衰減驟降現象,位於固液界面 上質點運動軌跡由原本的橢圓偏振轉變為垂直表面的 線偏振狀態。 2. 研究方法 考慮一具液體薄層負載之平板,如圖1 所示,其中 h 與 H 分別為液體薄層與平板的厚度,X 軸為厚度方3 向,X 與1 X 兩方向為無限延伸。假設聲導波沿著2 X 方1 向傳遞,上述模型可簡化為在X X 平面上的二維波傳1 3 問題。利用Stokes-Helmholtz 分解法可將各層的位移uI 及應力IJ以勢函數與表示( ,I J1,3),忽略徹體 力的作用,配合平面波展開法(plane wave expansion), 假設各物理量皆為ei k X( 1t)的週期函數,其中k 與分 別為沿X 方向傳遞的角波數與角頻率,推導縱波1 與 橫波 之獨立運動方程式及其解的型式。 應用層狀介質分析常用的矩陣法[14-15],整理獲得 各層的位移與應力組成的狀態向量為 1 1 1 3 1 1 1 3 1 3 1 1 3 1 1 1 3 1 3 ( , , ) ( , , ) ( ) ( , , ) ( ) ( , , ) X X X X X p X U k V k V k k P P Q Q D B D A Q Q (1a) 2 3 2 2 2 3 2 2 3 2 2 2 3 2 2 3 2 2 ( , , ) ( ) ( , , ) ( ) ( , , ) k X X k X X k X U V V P P D A Q Q D B Q Q (1b) 其中,下標「1」與「2」分別代表液體薄層與平板,上 標「」分別代表下傳(down-going)與上傳(up-going)的平 面波;而向量 U 代表位移u 與1 u ,向量 V 與 V 分別代3 表平面法線向量為X 方向的應力3 31與33以及X 方1 向的應力11與13, 為液體層壓力差分佈;向量p A1 與B 分別代表液體薄層中離開1 (departing)與抵達(arrival) 固液界面(X3 )的平面波振幅係數,向量0 A 與2 B 分2 別代表平板層中離開與抵達固液界面的平面波振幅係 數。上述(1a-b)式中,其餘向量或矩陣各元素之定義詳 列於附錄。 液體上表面(X3 )與固體下表面(h X3 H)邊界 之曳力為零,且液體與固體兩者間界面(X3 )須滿足0 位移與應力連續,可得 1 1 1 1 1 1 1 1 1 2 2 2 1 1 2 2 1 2 2 2 2 2 0 0 0 0 0 0 0 0 B Q E Q E A P P P P A Q Q Q Q B Q E Q E (2) 其中 S L 1 diag[ e e ] f f i h i h E 與 S L 2 diag[ ei H eiH] E 。根據 (2)式可得整體結構聲導波的特徵方程式 ( , ) k ,其中 2 f 與k2k,利用Matlab 軟體作數值分析,求 得具液體薄層負載之平板結構聲導波頻散與衰減曲 線。Lowe [14-15]曾針對層狀介質結構聲導波的特徵方 程式作求解,發展出一套有效的複數尋根方法,稱之為 曲線追蹤法(curve tracing)。本文中因平板表面負載之液 體具有黏滯係數,使聲導波在結構中傳遞時能量會發生 衰減,因此,波數k [1/mm]的虛部大小影響就變的非 常重要。原波數k k riki kr(1i 2 ),原本特徵 方程式( , )f k 則可表示為( ,f k kr, )i 或( ,f kr, ) 的 型式,其中ki與分別為每單位波傳距離[Np/mm]與每 單位波長[Np/wavelength]的波數衰減。 為了統一數值分析模型中沿X 方向傳遞之聲導波1 通過某一截面的總能量,因此,利用通過此方向之截面 所有的時間平均功率流(time-average power flow)作正則 化,代表每一個分析模型中通過截面的總能量是固定 的,作為模態分析比較時的一個參考依據。已知聲導波 通 過 某 一 個 法 向 量 為 ˆn 之 單 位 截 面 的 功 率 流 密 度J (power flow density)定義為 a Re( ) Re( )
J JI I
P v ,亦稱 為acoustic Poynting vector。經過一週期 T 的時間平均,
1 0 T a J T∫ P dt,時間平均功率流密度為 12Re( ) a J JI I P v , 即2Im(JIuI)或
2[Re( JI) Im( ) Im(uI JI) Re( )]uI
, 其中 e i t JI JI 與 e i t e i t I I I v v i u 。然後,將 時間平均之功率流密度 對通過截面作積分,即PJa ˆ a V Jn P dAJ ∫ ,可獲得通過某一截面之時間平均功率流 的總和 a flowout E 。 3. 數值結果與討論 如圖1 所示,平板為厚度 1 mm 的玻璃,其密度 為 2.76 g/cm3,Lamé 常數 與 分別為 33.6 與 26.4 GPa,縱波波速c 與橫波波速L c 分別為 5.6 與 3.1 S mm/μs;液體薄層為厚度 0.01 mm 的 PVA 水溶液,其密 度f為1.01 g/cm3,容積模數 f κ 為 2.25 GPa,動態黏滯 係數f設為1.0 Pa.s,縱波波速c 為 1.5 mm/μs。本研Lf 究在計算各模態聲導波時,固定波傳X 方向之單位截1 面積通過的能量,令法線方向為X 方向之截面的時間1 平均功率流總和Eaflowout為一個單位。 將上述各參數代入(2)式中的特徵方程式,並應用曲 線追蹤法經數值計算可獲得頻散與衰減曲線,如圖2 至 6 所示。具液體薄層負載之平板就結構上已不具有上下 對稱特性,獲得之頻散曲線亦不能稱之為對稱(S)或反對
稱(A)模態。由於 PVA 水溶液的厚度與平板比較相對小 很多,圖2 與 3 所示之頻散曲線與原始單一平板之結果 差異並不大,故改稱之為擬似(pseudo-)對稱或反對稱模 態。因此,在圖中綠色、粉紅色、藍色與紅色實線分別 代表A0、S0、A1與S1模態,而藍色、紅色、淡藍色與 淡粉紅色虛線分別代表A2、S2、A3與S3模態。在衰減 曲線的表示上,圖4 為波數虛部-頻率域的衰減曲線,為 了進一步瞭解衰減驟降的位置及其物理意義,將衰減取 對數後分別如圖5 與圖 6 所示。 圖 4 顯示在某些特定頻率下,出現衰減驟降的現 象,如圖5 中 a、b、c、d、e、f 與 g 點所示,分別代表 S0、A1、S1、A2、S2、A3與S3模態,對應到圖6 上,更
能發現它們會在某些特定波數下出現,約為0.5、1.0、 1.5、2.0、2.5、3.0 與 3.5 mm-1位置附近,即:對稱模態 Sn 在krH n 1 2 (n0,1, 2),反對稱模態 Am 在 rHm k (m1, 2,3)。對應至圖 3,波速約為 4.3 mm/μs 附近,略低於單一平板的 2cS
4.384 mm/μs。將衰減驟 減發生的頻率、波數與波速及平板在X3 的質點位移0 振幅比值| | max( )u3 u 整理於表 1。上述特性是因於在該1 頻率或波數時,平板的運動特性稱之為 Lamé 模態 [16-17],其特徵為邊長 1/2 波長構成之正方單元,於波 傳時其體積脹縮變化為零或最小,即為類似等體積變 化,聲導波在傳遞過程中能量轉換與耗散最小;且隨著 模態階次愈高,因液體負載的影響,衰減驟減發生之波 數與波速位置,與單一平板作比較皆有逐漸往後偏移的 現象,同時,衰減驟減現象變得愈不明顯,代表著此一 運動特性亦變得不明顯。另外,如表1 所示,由振幅比 值| | max( )u3 u 的大小可發現在固液界面上平板表面質1 點運動軌跡轉變為垂直表面的線偏振狀態。隨著 Lamé 模態之階次愈高或逐漸偏離Lamé 模態,線偏振狀態則 越是趨緩,還原至橢圓偏振狀態。 除去上述a 至 g 點,在圖 4 與圖 5 中仍可發現尚有 衰減驟降的現象,如o、p 與 q 三點所示,分別為 S2、 A3與S3模態。將這些特定頻率對應至圖2 或圖 3 時, 可發現o、p 與 q 三點分別為 A2與S2之交點以及A3與 S3之第1 個與第 2 個交點,其頻率與波數可參考表 1 所 列。以o 點為例,發現 A2模態在固液界面之平板表面 位移u 趨近為零,幾乎是藉由位移3 u 作平行界面的切向1 運動與液體耦合,因液體的黏滯阻尼特性,發生較大的 能量損耗;相反地,S2模態的平板表面位移u 則趨近為1 零,大部分藉由位移u 作垂直界面的正向運動直接與液3 體耦合,故其能量損耗相對較小。參考圖7 所示,在 o 點頻率5.233 MHz 附近位置,A2與S2兩模態的位移振 幅比值| | max( )u3 u 分別處於極小與極大的相反結果,代1 表質點運動軌跡呈現了平行表面與垂直表面兩種截然 不同方向的線偏振運動。同理,上述現象在p 與 q 兩點 所發生的情況亦屬相同道理。 由圖3 發現 A0與S0模態的相速度頻散曲線在頻率 較高時是略微分開的,不會匯集至雷利表面聲波波速。 者仍維持著板波反對稱與對稱模態,由圖7 可知在固液 界面之平板質點運動軌跡分別為逆時針與順時針。然而 在頻率10 MHz 時,平板 A0模態之位移與應力變化集中 於固液界面,質點軌跡為逆時針,具有雷利表面聲波的 特徵,隨著頻率增加其波速會趨於2.859 mm/μs,略低 於雷利波波速2.865 mm/μs。相反地,S0模態之位移與 應力變化卻是集中於平板下表面,質點軌跡為順時針, 並根據圖5 所示,約在大於 6 MHz 後衰減逐漸遞減,能 量則逐漸聚集於平板下表面,此現象推測為流體薄層負 載造成平板結構不對稱,使得S0板波之能量聚集於平板 下表面,與流體薄層達成對稱性。上述A0與S0模態在 頻率愈高時,位移與應力變化分別聚集於平板上下表面 的現象,亦可由圖8 與 10 中綠色與粉紅色實線的交替 現象觀察出來。 進一步將平板上下表面質點軌跡的位移振幅比 3 1 | | max( )u u 及位移u 最大振幅對頻率之分佈分別輸出1 如圖7 至 10 所示,符號「」代表在位置X3 與 H 處0 的質點軌跡,分別為順時針與逆時針旋轉。可藉由振幅 比| | max( )u3 u 的大小判斷橢圓軌跡偏振狀態,愈大代表1 形狀愈狹長,愈小代表愈寬扁,前者顯示平板主要是經 由垂直界面的正向位移u ,直接使液體層發生體積變化3 而將能量導入,後者是經由切向位移u 與液體層的黏滯1 特性耦合,衰減也會相對較大。由位移u 最大振幅可知1 橢圓軌跡的形狀大小,代表聲導波在傳遞時,平板表面 的能量分佈大小。顯而易見地,由圖7 至 10 發現頻率 愈靠近Lamé 模態及不同模態之交點時,質點位移u 最1 大振幅會發生驟減,垂直表面的線偏振運動現象愈是明 顯。此外,亦可發現每一模態之頻率大約在小於 Lamé 模態後,上下表面的質點軌跡皆會呈現相反的旋轉方 向,上表面由逆時針轉變為順時針,下表面則是由順時 針轉變為逆時針。將各模態的質點軌跡發生相反旋轉時 的頻率、波數及相速度之範圍整理於表2,並獲得一個 規 律 結 果 , 即 : 對 稱 模 態 Sn 在 krH n 1 2 (n0,1, 2),反對稱模態 Am在krHm (m1, 2,3), 以及兩者的波速在c 2cS的範圍。 將圖7 與 9 及圖 8 與 10 分別作比對,可發現大部 分趨勢是雷同的,除了 A0與 S0兩模態。由圖8 與 10 中觀察A0與S0模態的振幅變化,當頻率在低於4 MHz 範圍時振幅會隨頻率遞減而變大的趨勢,中間除了 S0 模態的振幅會在Lamé 模態附近而發生驟減情形,並配 合圖7 與 9,在愈往低頻時 A0模態的橢圓軌跡形狀愈狹 長,S0模態則是愈寬扁。當頻率大於5 MHz 範圍,隨著 頻率愈高,平板上下表面的橢圓軌跡形狀愈接近圓形, 但在上表面A0模態振幅會趨於 0.01,S0模態會逐漸遞 減。在平板下表面時,A0與 S0模態的情況則會完全相 反。 根據附錄之3 f 所示,液體層中壓力差 會與液體p 的縱波有直接關係。由於液體層厚度較薄,在上下表面 間壓力差分佈會較接近線性,由上下表面壓力差大小可置X3 與 h0 處的壓力差 p 最大振幅對數圖,明顯發 現各模態壓力差的大小會隨著頻率增加而逐漸遞增至 一定值,這是因平板聲導波波長變短,愈能夠將能量導 入而使壓力差產生變化。隨著頻率增加,下層壓力差大 小約為上層的100 倍,這是因液體層厚度 0.01 mm 的差 異所致。 由圖 11 中發現壓力差大小會在某些特定頻率出現 驟減現象,這些位置與圖7 中位移振幅比| | max( )u3 u 最1 小值出現位置接近,主要是因藉由平板上表面切向位移 1 u 與液體耦合,使壓力差產生變化幅度遠不及其他方式 有效,並且再將這些位置對應至圖12,兩邊值的大小幾 乎差不多,代表藉此一方式激發的壓力差變化雖小,但 因液體黏滯效應影響,其上下表面間的壓力差變化卻是 比較均勻的。反觀之,由圖 12 中壓力差最小處對應至 圖11,發現在液體兩表面間的壓力差變化落差較大,對 應至圖7,則與移振幅比| | max( )u3 u 最大值位置接近。1 這顯示藉由正向位移u 方式與液體耦合,會使液體層配3 合平板上表面的起伏一起運動,易造成在靠近固液界面 附近的體積變化較大,大部分能量亦侷限在此界面附 近,促使兩表面間的壓力差變化差異較大且分佈較不均 勻。根據上述現象,液體層上下表面間壓力差變化差異 與平板上表面質點軌跡運動的偏振狀態有直接關係。同 樣地,在這兩張圖上皆可發現當頻率大於5 MHz 範圍, 平板之S0模態造成壓力差變化的影響會逐漸減小,這是 因平板S0模態的能量已經逐漸集中於平板下表面。 4. 結論 本研究應用Lowe 的曲線追蹤法,獲得具黏滯液體 負載下平板聲導波之擬似對稱與反對稱的頻散與衰減 曲線,並分析了各模態出現衰減驟減時的頻率、波數與 相速度關係、運動模態特性與平板上下表面質點軌跡。 各模態出現衰減驟減現象會發生在Lamé 模態或頻散曲 線交點的位置附近,在固液界面上,平板表面質點軌跡 會呈現垂直表面的線偏振狀態。表面質點軌跡會在頻率 約小於Lamé 模態時發生逆轉現象,在上表面為順時針 運動,下表面為逆時針運動。此外,隨著頻率遞增,平 板 A0模態之位移與應力變化逐漸集中於固液界面,具 有雷利表面聲波的特徵;S0模態則是集中於平板下表 面。最後,液體層上下表面間的壓力差梯度及均勻特性 會與平板上表面質點軌跡運動的偏振狀態有直接關係。 本研究主要著重於具黏滯液體負載下平板之聲導 波模態運動特性分析,未來可考慮改變液體層厚度與黏 滯係數的大小,比較聲導波頻散與衰減曲線、各模態的 位移、應力與流體層壓力差分佈。 參考文獻
[1] H. M. Hertz, “Standing-wave acoustic trap for nonintrusive positioning of microparticles,” J. Appl. Phys., 78(8), 4845-4849 (1995).
[2] A. Haake and J. Dual, “Particle positioning by a two- or three-dimensional ultrasound field excited by surface waves,” Proceedings of the WCU 2003 Conference Paris, 237-240 (2003).
[3] C. J. Strobl, C. Schaeflein, and U. Beierlein, “Carbon nanotube alignment by surface acoustic waves,” Appl. Phys.
Letts., 85(8), 1427-1429 (2004).
[4] J. R. Friend, L. Y. Yeo, D. R. Arifin, and A. Mechler, “Evaporative self-assembly assisted synthesis of polymeric nanoparticles by surface acoustic wave atomization,”
Nanotechnology, 19, 145301 (2008).
[5] C. D. Wood, J. E. Cunningham, R. O’Rorke, C. Waelti, E. H. Linfield, A. G. Davies, and S. D. Evans, “Formation and manipulation of two-dimensional arrays of micron-scale particles in microfluidic systems by surface acoustic waves,”
Appl. Phys. Letts., 94(5), 54101 (2009).
[6] M. K. Tan, J. R. Friend, and L. Y. Yeo, “Surface acoustic wave driven microchannel flow,” Proceedings of 16th
Australasian Fluid Mechanics Conference, 790-793 (2007).
[7] M. K. Tan, J. R. Friend, and L. Y. Yeo, “Directly visualization of surface acoustic waves along substrates using smoke particles,” Appl. Phys. Lett., 91(22), 224101 (2007).
[8] R. P. Hodgson, M. K. Tan, L. Y. Yeo, and J. R. Friend, “Transmitting high power RF acoustic radiation via fluid couplants into superstrates for microfludics,” Appl. Phys.
Lett., 94(2), 024102 (2009).
[9] H. Lamb, “On waves in an elastic plate,” Proc. R. Soc.
Lond., A93, 144-128 (1917).
[10] J. G. Scholte, “On the large displacements commonly regarded as caused by Love waves and similar dispersive surface waves,” Proc. Konink. Ned. Akad. Wetensch., 51, 533-543 (1948).
[11] J. Wu and Z. Zhu, “The propagation of Lamb waves in a plate bordered with layers of a liquid,” J. Acoust. Soc. Am., 91(2), 861-867 (1992).
[12] Z. Zhu and J. Wu, “The propagation of Lamb waves in a plate bordered with a viscous liquid,” J. Acoust. Soc. Am., 98(2), 1057-1064 (1995).
[13] A. H. Nayfeh and P. B. Nagy, “Excess attenuation of leaky Lamb waves due to viscous fluid loading,” J. Acoust. Soc.
Am., 101(5), 2649-2658 (1997).
[14] M. J. S. Lowe, Plate Waves for the NDT of Diffusion Bonded
Titanium, Ph.D. Dissertation, University of London (1993).
[15] M. J. S. Lowe, “Matrix techniques for modeling ultrasonic waves in multilayered mesia,” IEEE Trans. Ultrason.
Ferroelectr. Freq. Control, 42, 525-542 (1995).
[16] K. F. Graff, Wave Motion in Elastic Solids, Oxford University Press, pp. 463 (1975).
[17] D. Royer and E. Dieulesaint, Elastic Waves in Solids I: Free
and Guided Propagation, Springer-Verlag, Berlin
Heidelberg, pp. 320 (2000). 附錄 (1a-b)式中各元素定義如下: 2{u u1 3} U T, 1{u u1f 3f} U T, 2 { 31 33} V T, 1{31f 33f} V T, 2 { 11 13} V T, 1{11f 13f} V T, 2 { S L} T A A A , 1{ Sf Lf}T A A A , 2 { S L} T B B B , 1{ Sf Lf}T B B B , 11 13 2 31 33 p p p p P , 11 13 1 31 33 f f f f p p p p P ,
11 13 2 31 33 q q q q Q , 1 11 13 31 33 f f f f q q q q Q , 11 13 2 31 33 q q q q Q , 1 11 13 31 33 f f f f q q q q Q , S 3 L 3 2 e 0 0 e i X i X D , S 3 L 3 1 e 0 0 e f f i X i X D , 1 3 [ ] f f f , p11 iS, 11f Sf p i , 33 L p , i 33f Lf p , i 13 31 p p i k, 13f 31f p p i k, q31 2c k55 S, 31f 2 55f Sf q c k , 2 2 33 (11 L 2 55 ) q c k c k , 2 2 33f (11 Lf f 2 55f ) q c k c k , 2 2 11 31 55( S ) q q c k , 2 2 11f 31f 55f( Sf ) q q c k , 11 2 55 S q c k , 11 2 55 S f f f q c k , 2 2 13 ( 11 L 2 55 L) q c k c , 2 2 13f (11 Lf f 2 55f Lf) q c k c , 13 33 2 55 L q q c k , 13f 33f 2 55f Lf q q c k , 1f 0 , 2 3f κ kf Lf , 2 2 2 2 S S ( S) k k c , 2 2 2 2 Sf Sf ( Sf) k k c , 2 2 2 2 L L ( L) k k c , 2 2 2 2 Lf Lf ( Lf) k k c , c11 2, 4 11 3 f f f c κ i , c13 , 2 13 3 f f f c κ i , c55 , 55 f f c i , 2 L 11 c c , 2 Lf 11f f c c , 2 S 11 c c , 2 Sf 55f f c c . 表1 不同模態之聲導波傳遞發生衰減驟減時的頻率、波數、相速度,及其在X3 的質點 0 位移振幅比值| | max( )u3 u 。 1
Lamé modes (points a to g) Special modes (points o, p, q) Mode type A0 A1 A2 A3 A2 [A3] A3 Frequency (MHz) - 4.370 8.805 13.389 5.230 6.401 9.067 Wavenumber (mm-1) - 1.002 2.034 3.134 0.792 0.562 1.544 Velocity (mm/μs) - 4.361 4.329 4.272 6.604 11.389 5.872 |u3|/max(u1) at X3= 0 - 66.421 55.707 96.893 0.0061 63.483 0.0140 Mode type S0 S1 S2 S3 [S2] S3 [S3] Frequency (MHz) 2.183 6.575 11.071 15.752 5.233 6.413 9.072 Wavenumber (mm-1) 0.500 1.512 2.572 3.716 0.792 0.562 1.544 Velocity (mm/μs) 4.366 4.348 4.304 4.239 6.608 11.412 5.876 |u3|/max(u1) at X3= 0 263.654 55.909 64.027 131.850 54.494 0.0046 22.759 表2 平板質點軌跡運動於X3 、 H 發生順、逆時針偏轉時的頻率、波數及相速度之範圍。 0 Clockwise (cw) trajectory of the particle at X3 = 0
Mode type S0 A1 S1 A2 S2 A3 S3
Frequency (MHz) 2.183 4.388 6.610 8.858 11.128 13.438 15.797 Wavenumber (mm-1) 0.500 1.010 1.528 2.058 2.598 3.156 3.736
Velocity (mm/μs) 4.366 4.344 4.326 4.304 4.283 4.258 4.228 Counterclockwise (ccw) trajectory of the particle at X3 = H
Mode type S0 A1 S1 A2 S2 A3 S3
Frequency (MHz) 2.179 4.357 6.535 8.713 10.891 13.064 15.241 Wavenumber (mm-1) 0.498 0.996 1.494 1.992 2.490 2.986 3.484
3
X
1X
H
h
O
0 2 4 6 8 10 12 14 16 Frequency (MHz) 0 1 2 3 4 5 Wav en umbe r (1 /m m ) o p q 圖1 具液體負載之平板結構幾何示意圖。 圖2 波數實部-頻率域的頻散曲線。 0 2 4 6 8 10 12 14 16 Frequency (MHz) 0 2 4 6 8 P ha se ve lo city ( m m / s) o q a b c d e f g 0 2 4 6 8 10 12 14 16 Frequency (MHz) 0 0.001 0.002 0.003 0.004 0.005 A tt enu at ion ( N p/ mm) 圖3 相速度-頻率域的頻散曲線。 圖4 波數虛部-頻率域的衰減曲線。 0 2 4 6 8 10 12 14 16 Frequency (MHz) 1E-007 1E-006 1E-005 0.0001 0.001 0.01 A tt enu at io n log 10 (N p/ m m ) a b c d e f g o p q 0 1 2 3 4 5 Wavenumber (1/mm) 1E-007 1E-006 1E-005 0.0001 0.001 0.01 A tt en ua ti on l og10 (N p/ mm) a b c d e f g o q p 圖5 波數虛部-頻率域的衰減對數曲線。 圖6 波數之虛部-實部域的衰減對數曲線。0 2 4 6 8 10 12 14 16 Frequency (MHz) 0.01 0.1 1 10 100 R at io o f | u3 |/m ax( u1 ) 0 2 4 6 8 10 12 14 16 Frequency (MHz) 1E-005 0.0001 0.001 0.01 0.1 1 Am pl it ud e o f m ax( u1 ) ( m m) 圖7 平板質點軌跡在X3 的位移振幅比值 0 3 1 | | max( )u u 對數圖,符號「」代表順時針。 圖8 平板質點軌跡在X3 的位移0 u 最大振幅 1 對數圖,符號「」代表順時針。 0 2 4 6 8 10 12 14 16 Frequency (MHz) 0.01 0.1 1 10 100 R at io o f | u3 |/m ax( u1 ) 0 2 4 6 8 10 12 14 16 Frequency (MHz) 1E-005 0.0001 0.001 0.01 0.1 1 Am pl it ud e o f m ax( u1 ) ( m m) 圖9 平板質點軌跡在X3 H的位移振幅比值 3 1 | | max( )u u 對數圖,符號「」代表逆時針。 圖10 平板質點軌跡在X3H的位移u 最大振幅 1 對數圖,符號「」代表逆時針。 0 2 4 6 8 10 12 14 16 Frequency (MHz) 1E-005 0.0001 0.001 0.01 0.1 1 A m pl it ude of m ax( p) (G Pa ) 0 2 4 6 8 10 12 14 16 Frequency (MHz) 1E-005 0.0001 0.001 0.01 0.1 1 A m pl it ude of m ax( p) (G Pa ) 圖11 液體層在X3 的壓力差 p0 對數圖。 圖12 液體層在X3 的壓力差 ph 對數圖。
2009 亞太非破壞檢測學術研討會心得報告
主持人:尹慶中 國立交通大學機械工程學系
計畫編號:NSC 98-2221-E-009-007
執行期限:98 年 8 月 1 日至 99 年 9 月 30 日
參加人:溫子逵 國立交通大學機械工程學系博士生
一、會議綱要:
2009 年亞太非破壞檢測學術研討會(2009 Asia-pacific Conference on Non-Destructive
Testing)日本非破壞檢測協會 (The Japanese Society for Non-Destructive Inspection)所主辦。
APCNDT 創立迄今已有 33 年多的歷史,是國際間這個領域的重要學會,每年 11 月左右舉
辦的非破壞檢測學術研討會是非破壞領域的一大盛事。本年度會議在日本橫濱國際會議中
之四樓會議中心舉行,會議期間自 2009 年 11 月 08 日至 13 日,共計六天。
會議論文主要分十大領域:
1.
非破壞檢測的基礎與應用研究(Fundamental and applied research)
2.
非破壞檢測設備設計與發展(Equipment design and development)
3.
非破壞檢測與測試應用(Inspection and testing application)
4.
非破壞檢測規範與準則(Codes and standards)
5.
非破壞檢測教育訓練及資格證書(Training, education, qualification and certification)
6.
換能器及其材料(Materials characterization)
7.
安全性及可靠度(Safety and reliability)
8.
安全診斷(Security)
9.
生物醫療應用(Bio-medical applications)
10. 其他(Others)
各領域下又區分為 5 至 9 個主題進行討論。該四樓會議場地寬闊,大會同時使用四樓層的
8 間會議室進行口頭報告與討論,每間會議室可容納約 100 人,每篇論文的發表及討論時
間共 25 分鐘,遇缺席者則空下該時段,方便與會者進出各個研討會場,選擇聆聽有興趣
的論文。另外在該樓的走道大廳上都闢有展覽場地,供論文以海報方式張貼發表,相較於
論文海報區,儀器商的展覽場卻較為冷清。
學生本人此次參加會議的論文是以口頭報告方式進行發表,論文歸類於一般應用,發
表於 11 月 13 日早上 9:50 至 10:15 的 GS9-2 場次,場次主持人為日本 Tohoku University 的
Prof. Shien Ri 。本篇論文名稱為
Ching-Chung Yin and Tzu-Kuei Wen, “Application of ESPI to detect detection in solar cell
substrates,” The 13th Asia-Pacific Conferences on Non-Destructive Testing, Yokohama,
Japan., 8-13 November, 2009.
本篇論文主要探討太陽能矽基板在製造過程中,容易產生人眼不易察覺的微破壞,這
些破壞往往於矽基板銲線串接或組成模組壓合成品時,受熱及壓等外力影響,產生結構性
的破壞,導致整片太陽板電池皆無法使用。本研究將採用電子光斑干涉術作為主要研究方
法針對矽基板做全區域的非破壞性檢測。矽基板受熱之後會產生面外及面內的變形,倘若
矽基板存有微裂縫,將會在裂縫面上產生不連續的變形。實驗方法採用雷射光經過空間濾
波器、分光鏡後,照射於矽基板上產生散射光斑,利用 CCD 相機拍攝不同溫度下的光斑
照片,以傅立葉光學等影像技術處理後,獲得由光斑組成的條紋變化,其對應試片表面的
等變形曲線。
無暗裂的試片經由加熱之後所拍攝的光斑干涉條紋,經由影像處理,會出現規律性排
列的同心亮暗條紋,條紋的中心位於試片中央,條紋數代表矽基板面外或面內的位移量,
同一條紋上的任一點具有相同位移量。
二、與會心得:
2009 APCNDT 在每天會議開始前,都會先舉辦數場 Short Courses。今年亦不例外,課
程名稱分別如下:
1.
Current status and future strategy of national energy R&D program and overview of related
NDE research in Korea
2.
Harmonization of NDT practice: Experience of the third world country
3. Ultrasound
Contrast
Agents: Theory and Experiment
4.
Research and development in NDE and component health monitoring
5.
Safety assessment of nuclear power plant in the case of earthquake
學生個人認為這種課程對於新興的研究題目或是轉型研究者的幫助很大。在國內各項
學術會議的舉辦都是為發表論文而設計,倘若能邀請學有專精或各研究領域的先行者進行
深入的講解,相信可以吸引剛投入研究的學生或轉型研究者,有助於國內學術研究的未來
發展。
2009 APCNDT 有關生醫方面的超音波應用論文篇數依然非常多,可以看出生醫超音波
學已經成為這個領域的重要發展方向。另外,由上述 Short Courses 可看出,無論是在生醫
或是工程方面的理論及應用上,超音波成像(Imaging)亦是一個重要的發展方向。
APCNDT 下屆的舉辦地點還未公布。APCNDT 的論文接受率未公佈,但這次會議來
自台灣的論文有十幾篇,顯示國內相關領域研究蓬勃,水準很高。
三、攜回資料名稱及內容:
會議論文摘要集與會議手冊。
────────────────────────
Application of ESPI to Defect Detection in Solar Cell Substrates
Ching-Chung Yin*, Tzu-Kuei Wen
Department of Mechanical Engineering, National Chiao Tung University
Hsinchu, Taiwan, R.O.C.
Key Words: Electric speckle pattern interferometry, Solar cell, Micro-defect
1. Introduction
Micro-defects are frequently induced in crystalline silicon (c-Si) solar cell substrates during fabrication. Optical inspection for micro-cracks in brittle c-Si solar cell is extremely time-consuming because those cracks appear with very thin widths and the crack surfaces are mostly inclined to the middle planes of the substrates. They could cause catastrophic destruction in the solar cells during module manufacturing process or even in the period of service. This paper presents a full field nondestructive inspection for rapid defect detection in c-Si photovoltaic cells using electronic speckle pattern interferometry (ESPI).
2. Method
The ESPI measurement provides the whole-field displacement distribution for crack detection in the cells. The speckle patterns were recorded at a wavelength of 532 nm using a DPSS laser. The c-Si solar cells were uniformly heated in experiments. The thermally induced displacement discontinue across the crack surface. The discontinuity of interference fringes distinguishes the appearance of micro-defect.
In experiment, the laser beam passing through spatial filter and beam splitter was used to illuminate the specimen. Speckle patterns would be produced as the light was scattered by the rough surface of the object. Interference fringes enhanced by speckle patterns could be determined by subtraction of two pictures digitally captured by a CCD camera at distinct temperatures through the image processing technique based on Fourier optics. The interference fringes produced by the specimen without defects exhibit a number of ellipses with regular patterns of bright and dark fringes which are concentric with a point. Those points located on each fringe possess the same magnitude of displacement. If the specimen has defects, the interference fringes reveal discontinuous tangential slopes or locally concentric ellipses in the contiguous area around the defects or damages.
3. Results and Discussion
Fig.1 shows the out-of-plane ESPI image of a undamaged solar cell. A number of displacement fringes reveal that initial out-of-plane bending deformation appears in the cell because both tin-strips and c-Si substrate have different coefficients of thermal expansion. Every point in the same fringe has the same out-of-plane
displacements in this specimen. The cracks in solar cells were artificially made by pressing the central area or the edge with a small pyramid-shaped diamond indenter. Fig. 2 shows the interference fringes regarding out-of-plane deformation for a cell with an edge defect. The tangential slopes of displacement fringes are discontinuous across the edge crack which appears inside the dashed-line circle.
Fig.1 Out-of-plane ESPI image of a undamaged solar cell.
Fig.2 Out-of-plane ESPI image of a solar cell with an edge defect appearing inside the circle.
4. Conclusion
A promising full filed nondestructive inspection based on ESPI was developed. Experimental results and numerical prediction for micro-defects of different sizes have excellent agreement. The application of large temperature gradient to c-Si solar cell will induce defect propagating and should be prevented in ESPI inspection.
2009 國際實驗力學研討會心得報告
主持人:尹慶中 國立交通大學機械工程學系
計畫編號:NSC 98-2221-E-009-007
執行期限:98 年 8 月 1 日至 99 年 9 月 30 日
參加人:溫子逵 國立交通大學機械工程學系博士生
一、會議綱要:
2009 年國際實驗力學研討會(2009 International Conference on Experimental Mechanics)
(Nanyang Technological University)南洋理工及(National University of Singapore)新加坡大學
所共同主辦。ICEM創立迄今已有 4 年多的歷史,是國際間這個領域的重要學會,每年 11
月左右舉辦的國際實驗力學研討會是實驗力學領域的一大盛事。本年度會議在新加坡假日
飯店四樓會議中心舉行,會議期間自 2009 年 11 月 18 日至 20 日,共計 3 天。
會議論文主要分十大領域:
1.
實驗固體力學(Experimental Solid Mechanics )
2.
實驗流體力學(Experimental Fluid Mechanics)
3.
非破壞檢測與智能結構(Non-Destructive Testing and Smart Structures)
4.
微米及奈米力學(Micro and Nano-Mechanics)
5.
生物及生活科學(Biomechanics and Life Sciences)
6.
結構動力及振動(Structural Dynamics and Vibration)
7.
光學與雷射應用(Optics and Laser Applications)
8.
混種方法及影像處理(Hybrid Methods and Image Processing)
9.
生物醫療應用(Bio-medical applications)
10. 其他(Others)
各領域下又區分為 10 至 16 個主題進行討論。該四樓會議場地寬闊,大會同時使用四樓層
的 8 間會議室進行口頭報告與討論,每間會議室可容納約 50 人,每篇論文的發表及討論
時間共 20 分鐘,遇缺席者則空下該時段,方便與會者進出各個研討會場,選擇聆聽有興
趣的論文。另外在該樓的走道大廳上都闢有展覽場地,供論文以海報方式張貼發表,相較
於論文海報區,儀器商的展覽場卻較為冷清。
學生本人此次參加會議的論文是以海報方式進行發表,論文歸類於一般應用,發表於
11 月 20 日早上 10:30 至 10:50 的 FD-1-1 場次,場次主持人為台灣的 Cheng Kung University
的 Prof. Jianlin Zhao。本篇論文名稱為
Ching-Chung Yin and Ching-Chung Yin, “Crack detection in photovoltaic cells using electronic
speckle pattern interferometry,” The 4th International Conference on Experimental Mechanics,
本篇論文主要探討太陽能矽基板在製造過程中,易產生微破壞,這些破壞往往於矽基
板銲線串接或組成模組壓合成品時,受熱及壓等外力影響,產生結構性的破壞,導致整片
太陽板電池皆無法使用。本研究將採用電子光斑干涉術作為主要研究方法針對矽基板做全
區域的非破壞性檢測。無暗裂的試片經由加熱之後所拍攝的光斑干涉條紋,經由影像處
理,會出現規律性排列的同心亮暗條紋,條紋的中心位於試片中央,條紋數代表矽基板面
外或面內的位移量,同一條紋上的任一點具有相同位移量。矽基板中若有微暗裂發生或其
他破壞,經由加熱之後,面外及面內的變形情況會與無破壞的情況不同,產生的光斑干涉
條紋於暗裂處或破壞處呈現輪廓不連續狀或局部的同心橢圓。
針對不同加熱溫度、裂縫尺寸之位移模擬與實驗結果比較顯示,暗裂處所呈現的局部
同心橢圓條紋與位於中心的同心橢圓條紋所呈現不連續狀走向即為裂縫的走向,可經由局
部同心橢圓數判斷矽基板上裂縫的數目。
二、與會心得:
2009 ICEM 在每天會議開始前,都會先舉辦數場 Keynote Speech。今年亦不例外,論
文名稱分別如下:
1. Hybrid Multi-scale Experiments and High Performance Computing for Cross-scale
Engineering of Nano and Microstructures
2.
Mechanobiology of Endothelial Cell and the Cytoskeletons
3. Nano-scale
Measurement
Instruments
Based on New Principle in Lasers
學生個人認為這種論文對於新興的研究題目或是轉型研究者的幫助很大。在國內各項
學術會議的舉辦都是為發表論文而設計,倘若能邀請學有專精或各研究領域的先行者進行
深入的講解,相信可以吸引剛投入研究的學生或轉型研究者,有助於國內學術研究的未來
發展。
2009 ICEM 有關生醫及奈米方面的實驗力學應用論文篇數依然非常多,可以看出生醫
及奈米已經成為這個領域的重要發展方向。另外,由上述 Keynote Paper 可看出,無論是在
生醫或是工程方面的理論及應用上,實驗力學亦是一個重要的發展方向。
ICEM 明年的舉辦地點已經公布。2010 年在馬來西亞舉行,ICEM 的論文接受率未公
佈,但這次會議來自台灣的論文有十幾篇,顯示國內相關領域研究蓬勃,水準很高。
三、攜回資料名稱及內容:
會議論文摘要集與會議手冊。
Presented in 4th International Conference on Experimental Mechanics, November 18-20, 2009, Singapore. paper no. ICEMA00364-00727.
Crack detection in photovoltaic cells using electronic speckle pattern
interferometry
Tzu-Kuei Wen, Ching-Chung Yin
Department of Mechanical Engineering, National Chiao Tung University
Hsinchu, Taiwan, R.O.C.
ABSTRACT
This paper presents a full field nondestructive testing method to inspect the micro-defects embedded in photovoltaic (PV) cells by using electronic speckle pattern interferometry. The edge-clamped solar cells were heated to induce thermal deflection. Interference fringe enhanced by speckle patterns correlated to thermal deformation were determined by subtraction of two pictures recorded at different temperatures and image processing technique based on Fourier optics. The interference fringes produced at the defect free specimen exhibit a number of polygons with regular patterns of bright and dark fringes which are concentric with the center of the specimen. The thermal deformation will be redistributed due to appearance of the defects. The heating-induced interference fringes become quite different from those of the undamaged one. Tangential discontinuities of interference fringes or locally concentric polygon patterns occur in the contiguous area around the micro-defects or damages. The application of large temperature gradient to silicon substrates will induce crack propagation and should be prevented in ESPI inspection.
Keyword: silicon-based photovoltaic cell, electronic speckle pattern interferometry, micro-defect, thermal deformation
1. INTRODUCTION
Micro-defects are frequently generated in silicon-based solar cell substrates during fabrication. Optical inspection for very thin cracks is extremely time-consuming. These defects usually result in catastrophic damages when the brittle silicon substrates are manufactured in module process. They also cause the solar cells breaking down in service. Micro-defects detection is an important issue in quality control of silicon substrates or solar cells. Manufacturers can raise quality and avoid wasting cost if those damages could be detected in silicon/solar cells before being packaged. Recently, there are a number of experimental techniques and approaches used for defect detection in silicon substrates and solar cells for fast growing PV industry. These include photoacoustic methods [1-3], optical image process captured from the silicon/solar cells by CCD (charge-coupled device) camera [4], resonance ultrasonic vibration (RUV) method by applying ultrasonic vibrations of tunable frequency and adjustable amplitude to specimens [5-6], photoluminescence (PL), and electroluminescence (EL) methods [7-8]. Each method has individual advantages such as detection for the size, location of defects, etc. However, there is no inspection method which can examine for micro-defects in the whole cell not only rapidly but precisely for PV industry up to the present.
In this paper, we present a rapid inspection method using electronic speckle pattern interferometry (ESPI) to detect both the size and location of micro-defects in solar cells. ESPI is widely known and used for full field, non-destructive inspection and deformation measurements. Speckle patterns would be induced while the light was scattered by the rough surface of the object. ESPI is based on the slight changes in the scattered speckles determined by electronically subtracting the speckle patterns before deformation from those captured after deformation happened in the object [9]. ESPI has been applied to measure heating-induced deflection of the specimen [10-12]. The displacement discontinuity might occur on opposite sides of a crack under strains. The discontinuity results that speckle fringes have distinct tangential slopes across the crack interface. The speckle fringes regarding heating-induced deformation in the solar cells with defects will have different patterns rather than those free of damages. Evidence from the discontinuous tangential slopes of speckle fringes significantly raises the probability of micro-defect detection in solar cells. The variation of speckle fringes can be used to determine the size and location of micro-defects.
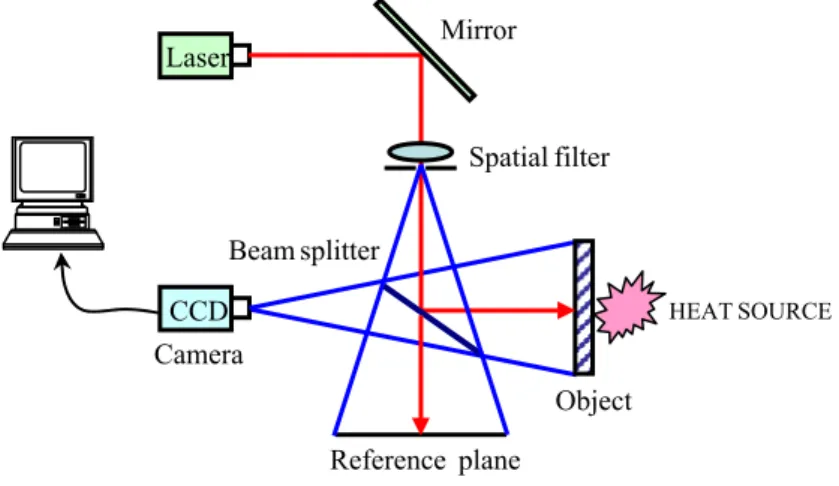
2. OUT-OF-PLANE ESPI
The schematic view of out-of-plane ESPI setup is shown in Figure 1. This optical measurement system is the same as Michelson interferometer. The laser beam passing through spatial filter and beam splitter was used to illuminate the specimen and the reference plane. The reflected beams from the specimen and reference plane come across the beam splitter again and captured by CCD camera. The signal from CCD camera was then recorded by a personal computer.
Figure 1. Out-of-plane displacement measurement by ESPI The intensity distribution at any point of the undeformed object can be expressed as
r
r o r
I1uo2u22 uu coso (1)
where uo,ur,o, are the randomly varying amplitude and phase at a point on the object and reference plane. If a r
deformation is produced at the object by mechanical load or thermal stress, the intensity distribution of light reflected from the deformed object is given by
r r r
I2 u2o u2 2uou cos o (2)
where is the phase change introduced due to the deformation of object. These two intensity distributions are recorded
in CCD camera and digitized in computer that converted to amplitude transmittance upon processing.
2 sin 2 sin 4 cos cos 2 o o o o o 1 2 r r r r r total I I I u u u u (3)Eq. (3) comprises two terms. The first term, sin
or 2
, is a higher-frequency modulation. The high spatialfrequency speckle noise was eliminated by using the image processing technique based on Fourier optics. The second
term, sin
2
, is a low-frequency modulation varying between -1 and 1. The positive value of sin
2
indicatesbrightness on the image. The brightness will be zero when 2m; m0, 1, 2, etc. The correlated speckles
display bright or dark fringes as a result of the phase difference. The phase difference depends only on the out-of–plane
displacement component dz and the bright fringes are formed [13].
2 m dz (4) Laser Camera CCD Mirror plane Reference Object splitter Beam filter Spatial SOURCE HEAT 2
3. EXPERIMENT RESULTS
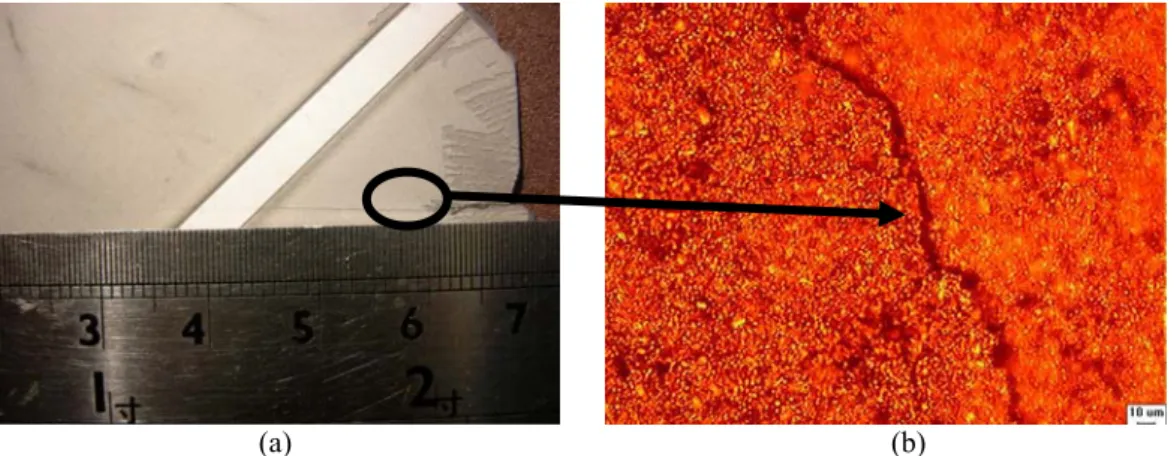
The polycrystalline Si solar cells were used as specimens. Their sizes were 125 × 125 ×0.2 and 175 × 175 × 0.2 mm. One surface of the specimen was coated by anti-reflection film of thickness about 0.015 mm and spread with the regular electrode pattern. The other surface had texturization and two major tin strips having a size of 125 × 4 × 0.01 mm. The edge-clamped solar substrates were heated to induce deflection and generated speckle fringe patterns by using the out-of-plane ESPI. A temperature controllable planar heater was used to provide heat flux to the object as shown in Figure 1. A series of the specklegrams were captured every constant temperature increment by CCD camera, which was controlled by LabVIEW program. Thermal loading was induced by heating the illuminated surface of the specimen. The heater temperature was measured by J-type thermocouple through a module NI-9213, and displayed on PC. The illuminating source was a DPSS laser at a wavelength of 532 nm. According to Eq. (3), the increment of contour was 266 nm. The whole specimen surface was illuminated by an expanded laser beam through a spatial filter. A high-resolution CCD camera of 2448 × 2050 pixels was utilized. A couple of specimens were tested. Each had very a thin edge crack which was artificially made by pressing a small pyramid shaped diamond indenter under a Matsuzawa digital rockwell hardness tester. An eraser is used to knock at the small crack to induce crack propagation from its center location. Figure 2 shows the photo of a crack observed by Axioskop 40 POL microscope. The crack length was about 70 mm, and its width was less than 0.005 mm.
(a) (b)
Figure 2. (a) The visual length of a diagonal edge crack is about 70mm. (b) The width of the crack is less than 5 μm, measured by Axioskop 40 POL microscope.
4. DISCUSSIONS
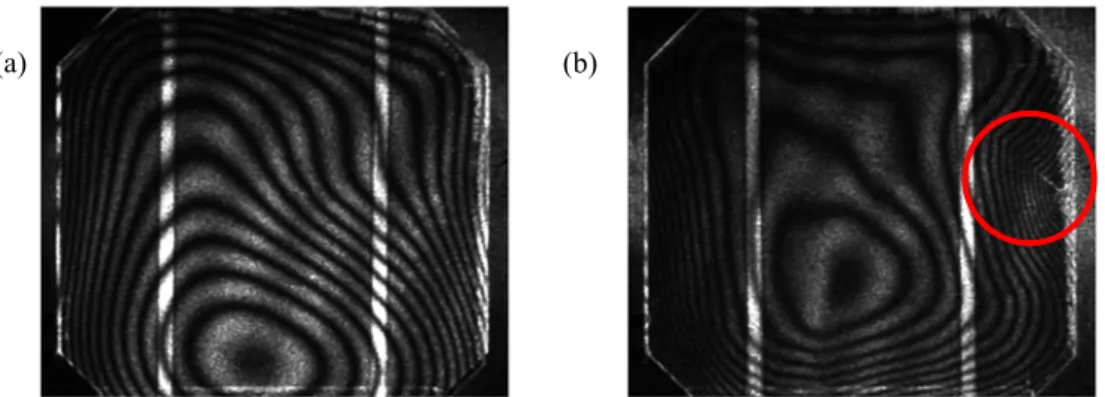
Figure 3(a) shows the out-of-plane ESPI image of a undamaged solar cell. A number of displacement fringes reveal that initial out-of-plane bending deformation appears in the cell because tin-strips and silicon substrate have different coefficients of thermal expansion. Every point in the same fringe has the same out-of-plane displacements in this specimen. Figure 3(b) depicts the interference fringes regarding out-of-plane deformation for a cell with a small artificially made edge defect. The tangential slopes of displacement fringes are discontinuous across the edge crack which appears inside the solid-line circle.
Figure 4 shows the interference fringes recorded for the defect free specimen in temperature ranges of
and , respectively. The speckle pattern exhibits a number of polygons with regular patterns of bright and
dark fringes which are concentric with the center of the specimen. The shape of polygon speckle pattern depends on specimen constraints. The number of fringes is increased due to large temperature increment applying to the specimen. The fringes indicate out-of-plane displacements of the specimen. The maximum displacement was generated in the center of the specimen. Those points located on each fringe possess the same magnitude of displacement. The number of ESPI fringes shown in Figure 3(b) is about twice of that in Figure 3(a) because of double temperature increment.
C 6 . 37 4 . 37 o C 8 . 37 4 . 37 o
Figure 5 reveals speckle fringes of the specimen with an edge defect shown in Figure 2. The fringe patterns for defect free specimen shown in Figure 4 are quite different from those in Figure 5. Two major differences between these ESPI
fringe patterns are found. Firstly, the tangential slopes of contiguous speckle fringes are discontinuous across the crack interface. The uniformity of heat flux transferred from planar heater to the specimen was changed due to the diagonal edge crack in the specimen. It causes the discontinuous displacements at opposite sides of the defect. Secondly, locally
(a) (b)
Figure 3. The out-of-plane ESPI image of a solar cell without damage (a) and the same cell damaged with an edge defect appearing inside the circle (b).
(a) 37.6-37.4℃ (b) 37.8-37.4℃
Figure 4. The interference fringes were measured in defect free specimen under deferent temperature changes.
(a) 37.6-37.4℃ (b) 37.8-37.4℃
Figure 5. The interference fringes were recorded for the specimen with defects at different temperature changes. The mark circular and rectangular regions are the initiating point and arrest point of crack extension, respectively.
concentric polygons are divided into two fringe systems in the central region of specimen by the crack. In addition, the
crack shown in Figure 2(a) is over the half diagonal length of the specimen (76 mm), which is longer than the visual
length 70 mm. The thermal deflection was redistributed over the whole specimen. The second phenomenon observed in the specimen was caused by the non-homogeneous heating-induced deformation. The new maximum displacement would be removed and its location depends on the crack extension and various constraint conditions. The number of fringes in adjacent locally concentric polygons might be different. Optical inspection for a very thin micro-defect in the solar cell is very time-consuming. However, a clear recognition of the heating-induced speckle patterns provides us an effective and rapid inspection for micro-defects in solar cells.
5. CONCLUSIONS
This paper presents a full field nondestructive inspection for micro-defects embedded in PV cells by using ESPI. To achieve consistent conclusion, we have confirmed that each defect-free specimen had the similar speckle patterns under the same constraints, temperature increment, etc. If the specimen had micro-cracks or defects, the interference fringes regarding heating-induced deflection would be different from the undamaged one. The fringe pattern for solar cell produced by laser speckle could be useful to diagnose size and location of very thin micro-cracks.
Only edge defects were considered in this work. The defects were made artificially by a small pyramid-shaped diamond indenter. It is found that the speckle fringes for a small crack are not continuous across the edge crack. It indicates the displacements discontinue across the crack surface. The fringes in the front of crack tip appear with discontinuous tangential slopes. It could be used to characterize the crack length. In addition, the interference fringes on the opposite sides of a long crack have their own individual concentric fringes.
REFERENCES
1. Mikoshiba, N., Nakamura, H., and Tsubouchi, K., “Photoacoustic measurement of nonradiative lifetime and defect
in silicon wafers,” Jpn. J. Appl. Phys., 23, 685-690 (1984).
2. Kasai, M., Shimizu, H., Sawada, T., and Gonhshi, Y., “Non-destructive observation of stacking faults of
silicon-wafer by means of photoacoustic Microscopy,” Analytical Sciences, 1, 107-109 (1985).
3. Berquez, L., Marty-Dessus, D., and Franceschi J. L., “Defect detection in silicon wafer by photoacoustic imaging,”
Jpn. J. Appl. Phys., 42, 1198-1200 (2003).
4. Fu, Z., Zhao, Y., Liu, Y., Cao, Q., Chen, M., Zhang, J., and Lee, J., “Solar cell crack inspection by image
processing,” Proc. Int. IEEE Conf. Business of Electronic Product Reliability and Liability, Shanghai, China, 77-80 (2004).
5. Belyaev, A., Polupan, O., Dallas, W., Ostapenko, S., Hess, D., and Wohlgemuth, J., “Crack detection using
resonance ultrasonic vibrations in full-size crystalline silicon wafers,” Appl. Phys. Lett., 88, 111907(2006).
6. Belyaev, A., Polupan, O., Dallas, W., Ostapenko, S., Hess, D., and Kalejs, J. P., “Resonance ultrasonic vibration
diagnostics of elastic stress in full-size silicon wafers,” Semicond. Sci. Technol., 21, 254-260(2006).
7. Trupke, T., Bardos, E. A., Schubert, M. C., and Warta, W., “Photoluminescence imaging of silicon wafers,” Appl.
Phys. Lett., 89, 044107 (2006).
8. Fuyuki, T., Kondo, H., Yamazaki, T., Takahashi, Y., and Uraoka, Y., “Photographic surveying of minority carrier
diffusion length in polycrystalline silicon cells by electroluminescence,” Appl. Phys. Lett., 86, 262108 (2005).
9. Meinlschmidt, P., Hinsch, K. D., Sirohi, R. S., and Thompson, B. J., [Electronic Speckle Pattern Interferometry
Principle and Practice], SPIE Optical Engineering Press (1996)
10. Chiang, F. P., Anastasi, R., Beatty J., and Adachi, J., “Thermal strain measurement by one-beam laser speckle interferometry,” Applied Optics, 19, 2701-2704 (1980).
11. Hack E.; Bronnimann R., “Electronic speckle pattern interferometry deformation measurement on lightweight structures under thermal load,” Optics and Lasers in Engineering, 31(3), 213-222 (1999).
12. Zarate, E. A., Custodio, E. G., Trevino-Palacios, C. G., Rodriguez-Vera, R., and Puga-Soberanes, H. J., “Defect detection in metals using electronic speckle pattern interferometry,” Solar Energy Materials & Solar Cells, 88, 217-225 (2005).
13. Sirohi S. and Chau, F. S., [Optical Methods of Measurement: Wholefield Techniques], Marcel Dekker, Inc, New York & Basel, 127-182 (1999).