國立交通大學
應用化學研究所
碩士論文
雙芘取代的多面體聚矽氧烷複合奈米粒子:
探討其晶體的微結構以及光致發光的應用
Bispyrenyl POSS Nanoparticle Hybrids: Crystal
Microstructures and Applications
研究生:蔡佳樺
指導教授:張豐志 教授
誌謝
驪歌輕唱,轉眼間我已完成碩士學業,一路從交大應化的大學部念
到碩士畢業,已經過了六年的時間,這段學習的過程對我來說是很寶
貴的經驗。
在我碩士研究生涯裡,首先我要感謝我的指導教授張豐志老師,感
謝老師給我機會在大二的時候就進實驗是做專題,老師強調的自動自
發,讓我可以自由的發揮,培養出自己對研究的興趣。其次我要感謝
我的口試委員,台科大陳建光教授和中山大學郭紹偉教授,給予本論
文的建議與指導,讓本論文更臻完備。另外我要感謝小杜學長,在我
做專題的時候教導我實驗的方法和技巧,才能讓我在實驗上更順利。
在實驗上我要感謝didi學長、智嘉學長、英傑學長以及昀昇學長,有
你 們 在 實 驗 上 的 指 點 和 帶 領 讓 我 能 有 今 日 的 成 果 。
此外要感謝世堅(你亢)、阿發學長們,感謝你們對實驗室辛苦的付
出,以及宜弘、狗弟、文騰、筱雯,感謝你們不僅在實驗上也在生活
上的幫忙,接著要感謝小朱、業昇,你們是我最好的球友,以及實驗
室學弟妹耀正、嘉蔚、佳佑、雅萍、郁娟、昶禎,讓我有志同道合的
朋友,有你們這些同學及學弟妹的陪伴,使我碩士生活更加快樂。另
外我要感謝一直陪在我身邊的幼幼社朋友們,bug、阿寬、云琦、豪
哥、如屏和白兔,在我心情低落的時候,你們的笑容是最好的解藥。
最後我要感謝我的家人,有你們在我背後的支持,才能讓我可以順
利完成碩士學業,在你們的鼓勵下,我也會繼續努力來達成之後的目
標。
Outline of Contents
PagesOutline of Contents I
List of Tables IV
List of Schemes V
List of Figures VI
Abstract (in Chinese) X
Abstract (in English) XII
Chapter 1 Introduction 1
1.1 Organic-Inorganic Hybrid Materials 1 1.1.1 Development of Organic-Inorganic Hybrid Materials 1 1.1.2 Definition of Hybrid Organic-Inorganic materials 2 1.1.3 Synthesis of hybrid materials 3
1.1.3.1 Sol-Gel Process 3
1.1.3.2 Hydrosilylation 4
1.1.4 Application of hybrid materials 6 1.2 Polyhedral Oligomeric Silsesquioxanes (POSS) 7
1.2.1 Development of POSS 7
1.2.2 Structure and Special Properties of POSS 7
1.2.3 Synthesis of POSS 10
1.2.3(a) Synthesis of POSS with partially condensed structure 10 1.2.3(b) Synthesis of monofunctional POSS with condensed structure 10
1.2.4 Microstructure of POSS 12
1.3 Theory of Photoluminescence (PL) 21
1.3.1 Pyrene 23
Chapter 2 Motivation 33
Chapter 3 Experimental Section 37
3.1 Materials 37
3.2 Purification of Solvents 40
3.2.1 THF 40
3.2.2 Toluene 40
3.3 Synthesis of Hydride-monofunctional Isobutyl-POSS (Si-H iBu-POSS) 41 3.4 Synthesis of Vinyl-functional Bispyrene (V-BPy) 42 3.5 Synthesis of Bispyrene-monofunctional isobutyl-POSS (BPy-POSS) 43 3.6 Preparation of i-Bu POSS and BPy-POSS blends 44
3.7 Characterization 45
3.7.1 NMR Spectroscopy 45
3.7.2 Matrix-Assisted Laser Desorption Inoization-Time of Flight Mass Spectrometry (MALDI-TOF MS)
45
3.7.3 Differential Scanning Calorimetry (DSC) 45 3.7.4 Thermal Gravimetric Analysis (TGA) 46 3.7.5Ultraviolet-Visible spectroscopy (UV-Vis) 46 3.7.6 Photoluminescence Spectroscopy (PL) 46 3.7.7 X-Ray Powder Diffraction (XRD) 47
3.7.8 Confocal Microscopy 47
3.7.9 Atomic Force Microscopy (AFM) 48 3.7.10 Transmission Electron Microscopy (TEM) 48 3.7.11 Dynamic Light Scattering (DLS) 49
Chapter 4 Results and Discussion 50
4.2 Character of BPy-POSS 54
4.2.1 Thermal properties 54
4.2.2 Transmission Electronic Microscopy (TEM) 55 4.2.3 UV-Vis and PL Spectroscopy 56 4.2.4 Dynamic Light Scattering (DLS) 61
4.3 Microstructure of Blends 64
4.3.1 Microscopy 65
4.3.1.1 Confocal Microscopy 65
4.3.1.2 Atomic Force Microscopy (AFM) 66
4.3.2 X-Ray Powder Diffraction 67
4.3.3 Differential Scanning Calorimeter (DSC) 68
4.4 Application in Chemosensor 70
Chapter 5 Conclusion 77
List of Tables
Pages Table 4-1. Compositions of pure i-Bu POSS, blend II, blend III and pureBPy-POSS.
List of Schemes
Pages Scheme 1-1. Fundamental reaction steps in the sol-gel process based ontetrialkoxysilanes
4
Scheme 1-2. Fundamental reaction steps in the sol-gel process based on
tetrialkoxysilanes
5
Scheme 1-3. Idealized mechanism for metal-catalysed hydrosilylation of an
alkene
5
Scheme 1-4. The mechanism of hydrosilylation using Karstedt’s catalyst 6
Scheme 1-5. The mechanism of binding with M2+ 30
Scheme 3-1. Synthesis of (a) Si-H iBu-POSS and (b) BPy-POSS 44
Scheme 4-1. Formation of crystal POSS thin film though advancing and
receding process
List of Figures
Pages Figure 1-1. Selected interactions typically applied in hybrid materials and theirrelative strength
3
Figure 1-2. Preparation and chemical structures of silsesquioxanes (RSiO1.5)n:
(a) random networks, (b) ladder chains, and (c) the cage NPs T8 (n = 8), T10 (n = 10), T12 (n = 12), and T7 (n = 7)
9
Figure 1-3. Cube and Cage-like Structure of POSS 9
Figure 1-4. Bond Angle and Bond Length of T8-POSS 10
Figure 1-5. Completely (1) and partially condensed (2, 3) structures of POSS 11
Figure 1-6. Synthesis of monofunctional POSS 12
Figure 1-7. Monofunctionalized POSS prepared by hydrosilylation 12
Figure 1-8. Diffractogram of POSS cyclopentyl-norbornyl monomer 15
Figure 1-9. Transmission electron micrographs of crystals of cyclopentyl-
norbornyl monomer (Gold shadowed)
16
Figure 1-10. Schematic of hexagonally packed POSS molecules. The sequence
of packing in adjacent layers is ABCA. This figure is purely schematic and the distances within the structure as drawn are not intended to be representative of the values in the real crystal
17
Figure 1-11. PLM micrograph of P5T-POSS at room temperature 18
Figure 1-12. TEM images, (various) magnifications, and AFM sectional
analyses of the (a, b) SH-POSS and (c, d) POSS-Au1 fernlike microstructures
19
Figure 1-13. Schematic representation of the formation of fernlike POSS-Au1
microstructures
20
Figure 1-15. Franck-Condon principle energy diagram. Since electronic
transitions are very fast compared with nuclear motions, vibrational levels are favored when they correspond to a minimal change in the nuclear coordinates. The potential wells are shown favoring transitions between v = 0 and v = 2
23
Figure 1-16. Chemical structure of pyrene 24
Figure 1-17. UV-Vis and PL spectra of pyrene 25
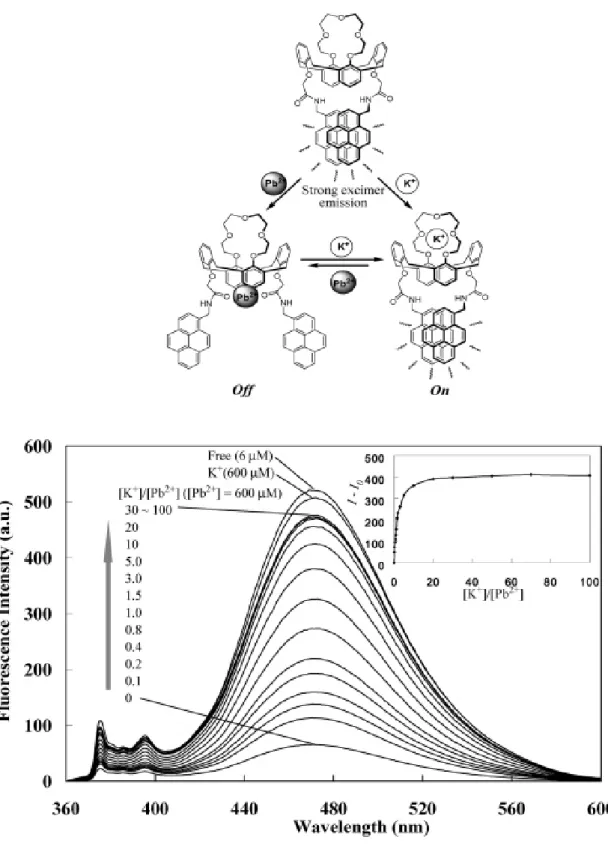
Figure 1-18. Schematic potential energy diagrams for pyrene excimer formation 25 Figure 1-19. Effect of added Pb2+ on the fluorescence emission spectra in
MeCN. (The excitation wavelength was 344 nm.)
28
Figure 1-20. Fluorescence emission changes for the Pb2+ complex in MeCN
upon addition of K+. (The excitation wavelength was 344 nm.)
29
Figure 1-21. Fluorescence spectra of 1 (6.0 μM) upon titration with Bu4N+F- in
MeCN. Excitation wavelengths were (a) 346 and (b) 400 nm, respectively. Inset: excitation spectra (normalized) monitored at 385 (solid line) and 470 nm (dashed line) in the presence of 1000 equiv of Bu4N+F
-31
Figure 1-22. Fluorescence spectra of a 9 nm thick PBPOSS film upon exposure
to TNT vapor for different times. From top to bottom, the exposure time was 0, 10, 30, 60, 120, 180 and 300 s, respectively. Inset: plot of quenching efficiency (%) versus time
32
Figure 2-1. (a) Open and close forms of BPy-POSS microstructure, (b) thin
film of blend of BPy-POSS and i-Bu POSS
36
Figure 4-1. 1H NMR spectra of (a) trisilanolisobutyl POSS, (b) Si-H
iBu-POSS, (c) Py-OH, (d) V-BPy, and (e) BPy-POSS
Figure 4-2. 29Si NMR spectra of BPy-POSS 53
Figure 4-3. MALDI-TOF mass spectrum of BPy-POSS 53
Figure 4-4. DSC thermograms of (a) i-Bu POSS, (b) V-BPy, and (c)
BPy-POSS
55
Figure 4-5. Bright-field TEM micrograph for a thin section of BPy-POSS
without stained
56
Figure 4-6. UV-Vis spectra of dichloromethane solutions (10-5 M) of (a)
Py-OH, (b) V-BPy, and (c) BPy-POSS
59
Figure 4-7. Normalized emission and excitation spectra of dichloromethane
solutions (10-5 M) of (a) Py-OH, (b) V-BPy, and (c) BPy-POSS
60
Figure 4-8. Normalized emission and excitation spectra of thin film samples of
(a) Py-OH, (b) V-BPy, (c) BPy-POSS, (d) thermal annealed V-BPy, and (e) thermal annealed BPy-POSS
61
Figure 4-9. Chem 3D MM2 calculations and 3D structures of (a) a POSS core,
(b) the iso-butyl group of i-Bu POSS, (c) the bispyrenyl group of BPy-POSS
62
Figure 4-10. Particle distribution of i-Bu POSS by DLS 62
Figure 4-11. Particle distribution of BPy-POSS by DLS 63
Figure 4-12. (a) OM images, (b) PL images, and (c) their superimposed images
for thin-film blends I-IV
66
Figure 4-13. AFM 2D images and sectional analyses of (a) blend II and (b) blend
III with scale of 20× 20 μm2
67
Figure 4-14. XRD spectra of thin-film Samples I-IV 68
Figure 4-15. DSC thermograms of blends (a) II, (b) III, and (c) 50 wt%
BPy-POSS and 50 wt% i-Bu POSS
Figure 4-16. Schematics of the designed apparatus 72 Figure 4-17. Fluorescence spectra of blend II thin film before and after being
treated with nitrobenzene vapor.
73
Figure 4-18. Fluorescence spectra of blend III thin film before and after being
treated with nitrobenzene vapor.
74
Figure 4-19. Fluorescence spectra of pure BPy-POSS thin film before and after
being treated with nitrobenzene vapor.
75
Figure 4-20. Quenching efficiency of nitrobenzene to the fluorescence emission
of blend II and blend III thin films.
雙芘取代的多面體聚矽氧烷複合奈米粒子:
探討其晶體的微結構以及光致發光的應用
學生:蔡佳樺
指導教授:張豐志
國立交通大學應用化學研究所 碩士班
摘 要
我們利用零價鉑催化的氫化反應使含有矽烷官能基的異丁基多
面體聚矽氧烷與含有雙芘取代的雙鍵分子反應而合成出一個單官能
基雙芘取代的異丁基多面體聚矽氧烷(蝴蝶狀的BPy-POSS).我們對
BPy-POSS的性質做了一連串的研究.從微分掃描卡計 (DSC)中我們可
以發現BPy-POSS是一個像高分子一樣,半結晶性的小分子,在放射光
譜中也可看出芘類強烈的excimer emission.我們製備出混合不同比
例的BPy-POSS和i-Bu POSS的薄膜,並且探討它們的微結構. 經由光
學顯微鏡以及原子力顯微鏡,我們觀察出其特殊的蕨葉狀微結構;我
們猜想此一蕨葉狀微結構的形成是由於i-Bu POSS和i-Bu POSS 的堆
疊.在溶劑揮發到結晶的過程,i-Bu POSS會先結晶作為一個 POSS 的
基板,然後BPy-POSS再分散在i-Bu POSS基板的表面上.使用X-ray 散
射圖譜以及微分掃描卡計我們也確實可以證明i-Bu POSS和BPy-POSS
會微觀相分離的結果.我們利用這種會自組裝的特點形成雙芘的薄膜
可應用在硝基芳烴的氣體的偵測.當表面的雙芘暴露在充滿硝基芳烴
的 蒸 氣 裡 , 硝 基 芳 烴 很 快 速 了 抑 制 雙 芘 excimer emission. 利 用
BPy-POSS和i-Bu POSS的自組裝薄膜, 使用少量的BPy-POSS也可以達
到不錯的偵測效果.
Bispyrenyl POSS Nanoparticle Hybrids: Crystal
Microstructures and Applications
Student:Chia-hua Tsai
Advisors:Dr. Feng-Chih Chang
Institute of Applied Chemistry
National Chiao Tung University
ABSTRACT
A bispyrenyl monofunctionalized isobutyl-polyhedral oligomeric silsesquioxane (butterfly-like BPy-POSS) is synthesized by Pt (0)-catalyzed hydrosilylation between silane-monofunctional isobutyl-POSS and bispyrenyl alkene. By DSC, we found that BPy-POSS is a polymer-like semi-crystal molecule. Strong excimer emission was observed in PL spectra. Blends of BPy-POSS and isobutyl-POSS were fabricated to investigate their microstructures. Fern-like microstructures can be seen by OM and AFM; we suspected that the cause of forming fern-like structures is POSS-POSS recognition. During solvent evaporation, i-Bu POSS crystallize as a POSS template, and then BPy-POSS dispersed on the surface of POSS template. The data of XRD and DSC could be an evidence of phase separation of i-Bu POSS and BPy-POSS.
We used these self-assembled films to do the application of attachment to nitroaromatic compounds. Upon exposure to nitrobenzene vapor, the films show fast fluorescence quenching. The high performance is based on the microstructure of BPy-POSS and i-Bu POSS on the film surface. Using the self-assembled blend thin films of i-Bu POSS and BPy-POSS, we could achieve the goal of detection of nitrobenzene by using small amount of BPy-POSS.
Chapter 1 Introduction
1.1 Organic-Inorganic Hybrid Materials
1.1.1 Development of Organic-Inorganic Hybrid Materials
Thousands of years ago, the production of bright and colorful paints was the
driving force to consistently try novel mixtures of organic dyes or inorganic pigments and other inorganic and organic components to form paints that were used thousands of years ago. Therefore, hybrid materials or even nanotechnology is not an invention of the last decade but was developed a long time ago. However, it was only at the end of the 20th and the beginning of the 21st century that it was realized by scientists. Apart from the use of inorganic materials as fillers for organic polymers, such as rubber, it was a long time before much scientific activity was devoted to mixtures of inorganic and organic materials. One process changed this situation: the sol-gel process. This process was developed in the 1930s using silicon alkoxides as precursors from which silica was produced. Contrary to many other procedures used in the production of inorganic materials this is one of the first processes where ambient conditions were applied to produce ceramics. The control over the preparation of multicomponent systems by a mild reaction method also led to industrial interest in that process. In particular the silicon based sol-gel process was one of the major driving forces what has become the broad field of inorganic-organic hybrid materials. Some similarities to sol-gel chemistry are shown by the stable metal sols and colloids, such as gold colloids, developed hundreds of years ago. Such metal colloids have been used for optical applications in nanocomposites for centuries. In particular many reports of the scientific examination of gold colloids, often prepared by reduction of gold salts, are known from the end of the 18th century. Probably the
first nanocomposites were produced in the middle of the 19th century when gold salts were reduced in the presence of gum arabic. Currently many of the colloidal systems already known are being reinvestigated by modern instrumental techniques to get new insights into the origin of the specific chemistry and physics behind this materials.1
1.1.2 Definition of Hybrid Organic-Inorganic materials
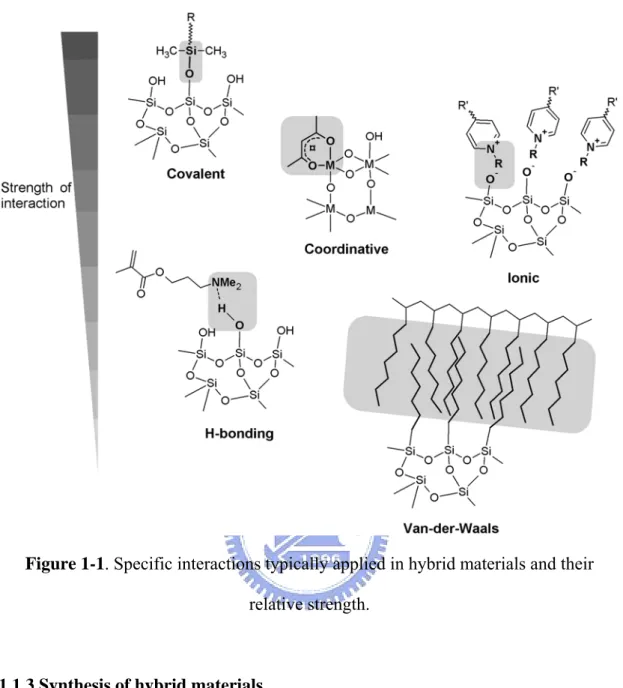
The term hybrid material is used for many different systems spanning a wide area of different materials, such as crystalline highly ordered coordination polymers, amorphous sol-gel compounds, materials with and without interactions between the inorganic and organic units. Hybrid organic-inorganic materials are not simply physical mixtures. The most wide-ranging definition is the following: A hybrid material is a material that includes two moieties blended on the molecular scale; commonly one of these compounds is inorganic and the other one organic in nature. A more detailed definition distinguishes between the possible interactions connecting the inorganic and organic species. For example there are hydrogen bonds that are definitely stronger than for example weak coordinative bonds (Figure 1-1).1 Consequently the properties of hybrid materials are not only the sum of the individual contributions of both phases, but the role of their inner interfaces could be predominant. The nature of the interfaces has been used to grossly divide these materials into two distinct classes: (Sanchez 1994 New Journal of Chemistry) In Class Ⅰ, organic and inorganic components are embedded and only hydrogen, van der Waals or ionic bonds given cohesion to the whole structure. In Class Ⅱ materials, the two phases are partly linked together through strong chemical covalent or ionic-covalent bonds.2
Figure 1-1. Specific interactions typically applied in hybrid materials and their
relative strength.
1.1.3 Synthesis of hybrid materials 1.1.3.1 Sol-Gel Process
This process is chemically related to an organic polycondensation reaction in which small molecules form polymeric structures by the loss of substituents. The silicon-based sol-gel process is probably the one that has been most investigated; therefore the fundamental reaction principles are discussed using this process as a model system. One important fact also makes the silicon-based sol-gel processes a predominant process in the formation of hybrid materials, which is the simple incorporation of organic groups using organically modified silanes. Si-C bonds have
enhanced stability against hydrolysis in the aqueous media usually used, so it is possible to easily incorporate a large variety of organic groups in the network formed. Principally R4–nSiXn compounds (n = 1-4, X = OR’, halogen) are used as molecular
precursors, in which the Si-X bond is labile towards hydrolysis reactions forming unstable silanols (Si-OH) that condensate leading to Si-O-Si bonds. In the first steps of this reaction oligomers and polymers as well as cyclics are formed subsequently resulting in colloids that define the sol. Solid particles in the sol afterwards undergo crosslinking reactions and form the gel (Scheme 1-1).1
Scheme 1-1. Typical sol-gel process using tetrialkoxysilanes.
1.1.3.2 Hydrosilylation
The hydrosilylation reaction is a general method of adding a Si-H bond across a C-C double bond. This method encompasses a wide variety of substituted alkenes, dienes, and alkynes leading to many different organosilicon products.3 Trialkoxysilane groups are typically introduced by a platinum catalyzed reaction between an unsaturated bond and a trialkoxysilane (Scheme 1-2).1 The mechanism is usually assumes the
intermediacy of a metal complex that contains a hydride, a silyl ligand (R3Si), and the
alkene or alkyne substrate (Scheme 1-3).4-5 In our research, we used the Karstedt’s catalyst to complete the hydrosilylation (Scheme 1-4).6
R
+
HSi(OR)
3Pt
R
Si(OR)
3Scheme 1-2. Pt(0)-catalyzed hydrosilylation.
L
nM
R
3SiH
L
nM
SiR
3H
R'CHCH
2-L
R'
M
SiR
3H
L
n-1L
n-1M
SiR
3R'
+L
-R
3SiCH
2CH
2R'
Scheme 1-4. Mechanism of hydrosilylation using a Karstedt’s catalyst.
1.1.4 Application of hybrid materials
Organic-inorganic hybrids can be applied in many branches of materials chemistry
because they are simple to process and are amenable to design on the molecular scale. Organic-inorganic hybrid materials do not only represent a creative alternative for the design of new materials and compounds for academic research, but their improved or unusual features open promising applications in many areas: optics, electronics, ionics, mechanics, energy, environment, biology and medicine. Applications include smart membranes and separation devices, functional smart coatings, a new generation of photovoltaic and fuel cells, photocatalysts, new catalysts, sensors, smart microelectronics, micro-optical and photonic components and systems for nanophotonics, innovative cosmetics, intelligent therapeutic vectors that combine targeting, imaging, therapy and controlled release of active molecules, nanoceramic-polymer, composites for the automobile or packaging industries, etc…
1.2 Polyhedral Oligomeric Silsesquioxanes (POSS) 1.2.1 Development of POSS
Earliest in 1900s, Silsesquioxanes was obtained by Kipping using hydrolysis and
polycondensation of silane compounds,7 but it wasn’t complete; until 1960s, Brown and Vogt build up a more complete method of synthesis of silsesquioxanes.8 In 1994, for development of one kind of polymer material with light and high performance, US Airforce Research Laboratory chose the PDMS (polydimethylsiloxane), designed and produced on large scale of a series of polyhedral oligomeric silsesquioxanes (POSS).
1.2.2 Structure and Special Properties of POSS
Silsesquioxanes are products of sol-gel reactions between monofunctional
trichloro-silanes and trialkoxy-silanes nanostructures; they have the chemical structure (RSiO1.5)n, where R is a hydrogen atom or an organic functional group, such
as an alkyl, alkylene, acrylate, hydroxyl, or epoxide unit, and n is the number of repeating units. Figure 1-2 indicates that silsesquioxanes may be formed in random, ladder, cage, and partial-cage structures. The siloxane plane having the chemical structure Si4O4R4(OH)4 is the building block in the ladder polysilsesquioxanes and the
cage-type polyhedral oligomeric silsesquioxane (POSS) derivatives. Interestingly, POSS molecules can be regarded as cyclic polysilsesquioxane oligomers; for example, T8, T10, and T12 POSS are cyclic oligomers with 4, 5, and 6 planes of R4Si4O4 units.
(T = number of RSiO1.5 units; Fig. 1-2b, c).9 Recent years, research of POSS focuses
on the T8 shape; T8-POSS is a cage-like structure, instead of a cube structure (Figure
1-3). In 1957, K. Olsson10 used X-Ray to characterize the structure of POSS, in his
research, it could be seen that the cage-like structure is not symmetrical; the average angle of Si-O-Si is 145°, and angles of O-Si-O is in the range of 108-113°; the average value of bond length is 1.61±0.025 Å (Figure 1-4). POSS are completely defined
molecules of nanoscale dimensions that may be functionalized with reactive groups suitable for the synthesis of new organic-inorganic hybrids, thus providing the opportunity to design and build materials with extremely well-defined dimensions possessing nanophase behavior.9,11-24
Highly symmetric T8-POSSs with alkyl chains on a siloxane cube can pack into a crystal with hexagonal unit cells expect for hydrosilylated amorphous T8-POSS products (a mixture of α- and β-isomers). 9,14Due to freely intramolecular rotation, the monofunctional T8-POSSs, sol-gel products between trisilanol T7-POSS and mono-functional silane, can be also served as spheres to form a similar crystal.15 POSS molecules can be regarded as core-shell colloids with solvated alkyl or aryl shells to disperse insoluble siloxane cores in solution. Thus, POSS crystals should be modeled upon the molecular packing of soft balls on a given substrate in comparison with hard spherical models for metal crystals.
Si R' R R' R' R: organic groups R': Cl, OMe or OEt + H2O hydrolysis Si O- R R R' R' + R'OH silane condensation Si O R R' R' Si R' R' + R'OH hydrolysis & condensation H+/OH -Si Si Si Si Si Si Si Si Si Si Si Si Si Si Si Si Si Si Si Si Si Si O O O O O R R R R R R R R R R O O O O O O R R R R R R R R R R R R O O O O O O O O O O O O O O O O O O O O O O O Si O Si O Si O Si O Si O Si OH OH Si O O O OH R R R R R R R O Si O Si O Si O Si R HO R HO R R O Si O Si O Si O Si R OH OH R R O O O Si O Si Si O Si O Si O Si OH Si O O R R R R R R R HO R O Si O Si O Si O Si O Si HO Si O O Si O O R R R R R R R O O Si O O O R R Si HO OH HO O Si O Si O Si O Si O Si O Si O O Si O O O O R R R R R R R R Si
(a) Random Structures (b) Ladder Structures
(c) Cage Structures
(c1) T8 (c2) T10 (c3) T12 (c4) T7
Figure 1-2. Preparation and chemical structures of silsesquioxanes (RSiO1.5)n: (a)
random networks, (b) ladder chains, and (c) the cage NPs T8 (n = 8), T10 (n = 10), T12 (n = 12), and T7 (n = 7).11
Figure 1-3. Cube and cage-like structure of POSS.
Cubic-like
O Si O Si O Si O Si O Si O Si O O Si O O O O R R R R R R R R SiCage-like
Figure 1-4. Theoretical bond angle and bond length of T8-POSS.
1.2.3 Synthesis of POSS
(a) Synthesis of POSS with partially condensed structure
POSS 2 and 3 in Figure 1-5 are synthesized via the hydrolytic condensation of RSiCl3 (R= cyclo-C6H11) in acetone at room temperature; the product yield depends
on the reaction time and reached ~70%. The product is a readily resolvable mixture containing ~45% 3 and ~15% 2.8,25-26
(b) Synthesis of monofunctional POSS with condensed structure
Monofunctional POSS are usually synthesized by a corner capping reaction of a trisilanol, R7Si7O9(OH)3, containing seven nonreactive organic groups such as c-C5H9,
c-C6H11, and i-C4H9, with R’SiX3, where R’ bears a reactive site (vinyl, allyl,
isocyanate, epoxy, etc.) and X = halogen or alkoxide (Figure 1-6).27-29 The hydrosilylation reactions of unsaturated organic monomers with monofunctional silanes containing one reactive group X = H or OSi(CH3)2H play an important role in
the POSS functionalization processes. The reactions of hydrosilylation of unsaturated organic monomers with POSS 5 in the presence of 0.01-5 wt % Karstedt’s or Speier’s catalyst are used for preparation in a quantitative yield of mono-functionalized POSS
(6) or another POSS containing a cyclo-olefin group (R = cyclo-C6H11 or cyclo-C5H9).
(Figure 1-7).25,30-31
Figure 1-6. Synthesis of monofunctional POSS.
Figure 1-7. Monofunctionalized POSS prepared by hydrosilylation.
1.2.4 Microstructure of POSS
Self-assembly of functionalized nano-building blocks is a promising strategy for
controlled organization of NPs into ordered or hierarchical structures allows coupling of their size- and shape-dependent properties to obtain potentially useful materials for optoelectronics, sensing, imaging, and biomedical applications.32-35 A broad range of targeted self-assembled structures can be produced by organizing NPs exhibiting compositional heterogeneity.36-39 They can be realized either by synthesizing NPs from several different materials or by selectively attaching organic molecules to different sites of the NPs.40-42 Compositional heterogeneity makes NPs conceptually similar to amphiphilic molecules (e.g., surfactants or block copolymers) and allows the thermodynamic approach of self-assembly to be used to form “colloidal molecules” in energetically favorable structures possessing unique properties.43-53 Ordered monolayers of NPs over large surface areas are sensitive to the presence of defects on the substrate’s surface, which can destroy the assembly. In contrast, large ordered arrays of NPs can be obtained through judicious choice of the types of chemical interactions between the particles and the substrate.54-55
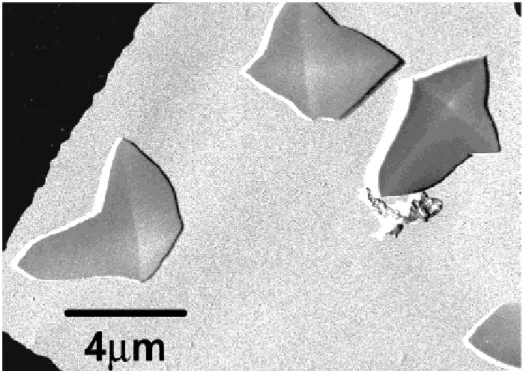
Platelike morphologies of POSS crystals, with lateral dimensions on the order of a few micrometers and thicknesses of a few hundred nanometers, have been described several times previously.14,16 Waddon et al.,16 indicated that the crystal structure and morphology of one specific POSS monomer with alkyl attachments was characterized using X-ray and electron microscopy method (Figure 1-8 and Figure 1-9). The eight cornered central cages arrange in one plane on a hexagonal array. These cages can be regarded as being approximately spherical. The three-dimensional structure is achieved by stacking such hexagonally packed planes in ABCA sequence such that each fourth layer lies exactly above the first layer,56 as shown schematically in Figure
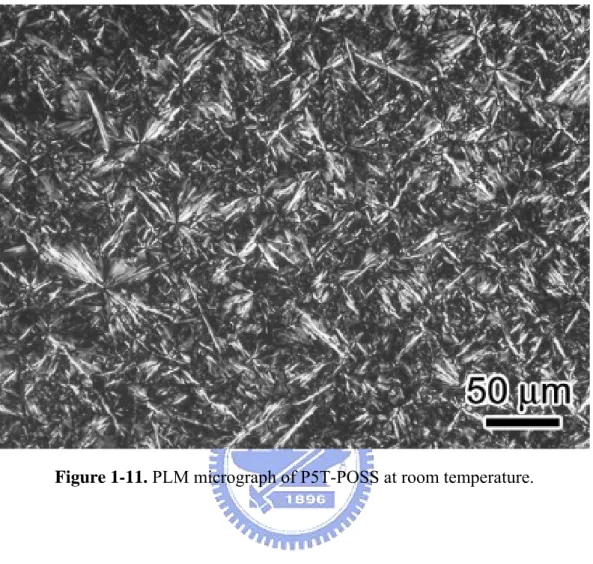
1-10.16 Lei Zhu’ s group17 investigated the self-assembly behavior of POSS linked
with liquid crystal, an asymmetric disk-cube dyad molecule was synthesized by covalently attaching 2-hydroxy-3,6,7,10,11- pentakis(pentyloxy)triphenylene
(P5T-OH) discotic molecule to a cubic polyhedral oligomeric silsesquioxane (POSS) molecule via a spacer. The sample was denoted as P5T-POSS. The PLM observations of P5T-POSS at room temperature in Figure 1-11 showed poorly organized crystalline spherulites. Because the isotropization of P5T liquid crystals and melting of POSS superposed at 66 °C in neat P5T-POSS, this micrograph represented a state where P5T was liquid crystalline and POSS was crystalline.17
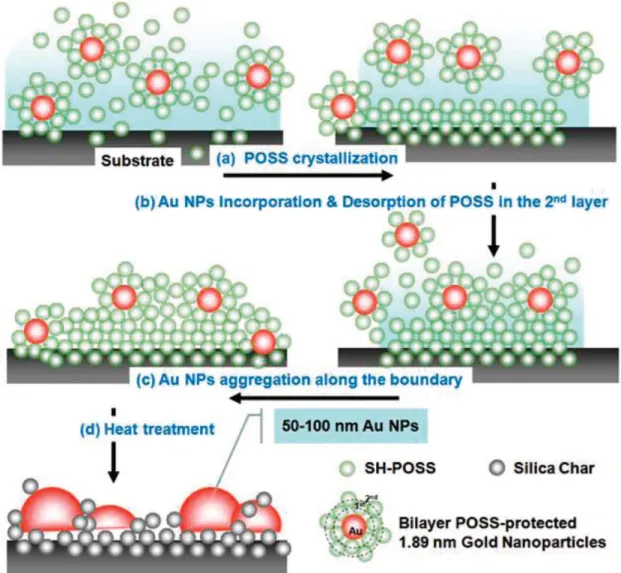
In Lu’s paper,15 ordered fernlike 3D microstructures of assembled POSS-Au hybrid NPs onto a large-scale crystalline POSS template was prepared. The fernlike structure of the POSS-Au hybrids was analyzed using TEM and AFM (Figure 1-12), and they propose the structural model for the formation of the fernlike hybrid microstructures in Figure 1-13. During the process of solvent evaporation, excess SH-POSS colloids (i.e., those not bound onto Au cores) tend to pack in the form of fernlike and platelike crystals that function as templates for the self-assembly of POSS-Au NPs onto the surface interstices of the SH-POSS crystals. Upon reducing the SH-POSS concentration in toluene, the SH-POSS colloids on the second layer of the bilayer of the POSS-Au NPs are released to fill the gaps between the incorporated Au NPs. Finally, the monolayer-protected POSS-Au NPs aggregated at the boundaries of the fern micropatterns, resulting in the POSS-Au NP hybrid fernlike micropatterns. Thus, POSS hybrid nanoparticles would be excellent and functional building blocks for microsized and nanosized ordered patterns.
Figure 1-9. Transmission electron micrographs of crystals of cyclopentyl-norbornyl
Figure 1-10. Schematic of hexagonally packed POSS molecules. The sequence of
packing in adjacent layers is ABCA. This figure is purely schematic and the distances within the structure as drawn are not intended to be representative of the values in the
Figure 1-12. TEM images, (various) magnifications, and AFM sectional analyses of
Figure 1-13. Schematic representation of the formation of fernlike POSS-Au1
1.3 Theory of Photoluminescence (PL)
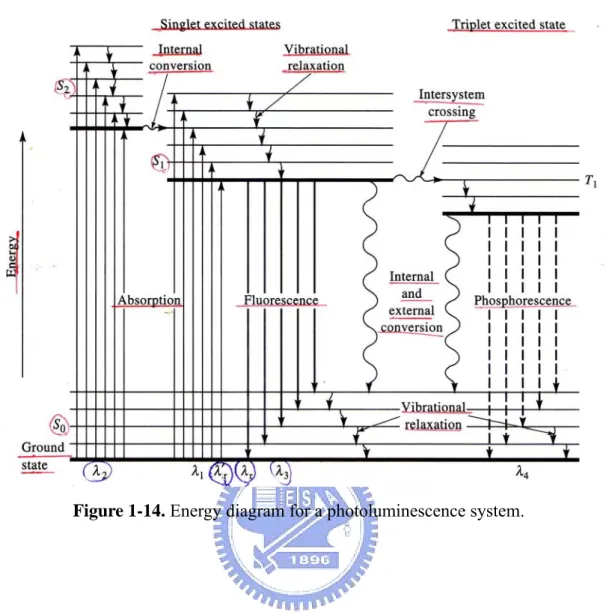
After receiving the energy, electrons of chemical molecules excite from ground state to excited state. These molecules with high energy are unstable and transient, the energy must be released and the molecules would return to the ground state. In the process of energy release, there’s many ways to choose: (1) Internal Conversion: S1→S0, (2) Intersystem Crossing: S1→T1, (3) Fluorescence: S1→S0+hν, (4)
Photochemical Reaction. Except transferred to light and released in some ways of energy release, the energy can be released by the form of heat. Only high-efficiency fluorescent (Phosphorescent) materials have more energy of excited state to release the energy.
As shown in Figure 1-14, a molecule may be promoted to any several vibrational levels during the electronic excitation process. In solution, however, the excess vibrational energy is immediately lost as a consequence of collisions between the molecules of the excited species and those of the solvents; the result is an energy transfer and a minuscule increase in temperature of the solvent. This relaxation process is so efficient that the average lifetime of a vibrationally excited molecule is 10-12 s or less, a period significantly shorter than the average lifetime of an electronically excited state. As a consequence, fluorescence from solution, when it occurs, always involves a transition from the lowest vibrational level of an excited electronic state. Several closely spaced peaks are produced, however, since the electron can return to any one of the vibrational levels of the ground state, whereupon it will rapidly fall to the lowest vibrational level of the ground electronic state by further vibrational relaxation (Figure 1-15). 67
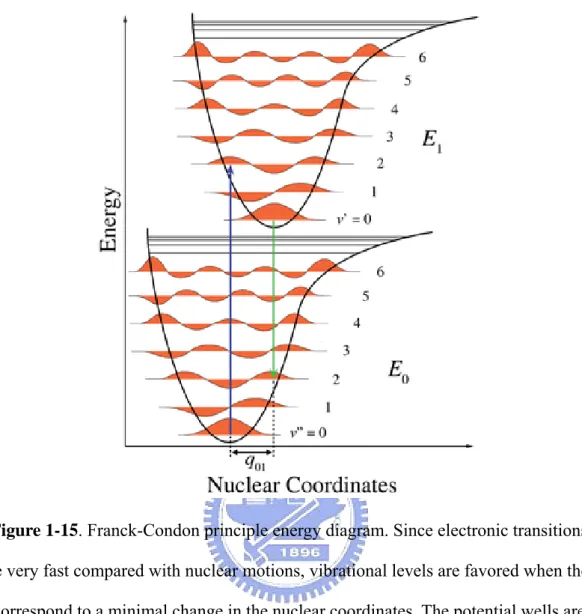
Figure 1-15. Franck-Condon principle energy diagram. Since electronic transitions
are very fast compared with nuclear motions, vibrational levels are favored when they correspond to a minimal change in the nuclear coordinates. The potential wells are
shown favoring transitions between v = 0 and v = 2.
1.3.1 Pyrene
Pyrene( Figure 1-16) is a polycyclic aromatic hydrocarbon (PAH) consisting of
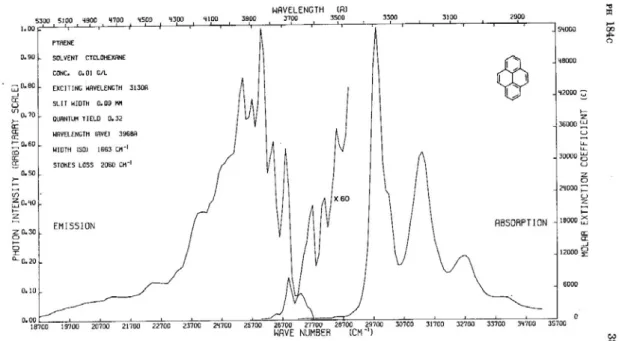
four fused benzene rings, resulting in a flat aromatic system. Pyrenyl photoluminescence compounds have been widely used as photosensitive probes in detecting chemical analytes such as explosively nitroaromatic compounds, oxygen, and bimoleculesbecause pyrene has a high quantum yield (0.65 in ethanol at 293 K), long-lived excited state and a strong affinity with these analytes such as nitroaromatic compounds.58-62Figure 1-17 shows the UV-Vis absorption and PL emission spectra of
pyrene.63 The UV-Vis absorption of pyrene molecules is around 335 nm, and the fluorescence emission is around 370-450 nm. If two pyrenyl groups are close to each other ( i.e. within a few Å), they can form an excited state dimer (excimer) upon excitation. Compared to excited monomers, excimers produce a red-shifted spectrum.64-65 An excimer, as defined by Birks, is a dimer which is associated in an electronic excited state and which is dissociative in its ground state.66 The formation of a pyrene excimer requires encounter of an electronically excited pyrene with a second pyrene in its ground electronic state. According to this definition the two pyrenes must be sufficiently far apart when light is absorbed, so that the excitation is localized on one of them. This excited pyrene, often referred to as “locally-excited” pyrene, gives rise to “monomer” emission. The observation of excimer emission indicates that diffusive encounter between the pyrenes has occurred. There are also instances where an excimer-like emission is observed, but there is no evidence that the pyrenes are separated when the light is absorbed. Because this emission strongly resembles pyrene excimer emission, many people refer to these excited species as “static excimers” (Figure 1-18b). By contrast, excimers which satisfy the Birks definition are referred to as “dynamic excimers” (Figure 1-18a).67
Figure 1-17. UV-Vis and PL spectra of pyrene.
1.3.2 Fluorescent Chemosensor
Fluorescent chemosensors capable of selectively recognizing cations have potential
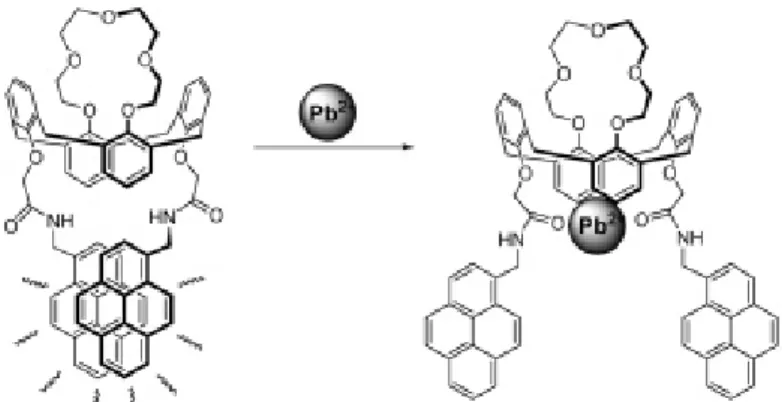
analytical applications in many different fields, including chemistry, biology, and medicine.68-71 Most of the fluorescent chemosensors for cations are composed of a cation recognition unit (ionophore) together with a fluorogenic unit (fluorophore) and are called fluoroionophores.70 An effective fluorescence chemosensor must convert the event of cation recognition by the ionophore into an easily monitored and highly sensitive light signal from the fluorophore.72 As fluorogenic units, pyrenes (Py) are one of the most useful because of their relatively efficient excimer formation and emission.73 In Kim’s74 paper, A 1,3-alternate calix[4]crown platform provides a crown ether ring for metal ion complexation to detect the Pb2+ and K+ ions. The mechanism of binding with Pb2+ was shown in Figure 1-19. Binding with Pb2+ was result in weak excimer emission, however, when adding K+ ion, alkali metal cations are bound by the crown-5 ring and hardly affects the excimer stability, and little change in its emission intensity is observed (Figure 1-20).
In Hideya Yuasa’s75 work, the ring flip of a carbohydrate is employed for the tongs-like movable component of a metal ion sensor. A pair of separated pyrene groups attached to the carbohydrate component is placed side by side when it recognizes metal ions, affording excimer fluorescence. This molecular sensor is selective for Zn2+ and Cd2+; the mechanism is shown in Scheme 1-5.
For anions, Kim’s groups also do the research work on the detection of F-.80 Calixarene-based fluorescent chemosensor with two fluorogenic pyrene units conjugated to amide groups as guest recognition sites is synthesized. Complexation of F- causes a red shift of its absorption band to 400 nm (Δλ=54 nm) and a blue shift of the excimer emission to 470 nm (Δλ=12 nm) together with enhanced fluorescence
intensity. The blue-shifted excimer emission is attributed to a pyrene dimer formed in the ground state, a so-called static excimer (Figure 1-21).
Besides detection of cations74-79, anions80-81 and biomolecules82-85, detection of nitroaromatic compounds (NACs) 59, 81 would be important. An ester (PBPOSS) of 1-pyrenebutyric acid (PBA) and POSS was synthesized by Hua Bai and co-workers.81 Upon exposure to the vapours of nitroaromatic compounds, including trinitrotoluene and dinitrotoluene, the films show fast fluorescence quenching. The high performance of these gas sensors is due to the high excimer contents and good vapour permeability of the PBPOSS films (Figure 1-22).
Figure 1-19. Effect of added Pb2+ on the fluorescence emission spectra in MeCN.
Figure 1-20. Fluorescence emission changes for the Pb2+ complex in MeCN upon
Figure 1-21. Fluorescence spectra of 1 (6.0 μM) upon titration with Bu4N+F- in
MeCN. Excitation wavelengths were (a) 346 and (b) 400 nm, respectively. Inset: excitation spectra (normalized) monitored at 385 (solid line) and 470 nm (dashed line)
Figure 1-22. Fluorescence spectra of a 9 nm thick PBPOSS film upon exposure to
TNT vapor for different times. From top to bottom, the exposure time was 0, 10, 30, 60, 120, 180 and 300 s, respectively. Inset: plot of quenching efficiency (%) versus
Chapter 2 Motivation
POSS molecules can be regarded as core-shell colloids with solvated alkyl or aryl shells to disperse insoluble siloxane cores in solvents.11-24 Thus, the solvent effect plays an important role in the crystallization of POSS colloids. As reported, the X-ray diffraction patterns (XRD) revealed that the dimension ratios (c/a) of hexagonal unit cells for POSS crystals measured around 1.06, quite smaller than the theoretical ratio of 1.63 for a hexagonal closed packing model of hard spheres. These results of XRD studies indicated the extension of the lattice constant a between two adjacent POSS colloids on the basal plane of a unit cell and the compression of the lattice constant c between those in the c-axis direction of a unit cell. Our previous study suggested that such platelike hexagonal unit cells with the dimension ratios (c/a) of 1.06 can be arranged in a defined and a periodic manner to form crystalline POSS thin films.15-18 As a result, on the surface of a POSS crystal, the ordered pattern of “small holes” with the regular distance of the lattice constant a to one another is able to function as a template, similar to a egg rack, to disperse and allocate POSS derivatives such as POSS-protected Au nanoparticles.15 Consequently, it is a unique characteristic that POSS crystals can be used a template to self-assemble other functional molecules or nanoparticles on its surface through POSS-POSS recognition.
Pyrenyl chromophores have been widely used as photosensitive probes in detecting chemical analytes such as nitroaromatic compounds, oxygen, and biomolecules because the high-quantum-yield emissions of pyrenyl excimers, a short-lived dimer with the π-π stacking of two adjacent pyrenyl rings can be quickly quenched with these analytes through energy transfers.58-62 Many literatures reported on photoluminescence (PL) sensors using pyrenyl excimers in solution, but there are not a lot of studies using them in the thin films.80,86-87 The latter gives people a quicker
response than the former to detect toxic or explosive gases such as nitrobenzene and trinitrotoluene when these gases are exposed to the circumstances.However, it is still a challenge to develop a method of spreading these pyrenyl chromophores on a given substrate. As is well known, spin-coating is one of the most convenient techniques to fabricate such a photoluminescent thin-film. Unfortunately, the spin-coating pyrenyl film shows only a weak excimer emission due to a random packing of pyrene rings at a rapid rate of solvent evaporation in addition to large loss of sample solutions.61,88 Therefore, Fujiwara et al60,88 synthesized a carboxylic acid-functional pyrenyl derivative, associated with another through the intermolecular hydrogen bond to form the dimer-like structure with strong visible emission for application of sensing oxygen. However, these network structures composed with physically intermolecular hydrogen bonds can retarded the diffusion of the analytes with large molecular sizes such as trinitrotoluene, TNT, resulting in the relatively low response rate of the excimer quenching for these compounds. Consequently, the perfect microstructure for these PL sensors is to disperse these pyrenyl chromophores on a given substrate or template as thin as possible.
Recently, many literatures reported that the aggregations through π-π stacking of conjugated PL units could be effectively inhibited by physically blending or chemically grafting with bulky POSS nanoparticles in the application of the high-performance active layers of organic molecular and polymeric light-emitting diode devices (OLED89-95 and PLED96-103). As reported,81 pyrene-monofunctional isobutyl-POSS (Py-POSS) was successfully synthesized by Bai et al and its spin-coating films showed the rapid fluorescent response to the detection of explosive TNT vapor. Unfortunately, they didn’t study the effect of the unique POSS crystal structure on the PL sensors. Herein, bispyrenyl-monofunctional isobutyl-POSS (BPy-POSS) was synthesized and characterized. As the chemical structure shown in
Figure 2-1a, we expect that BPy-POSS has a thermodynamically driven tendency to
form an intramolecular excimer, the close form of butterfly-like microstructure, through the free rotation of two ether bonds. So, excimer conformation is more easily produced by intramolecular ether bonds than that by intermolecular hydrogen bonds between two carboxylic acid-functional pyrenes. In addition, we blended BPy-POSS and inert isobutyl-POSS (i-Bu POSS) to give the template composed of crystal i-Bu POSS thin films and to disperse BPy-POSS on its surface small holes (Figure 2-1b).
i‐Bu POSS
template
BP‐POSS
excimers
(a)
(b)
Figure 2-1. (a) Open and close forms of BPy-POSS microstructure, (b) thin film of
Chapter 3 Experimental Section 3.1 Materials 1
.
1-pyrenemethanol Aldrich, 98% MW: 232.28 g/mol CAS: 24463-15-82. 3-Chloro-2-chloromethyl-1-propene (methallyl dichloride) ACROS, 99%
MW: 125 g/mol, d=1.08 g/ml CAS: 1871-57-4
Cl Cl
3. Potassium hydride
ACROS, 25-35 wt. %, dispersion in mineral oil MW: 40.11 g/mol CAS: 7693-26-7 4. Trichlorosilane Aldrich, 99% MW: 135.45 g/mol, d=1.342 g/ml CAS: 10025-78-2
5. Trisilanolisobutyl POSS® Hybrid Plastics MW: 791.41 g/mol O Si O Si O Si O Si O Si O Si OH OH Si O O O OH R R R R R R R R=isobutyl group 6. Triethylamine TEDIA, >99% MW: 101.19 g/mol, d=0.726 g/ml CAS: 121-44-8
N
7. Platinum(0)-1, 3-divinyl-1,1,3,3-tetramethyldisiloxane complex solution [Pt(dvs)] in xylene (Pt ~2%)
Aldrich
MW: 381.48 g/mol, d=0.855 g/ml CAS: 68478-92-2
8. Octa isobutyl-POSS (i-Bu POSS) Hybrid Plastics MW: 873.59 g/mol O Si O Si O Si O Si O Si O Si O O Si O O O O R R R R R R R R Si R=isobutyl group 9. Tetrahydrofuran TEDIA, 99.8%
MW: 72.11 g/mol, d = 0.886 g/ml, boiling point: 65~67 °C CAS: 109-99-9
O
10. Toluene TEDIA, 99.5% MW: 92.14 g/mol, d=0.865 g/ml CAS: 203-625-9 11. Calcium Hydride ACROS, 99% MW: 42.09 g/mol CAS: 7789-78-83.2 Purification of Solvents 3.2.1 THF
Potassium hydride dispersion in mineral oil (30%) was put in a dry round bottomed flask under Argon atmosphere; hexane was added and stirred for 10 minutes to dissolve the mineral oil. After stated for a while, the liquid was sucked by syringe and thrown away. Repeat this process three times, the residual were dried by the vacuum pump to ensure that there’s no mineral oil and hexane remained. THF was added via syringe and stirred for 12 hours under Argon atmosphere. After completely mixed, THF was distilled at 80 °C.
3.2.2 Toluene
Toluene, calcium hydride and a magnetic stirrer were placed in a dry round bottomed flask under Argon atmosphere; after stirred for 12 hours, toluene was distilled at 110 °C.
3.3 Synthesis of Hydride-monofunctional Isobutyl-POSS (Si-H iBu-POSS)
Hydride-monofunctional isobutyl-POSS (Si-H iBu-POSS) was synthesized by sol-gel reaction between trisilanolisobutyl POSS® and trichlorosilane (HSiCl3) in
anhydrous THF using triethylamine (TEA) to capture HCl in form of an ammonium salt (Scheme 2-1a). Under Argon atmosphere, Si-H iBu-POSS was obtained by adding a slight excess of HSiCl3 (1.21 ml, 12 mmol) to a 1-liter flask containing
TriSilanolIsobutyl POSS® (7.91 g, 10 mmol), TEA (5.01 ml, 36 mmol) and 800ml anhydrous THF. The reaction flask was stirred under Argon for 12 hours, followed by filtration to remove the HNEt3Cl salts. Si-H iBu-POSS was purified by precipitation
from excess ethanol. The 87% yield of Si-H iBu-POSS (11.6 g, 8.7 mmol) was isolated after vacuum drying. Proton nuclear magnetic resonance (1H NMR) (δ, CDCl3): 0.61 (m, 14H, SiCH2), 0.97 (m, 42H, CH3), 4.11 (s, 1H, SiH).
3.4 Synthesis of Vinyl-functional Bispyrene (V-BPy)
The vinyl-functional bispyrene (V-BPy) was prepared by etherification reaction of an excess of 1-pyrenemethanol (Py-OH) with methallyl dichloride in anhydrous THF using a strong base of potassium hydride (KH) (Scheme 2-1b). Dry KH (0.43 g, 10mmol, purification by washing with hexane), Py-OH (2.2 g, 9.5 mmol) and freshly distilled THF (30 ml) were placed in a dry round bottomed flask under Argon atmosphere. At room temperature, methallyl dichloride (0.37 ml, 3.2 mmol) was added to the flask with mixture drop by drop. The mixture was stirred at room temperature for 15 min and stirred at 65 °C for 12 hours. After cooling to room temperature, the reaction mixture was quenched by water and extracted with dichloromethane. The organic layer then dried over anhydrous MgSO4 and the solvent
was removed under vacuum. Purification of the residue by flash column chromatography on silica gel with the same amount of hexane and dichloromethane and yielded 1.32 g of the V-BPy solid (80% yield). 1H NMR (δ, CDCl3): 4.21 (s, 4H,
3.5 Synthesis of Bispyrene-monofunctional isobutyl-POSS (BPy-POSS)
The bispyrene-monofunctional isobutyl-POSS (BPy-POSS) was prepared by hydrosilylation reaction of an excess of vinyl-functional bispyrene (V-BPy) with hydride-monofunctional isobutyl-POSS (Si-H iBu-POSS) in anhydrous toluene at 60 °C using a platinum(0) catalyst [Pt(dvs)] (Scheme 2-1b).9,104-105 A solution of Si-H iBu-POSS (2.5 g, 3 mmol) and V-BPy (15.5g, 30mmol) in toluene (60 mL) in a 100-mL Schlenk flask equipped with a reflux condenser and a magnetic stirrer was heated at 60 °C under argon and then Pt(dvs) (0.2 ml, 0.4 μmol) was added via syringe. The reaction, which was monitored by measuring the decrease in intensity of the FT-IR spectra signal at 2134 cm–1 for the Si-H bonds, was complete after 24 hours. The yellowish, transparent reaction mixture became clear after removal of the Pt(dvs) catalyst through flash chromatography (neutral Al2O3; toluene). The crude product
was purified by flash column chromatography on silica gel with hexanes-ethyl acetate (EA: Hexane=1: 8) to yield BPy-POSS (2.5 g, 62%). 1H NMR (δ, CDCl3): 0.61 (s,
16H, SiCH2), 0.95 (s, 42H, CH3), 1.86 (m, 8H, SiCH2CH), 3.66 (m, 4H, CHCH2O),
3.6 Preparation of i-Bu POSS and BPy-POSS blends
BPy-POSS (0.5 mg) and i-Bu POSS (9.5 mg) were dissolved in 1 ml solvent to fabricate the 5 wt% BPy-POSS/ i-Bu POSS blend solution; BPy-POSS (2 mg) and i-Bu POSS (8 mg) were dissolved in 1ml solvent to make the 20 wt% BPy-POSS/ i-Bu POSS blend solution. The blend solutions were stirred for 2 hours then the solvent was removed by rotary evaporator. To avoid the residual solvent remained, the samples were put into the vacuum oven for 1 day.
3.7 Characterization 3.7.1 NMR Spectroscopy
1H NMR solution spectra were obtained using Varian Unity 300Hz instrument;
d-chloroform was the solvent. High-resolution solid-state 29Si NMR spectroscopy experiments were performed at 25 °C using a Bruker DSX-400 spectrometer operating at a resonance frequency of 79.375 MHz. High-resolution solid state 29Si NMR spectra were acquired with a 90 °C pulse width of 5 μs, a pulse delay time of 2 s, and with the spin rate of 6500Hz. The total range of 29Si is from 231.99 ppm to -292.939 ppm.
3.7.2 Matrix-Assisted Laser Desorption Inoization-Time of Flight Mass Spectrometry (MALDI-TOF MS)
A Mass spectrum was obtained using a Bruker Daltonics Autoflex Ⅲ TOF-TOF mass spectrometer. The following voltage parameters were employed: ion source 1, 19.06 kV; ion source 2, 16.61 kV; lens, 8.78 kV; reflector 1, 21.08 kV; reflector 2, 9.73 kV. The laser power was set to 45 % with a frequency of 10 Hz, while the mass spectrum was collect from 300 shots. The α-cyano-4-hydroxycinnamic acid (CHCA) was premixed in 33.3% acetonitrile solution to make the matrix solution. The BPy-POSS was mixed with matrix solution at the ratio 1:1. The AgNO3 was added for
the purpose of ionization of BPy-POSS to become BPy-POSS/ Ag+ complex. Then the sample was submitted to analysis with MALDI-TOF.
3.7.3 Differential Scanning Calorimetry (DSC)
Thermal analysis was performed with a differential scanning calorimeter from
DuPont (DSC-Q20) with a heating rate of 10 °C/min, a cooling rate of 5 °C /min and a temperature range of -90-200 °C. Temperature and energy calibrations were carried
out with indium. The measurements were made with a 5-10 mg sample in a DSC sample cell; in first scan, the sample was heated from room temperature to 200 °C, after the first heating run, the samples were then cooled to -90 °C and heat again to 200 °C to examine the temperature of glass transition (Tg) and the other transition
temperatures.
3.7.4 Thermal Gravimetric Analysis (TGA)
Thermal Gravimetric Analysis (TGA) is a simple analytical technique that
measures the weight loss (or weight gain) of a material as a function of temperature. The weight loss over specific temperature range indicate the decomposition of the sample, thermal stability and absorbed moisture content, etc. After the sample treatment, various concentration of BPy-POSS/ i-Bu POSS samples were recorded using a TGA-Q50 (TA, USA) over a temperature range of 50-750 °C in a inert atmosphere, at a heating rate of 10 °C/min.
3.7.5 Ultraviolet-Visible spectroscopy (UV-Vis)
UV-Vis absorption spectroscopy is the measurement of the attenuation of a beam
light after it passes through a sample or after it reflects from a sample surface. Both the shape of the peak(s) and the wavelength of maximum absorbance (λmax) give
information about the structure of the compound. The sample solutions were put in the quartz holder and the sample films should be coated on quartz glass. In our experiment, UV-Vis spectra were measured using an HP 8453 diode-array spectrophotometer.
3.7.6 Photoluminescence Spectroscopy (PL)
sample film or solution. PL spectra were obtained using a Hitachi F-4500 luminescence spectrometer. The sample solutions were put in the quartz holder and the sample films should be coated on quartz glass. Then the spectrophotometer emitted a source light to excite the sample; the wavelength of the source light was determined by the UV absorption of samples. We used toluene and dichloromethane as the solvent.
3.7.7 X-Ray Powder Diffraction (XRD)
X-ray powder diffraction (XRD) is a rapid analytical technique used for phase
identification of a crystalline material and can provide information on unit cell dimensions. The techniques are based on observing the scattered intensity of an X-ray beam hitting a sample as a function of incident and scattered angle. The sample solutions we had prepared in toluene were dropped on a cleaned wafer surface, after solvent evaporating, we put the wafer into the XRD sample holder. The XRD patterns were collected using a D8 Advance Powder X-ray diffractometer (Cu Kα, 40 kV/ 40 mA; Bruker, Germany). The scanning rate was 0.6 °/min from 2θ =5 ° to 30 °. Data were collected and plotted as intensity versus 2θ.
3.7.8 Confocal Microscopy
Confocal microscopy is an optical imaging technique used to increase micrograph
contrast and/or to reconstruct three-dimensional images by using a spatial pinhole to eliminate out-of-focus light or flare in specimens that are thicker than the focal plane. The entire specimen is flooded in light from a light source. Due to the conservation of light intensity transportation, all parts of the specimen throughout the optical path will be excited and the fluorescence detected by a photodetector or a camera. We used the
Leica TCS SP5 Confocal Spectral Microscope Imaging System in NTU, the excited light source is 100 mW Ar blue lasers; the fluorescence microscopy is Leica DMI 6000B CS.
One drop of dilute toluene solutions (10 mg/ml of BPy-POSS/ i-Bu POSS blends solution) was placed onto a glass, and then air-dried at 25 °C.
3.7.9 Atomic Force Microscopy (AFM)
The Atomic Force Microscopy (AFM) is a very high-resolution type of scanning
probe microscope, with demonstrated resolution of fractions of a nanometer, The AFM consists of a microscale cantilever with a sharp tip (probe) at its end that is used to scan the specimen surface. The Atomic Force Microscopy (AFM) employed in this study is a Digital Instruments Veeco Dimension 5000 Scanning Probe Microscope (Veeco Metrology Group). The AFM tapping mode with a 5-10 nm radius silicon tip was used to scan the surface structure, the displacement resolution of AFM is about 0.1 nm. One drop of dilute toluene solutions (10 mg/ml of BPy-POSS/ i-Bu POSS blends solution) was placed onto a wafer, and then air-dried at 25 °C.
3.7.10 Transmission Electron Microscopy (TEM)
Transmission electron microscopy (TEM) is a microscopy technique that a beam of
electrons is transmitted through ultrathin specimen, interacting with the specimen as it passes through. An image is formed from the interaction of the electrons transmitted through the specimen; the image is magnified and focused onto an imaging device, such as a fluorescent screen. The dark areas of the image correspond to areas on the specimen where fewer electrons were able to pass through; the lighter areas are where more electrons did pass through.
were prepared using a Leica Ulatracut UCU microtome equipped with a diamond knife. Slices of ca. 700 Å thicknesses were cut at room temperature and then the samples were transferred onto the carbon-coated Cu TEM grid. The samples weren’t stained.
TEM analysis was performed using a Hitachi H-7500 electron microscope operated at 100 kV.
3.7.11 Dynamic Light Scattering (DLS)
The hydrodynamic diameter, Dh, of the BPy-POSS and i-Bu POSS solution (in
toluene) was measured by dynamic light scattering (DLS).
DLS measurements were performed on Brookheaven 90 plus model equipment (Brookheaven Instruments Corporation, USA) with a He-Ne laser with a power of 35 mW at 632.8 nm. The temperature was controlled at 25 °C, and the measurements were done at an angle of 90 °. All the solutions have been filtered before DLS measurements.
Chapter 4 Results and discussion 4-1 Synthesis of BPy-POSS
The procedure of hydrolytic condensation of monofunctional trichlorosilane in aqueous acetone for synthesis of incompletely condensed trisilanol alkyl-POSS (T7-POSS) has been described by Feher et al. and Schmid et al.107-108 An efficient method for preparing such monofunctional POSS with full condensed siloxane-oxygen frameworks involves the corner-capping of T7-POSS with a variety of trichlorosilane coupling agents. Thus, Si-H iBu-POSS was prepared by condensation of trisilanolisobutyl POSS® with trichlorosilane, providing BPy-POSS by followed hydrosilylation with V-BPy. Due to the commercial T7-POSS with a small amount of completely condensed isobutyl POSS, trisilanolisobutyl POSS® can be purified by hydrogen bonding-driven dissolving in anhydrous ethanol before condensation with trichlorosilane. In comparison with Figures 4-1a and Figure 4-1b, the hydrosilane (Si-H, peak d) signal at 4.11 ppm was observed in the product of Si-H iBu-POSS by 1H NMR spectra. V-BPy was synthesized by etherification of methallyl dichloride and Py-OH using KH in anhydrous THF. Thus, the shift from peak f to f’ and the signals of ether (peak g at 4.26 ppm) and vinyl groups (peak h at 5.35 ppm) are detected for V-BPy by 1H NMR spectra (Figures 4-1c and Figure 4-1d) result from the formation of a ether linkage between methallyl dichloride and Py-OH. The desired product of BPy-POSSwas obtained by the followed hydrosilylation of V-BPy with Si-H iBu-POSS. Herein, only β-form of hydrosilylated linkage was confirmed according to peak i at 2.34 ppm in Figure 4-1e. In 29Si NMR spectra, only one peak was observed; this also indicated that there’s only β-form formation during hydrosilylation (Figure 4-2). The only β-addition product was also obtained by hydrosilylation between silane-monofunctional cyclopentyl or cyclohexyl POSS and
vinyltrimethylsilane.22 Shockey et al. indicated that the silane functionality might be sterically inaccessible since it is attached directly to the silicon-oxygen framework of the POSS cage and could therefore be shielded by the adjacent cyclic alkyl groups.22 In our study, two bulky pyrene rings also play an important role in the sterically favorable β-addition product. In MALDI-TOF mass spectrum, the monodispersity at 1441.40 g/mol of BPy-POSS Ag+-complex can be detected (Figure 4-3) in agreement with the theoretical value of 1441.37 g/mol.81,90-91,94-95
10
9
8
7
6
5
4
3
2
1
0
O O Py Py g' f" a POSS ii
O O Py Py g f' h OH Py f e H d POSSe
g'
f''
h
g
f'
f
d
H
2O
CD 3Clc
b
a
i-Bu:
POSS
a
b
c
(e) BPy-POSS
(d) V-BPy
(c) Py-OH
(b) Si-H iBu-POSS
(a) trisilanolisobutyl POSS
Chemical Shift (ppm)
Figure 4-1. 1H NMR spectra of (a) trisilanolisobutyl POSS, (b) Si-H iBu-POSS, (c)
-300 -200 -100 0 100 200 0.00E+000 1.00E+008 2.00E+008 3.00E+008 4.00E+008 5.00E+008 In te ns it y chemical shift (ppm)
Figure 4-2. 29Si NMR spectra of BPy-POSS.
1200 1500 1800 2100 2400 2700 3000 0 500 1000 1500 2000 2500 3000 1441.401 O Si O Si O Si O Si O S i O S i O S i O Si i-Bu i-Bu i-Bu i-Bu i-Bu i-Bu i-Bu O O O O O O Ag+
Chemical Formula: C66H92AgO14Si8+
Ex act Mas s: 14 39.37 Th eoretic al m/z: 1 441.37 (1 00.0% )
int
e
nsit
y
m/Z
4.2 Character of BPy-POSS 4.2.1 Thermal properties
The thermal decomposition temperature (Td) is 307.90 °C using thermal
gravimetric analysis (TGA). Other thermal properties are determined by differential scanning calorimeter (DSC). Highly symmetric T8-POSSes with alkyl chains on a siloxane cube can form a molecule-like crystal.14 To compare with crystal i-Bu POSS (Tm at 56.0 °C) and amorphous V-BPy (Tg at 14.6 °C), the product of β-hydrosilylated
BPy-POSS was a semicrystal solid with crystal POSS domains and amorphous bispyrenyl domains, corresponding to temperatures of glass transition (Tg),
recyrstallization (Tc), and melting (Tm) at 14.2, 62.7, and 127.7 °C in Figure 4-4. In
cooling process, the BPy-POSS can not crystallize perfectly because of the steric hindrance of bispyrenyl group. When heating again beyond the Tg of BPy-POSS, it
will rearrange and result in a recrystallization peak. It is notable that the two pyrene rings hinder BPy-POSS from crystallization of POSS moiety, resulting in a higher, polymer-like, broad melting point at 127.7 °C.
-50
-25
0
25
50
75
100 125 150 175 200
T
m= 127.7
oC
T
c= 62.7
oC
T
g= 14.2
oC
T
g= 14.6
oC
T
m= 56.0
oC
(c) BPy-POSS (b) V-BPy(a) i-Bu POSS
Heat flow (exothermal upper)
Temperature (
oC)
Figure 4-4. DSC thermograms of (a) i-Bu POSS, (b) V-BPy, and (c) BPy-POSS.
4.2.2 Transmission Electronic Microscopy (TEM)
The typical TEM image of the ultra-thin film of BPy-POSS shows about 3-5
nm-width dark fibers of POSS-moiety crystal regions in Figure 4-5 by electron scattering on silicon atoms.17-18,24 Herein, the crystal fractal morphology can be observed in TEM image, indicating that BPy-POSS is a semi-crystal material, which is consistent with the DSC data.
500 nm
Figure 4-5. Bright-field TEM micrograph for a thin section of BPy-POSS without
stained.
4.2.3 UV-Vis and PL Spectroscopy
The chemical structures of V-BPy and BPy-POSS are similar to butterflies. The
flexible ether linkages between pyrene rings and POSS moiety result in two conformational isomers of enthalpy-favor close form and entropy-favor open form as shown in Figure 2-1. For UV-Vis and PL spectroscopic studies, the uniform and transparent thin films of Py-OH, V-BPy and BPy-POSS were fabricated through spin coating process.
Before investigating the role of the pyrene in the photoluminescent analyses, we need to analyze the effect of the discrepancy between chemical structures of Py-OH, V-BPy, and BPy-POSS have little effect upon the UV-absorbance of pyrene functional groups. As shown in Figure 4-6, the UV-Vis absorption spectra of the
V-BPy and BPy-POSS in dilute solution (dichloromethane, 10-5 M) are very similar to that of Py-OH. These peaks at 313.4, 327.6, and 344.0 nm indicate that there is coupling of the vibronic features corresponding to the transitions from ν=0 to ν’= 0, 1, 2, where ν and ν’ are the quantum vibrational numbers of the ground and excited states, respectively.67 The photoluminescent spectra of dichloromethane solutions (10-5 M) of Py-OH, V-BPy, and BPy-POSS excited by light source with wavelength of 343 nm are shown in Figure 4-7. The spectra of the Py-OH monomers without excimer emission (470.7 nm) showing two strong sharp bands at 378.8 and 398.0 nm and two additional shoulder bands at 416.5 and 446.8 nm are almost the same as those of monofunctional pyrene because it is well-dispersed within solvent.81,67,108 The spectrum of the bispyrenyl V-BPy solution shows the enthalpy-favor result with two relatively weak emission bands of pyrene monomers (open form) at 378.8 and 398.0 nm similar to Py-OH and exhibits a strong typical excimer emission (close form) at 470.7 nm.62,81,67,108-109 The emission intensity ratio of the excimer band to the monomer band (I470.7/I378.8) was calculated to be about 5.2. It is notable that the
excimer emission of V-BPy close forms results from intramolecular pyrene-pyrene stacking (π-π interaction) through the thermal rotation of flexible ether linkages. In contrast, the spectrum of the BPy-POSS solution shows result of two relatively strong emission bands of pyrene monomers at 385.5 and 404.2 nm which are red-shifted about 6.5 nm from that of Py-OH or V-BPy because of the effect of POSS moiety, and additionally exhibits a medium typical excimer emission at 470.7 nm.62,81,67,108-109 The emission intensity ratio of the excimer band to the monomer band (I470.7/I385.5)
was reduced to be about 0.63. Kim et al108 indicated that as the size of the aggregate of pyrene-monofunctional compounds increased, the emission shifted toward the higher wavelengths in accordance with the previous experimental and theoretical works that face-to-face stacking interactions in aromatic π-systems resulted in an
increase in the intensity of the transitions and in turn led to a red shift of photoluminescence spectra.110-111 Herein, colloidal POSS moieties tend to dynamic aggregation,inducing the change in the photoluminescencespectra that conformation isomers with excimer at 470.7 nm, monomer emission at 385.5 and 404.2 nm. The monomer emission of BPy-POSS came along with the intermolecular excimer due to the steric hindrance arising from the aggregation of bulk POSS moieties, which can be observed by DLS. One BPy-POSS possesses two pyrene rings; when one pyrene ring associates with a pyrene ring of other BPy-POSS, the other pyrene ring could be steric hindered then they can not have inter- and intra- associated with other pyrene rings, thus the monomer emission of PL spectra was observed at 385.5 and 404.2 nm.
Figure 4-8 illustrates PL spectra of thin films of V-BPy and BPy-POSS were
annealed at 150 °C. In the spectrum of annealed V-BPy thin film, the monomer emission at 396.5, 418.9 and 444.7 nm appeared due to ether bond rotation; and there are still a strong excimer emissions at 473.7 nm and 500.3 nm. In the spectrum of annealed BPy-POSS thin film, the shape remains as the same as pristine thin film does, indicating that the POSS moiety hindered the rotation of ether bond and the packing of BPy-POSS is stable.