INTRODUCTION
Examination of the ratios of strontium (Sr) to calcium (Ca) along otolith transects has revealed much com-plexity in the history of anguillid eel migration be-tween marine/estuarine and freshwaters (reviewed by Daverat et al. 2006). Anguillid eel growth rates are typically higher in marine habitats than in freshwater habitats, and for inter-habitat migrants the proportion of time spent in marine/estuarine waters is reflected in their average growth rate (Morrison et al. 2003, Tzeng et al. 2003, Jessop et al. 2004, 2006). More
generally, diadromous species of a given genus tend to have higher growth rates than do freshwater species of the genus (Gross 1987), with anadromous species generally more prevalent at temperate latitudes and catadromous species at tropical latitudes (McDowall 1987).
Few studies of Anguilla have estimated the propor-tion of time juvenile inter-habitat migrants are resident in freshwater or estuarine/marine habitats (Jessop et al. 2002, 2004) or examined the frequency or duration of migratory episodes (Daverat et al. 2006, Jessop et al. 2006, Lamson et al. 2006). By definition, otolith growth
© Inter-Research 2007 · www.int-res.com *Email: jessopb@mar.dfo-mpo.gc.ca
Effects of inter-habitat migration on
the evaluation of growth rate and habitat residence
of American eels
Anguilla rostrata
B. M. Jessop
1,*, J. C. Shiao
2, Y. Iizuka
3, W. N. Tzeng
41Department of Fisheries and Oceans, Bedford Institute of Oceanography, PO Box 1006, Dartmouth, Nova Scotia B2Y 4A2, Canada 2Institute of Oceanography, and 4Institute of Fisheries Sciences, College of Life Science, National Taiwan University,
Taipei, Taiwan 10617, ROC
3Institute of Earth Sciences, Academia Sinica, Nankang, Taipei, Taiwan 11529, ROC
ABSTRACT: The use of Sr:Ca ratios in fish otoliths to reconstruct historical patterns of fish movement between aquatic habitats of different salinity ranges (fresh, estuarine, marine) can be extended to evaluate the frequency and duration of inter-habitat movements. However, the proportion of otolith growth in a habitat does not necessarily equal the proportion of time spent in that habitat and depends on the difference between otolith growth rates within each habitat. For inter-habitat migrant yellow American eels Anguilla rostrata from the East River, Nova Scotia, the mean proportion of res-idence time in freshwater slightly (2.9%), but significantly, exceeded the proportion of otolith growth in freshwater, but the magnitude of the effect was small and perhaps of little practical consequence. Although the observed effect magnitude was small, where large differences in otolith growth rates occur among habitats or with ontogeny, habitat-specific growth rates should be considered for detailed examinations of inter-habitat migration and residency. A simple habitat residence model provides results consistent with the observed data. For inter-habitat migrants, the mean difference between 2 possible methods of estimating the proportion of fish growth in freshwater from micro-probe otolith Sr:Ca ratio transects was small (2.2%). Singleton outliers of eel otolith Sr:Ca ratios may create difficulties in evaluating the frequency and duration of inter-habitat movements that remain to be resolved.
KEY WORDS: Anguilla rostrata⋅ American eel ⋅ Strontium:calcium ratios ⋅ Otolith growth period ⋅ Habitat residency period
period and habitat residency period are equivalent for fishes that reside entirely in either a marine/estuarine or freshwater habitat. For inter-habitat migrants of diadromous and amphidromous species, the otolith growth and habitat residence periods might be esti-mated as the proportions on the growth and time scales of a transect from otolith core to edge with Sr:Ca values greater than or less than the criterion value for separating marine/estuarine habitat from freshwater habitat (e.g. Jessop et al. 2004). However, if otolith growth rate varies among habitats, then a given tran-sect proportion will not reflect the time spent in each habitat (Jessop et al. 2006). The degree of difference between the proportions of time and growth in a habi-tat depends on the relative difference in otolith growth rates between habitats. To extend the interpretation of element ratio or isotope patterns along an otolith tran-sect to more detailed examination of temporal patterns of residence and movement, the issue of relative otolith growth rate among habitats must be considered.
This study evaluates whether, for American eels Anguilla rostrata migrating between habitats, mea-surements of the proportion of otolith growth along a transect with Sr:Ca values above or below a defined habitat transition value can be considered functionally equivalent to the proportion of residence time in a given habitat. We examine: (1) the inter-habitat migra-tory activity of juvenile (yellow-phase) eels with respect to time and otolith growth, (2) evaluate the dif-ference between the proportion of otolith growth and proportion of time spent (residency period) in marine/ estuarine and freshwater habitats, and (3) compare the observed habitat residence/growth period data with the results of a simple habitat residency model.
MATERIALS AND METHODS
Study area. The East River (latitude 44° 35’ 16’’ N) along the Atlantic coast of Nova Scotia drains a water-shed of 134 km2. A small falls (0.6 m) at the river mouth
creates a sharp transition between river and estuary. The Sr:Ca ratio of the river water was measured as 5.6× 10– 3(wt%, equivalent to 2.5 × 10– 3molar ratio) at
a site 1.3 km upstream of the river mouth, and 4.1 × 10– 3(wt%, equivalent to 1.9 × 10– 3molar ratio) at a site
further upstream (Jessop et al. 2002). Additional habi-tat details and maps of the watershed can be found in Jessop (2000) and Jessop et al. (2006).
In Mahone Bay, about 2 km from the river mouth, the salinity varies seasonally and with depth from ~27 to 31.5 (M. Dadswell, Acadia University, Wolfville, Nova Scotia, pers. comm.). Water temperatures in the East River estuary are about –1 to 2°C during winter, rising to about 18 to 20°C during the summer, but are often in
the range of 12 to 17°C. The estuary is well mixed, with a maximum tidal range of ~2 m and an average range of 1.5 m. The freshwater–saltwater mixing pattern in the estuary is unknown, but its extent is governed by seasonal freshwater discharges that range, for exam-ple, between about 0.5 and 4.8 m3 s–1 between late
May and late September (Jessop 2000).
Data collection and treatment.Yellow (juvenile) eels Anguilla rostrata (N = 107) were collected by electro-fishing on 17 July 2001 from 5 sites at various distances upstream from the river mouth. Details of the sample collection and treatment, otolith preparation, Sr and Ca measurement by electron microprobe, and otolith ageing and measurement procedures are described in Jessop et al. (2006). Based on the pattern of Sr:Ca val-ues between the elver check and final annulus, 45 yel-low eels remained in freshwater after initial freshwater entrance and were not used in further analysis. Of the 62 yellow eels that exhibited varying degrees of inter-habitat movement, 5 were unusable due to the signifi-cant non-coincidence of the age measurement and Sr:Ca transects, leaving 57 eels for analysis (mean length = 277.7 mm, SD = 59.30, range = 179 to 443 mm; mean weight = 42.1 g, SD = 30.62, range = 9.9 to 168.5 g; mean age = 10.4 yr, SD = 3.65, range = 5 to 20 yr).
Small measurement differences, usually < 3% of the otolith radius (μm), between the Sr:Ca transect length and age transect length were common, perhaps due to the Sr:Ca transect ending just short of the otolith edge or to imprecision in matching Sr:Ca and age transects. When the age transect length exceeded the Sr:Ca tran-sect length and the Sr:Ca values were all ≤4.0 × 10– 3for
several years, any unmeasured Sr:Ca values were assumed also to have been ≤4.0 × 10– 3. When the Sr:Ca
transect length exceeded the age transect length (3 cases), the Sr:Ca transect length was re-scaled to the age radius.
The temporal pattern of otolith Sr:Ca values along a transect was used to evaluate the environmental his-tory of each eel, under the assumption that the tempo-ral pattern of Sr:Ca reflects the habitat salinity (Kraus & Secor 2004, Daverat et al. 2005). Ratios (wt%) of Sr:Ca ≤4.0 × 10– 3were considered to indicate
freshwa-ter residence, and values > 4.0 × 10– 3, to indicate estu-arine or mestu-arine residence (Jessop et al. 2004, 2006).
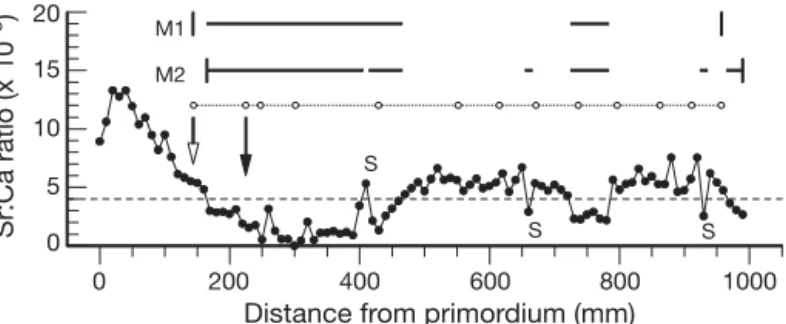
Freshwater otolith growth estimation.Two methods were used to estimate the proportion (converted to percentage, as necessary) of freshwater otolith growth (%fwg), the remainder being estuarine/marine growth. Method 1, used to estimate the %fwg for this analysis differs from that used by Jessop et al. (2004, 2006), which is termed Method 2. Method 1 estimated %fwg for eels that first entered freshwater as either elvers or juveniles as the percentage of Sr:Ca values
≤4.0 × 10– 3between the elver check and the last
annu-lus, but not including singletons (Table 1, Fig. 1). Method 2 estimated %fwg for eels that first entered freshwater as elvers as the percentage of Sr:Ca values ≤4.0 × 10– 3
between the first pair of Sr:Ca values ≤4.0 × 10– 3and the otolith edge, while for eels that entered
freshwater as juveniles, the start position was the elver check. Basically, the migration groups, as defined in Jessop et al. (2004, 2006) consisted of eels that entered freshwater as elvers and those that entered as juve-niles (≥1 yr old) and subsequently engaged in inter-habitat migration or remained totally freshwater resi-dent.
A singleton is a single Sr:Ca value > 4.0 × 10– 3
departing from a freshwater norm (< 4.0 × 10– 3) or a
value < 4.0 × 10– 3departing from a saline water norm
(> 4.0 × 10– 3) (Fig. 1). If singleton otolith Sr:Ca values
are assumed to represent a habitat transition, their prevalence and magnitude affect the interpretation of the frequency and duration of inter-habitat movements and the cumulative growth and residence in a given habitat. The residence period represented by singleton Sr:Ca values was estimated for a representative sam-ple of 10 singletons from 4 eels with values more than ±1 × 10– 3from the habitat transition constant.
Freshwater residency period estimation. Freshwa-ter habitat residency period was calculated as the sum of segments of freshwater otolith growth (μm) as applied to the time scale (yr). Growth segments within each habitat were defined by the points where the line (slope) connecting adjacent Sr:Ca values crossed the 4.0 × 10– 3x-axis habitat transition value, as estimated
by linear regression between the adjacent Sr:Ca val-ues. Segments of freshwater Sr:Ca values were summed over the growth and time scales (time was estimated annually to account for differences in annual growth rate) and converted to proportions of the total transect for growth and time. The last annulus was chosen as the end point for Method 1, because the Sr:Ca spot transect did not always extend precisely to the otolith edge and the distance to the edge repre-sents an uncertain time period. Measurements taken only to the last annulus represent full years, assuming
that the time between the elver check and first annulus represents approximately 1 yr and that, over the life of the eel, the distance between annuli represents 1 yr of growth on average. Formation of the elver check may shortly precede the entrance to freshwater (Michaud et al. 1988, Jessop et al. 2002), but is not dependent upon freshwater entrance (Jessop et al. 2006).
For comparison, data from 9 female silver eels from the East River (Jessop et al. 2004) were also examined so as to extend the freshwater residency range to lower values. Method 1 was used to evaluate freshwater otolith growth, and residency times were evaluated.
The significance of the mean difference between percent freshwater growth methods and between otolith growth and residence time was estimated by paired permutation test with 10 000 repetitions (Man-ley 1997), because the sample distributions of percent freshwater growth (converted to proportions) and pro-portions of otolith growth and residence time were negatively skewed and kurtotic, but sample variances were homogeneous (Levene’s test p ≥ 0.41). Confi-dence intervals (95% CI) for each mean difference were estimated by bootstrapping. The mean number of singleton Sr:Ca values less than (negative) or greater than (positive) 4 × 10– 3along a transect
was examined for significant difference by paired t-test. The mean numbers of both positive and negative singletons for eels grouped in 10% fwg incre-ments were examined by analysis of variance (ANOVA) followed by the Tukey multiple-comparison test. Statis-tical significance was accepted at α ≤ 0.05. Statistical significance does not necessarily imply biological impor-tance (Johnson 1999), so Hedge’s g, a Table 1. Anguilla rostrata. Differences between Methods 1 and 2 for estimating
the proportion of otolith growth in freshwater for yellow American eels
Method Freshwater Start Singletons End
entry group
1 Elver + juvenile Elver check Not included Last annulus
2 Elver First paira Included Otolith edge
2 Juvenile Elver check Included Otolith edge
aFrom first value of first pair of Sr:Ca values ≤4 × 10– 3
0 200 400 600 800 1000
Distance from primordium (mm) 0 5 10 15 20 Sr:Ca ratio (x 10 –3) M1 M2 S S S
Fig. 1.Anguilla rostrata. Comparison between Method 1 (M1, %fwg = 43.3) and Method 2 (M2, %fwg = 48.2) of the propor-tion of otolith growth in freshwater for an eel that entered freshwater as an elver. For Method 2, if the eel had entered freshwater as a juvenile (>1 yr old), measurement would begin at the elver check. The elver check is indicated by the open-head arrow, the first annulus by the filled-head arrow, Sr:Ca ratio values by filled circles, annuli by open circles and singleton Sr:Ca values by S. Horizontal dashed line: 4.0 × 10– 3
measure of effect size (standardised mean difference between treatment group), was calculated for the mean difference between percent freshwater growth methods and between otolith growth and residence time (Hedges & Olkin 1985) following arcsine transfor-mation of each variable. The correlation between vari-able pairs is high, and the sample standard deviations were used to calculate the pooled standard deviation for Hedge’s g because correction for the correlation overestimates the true effect size (Dunlop et al. 1996). The relation between the observed proportion of res-idence time in freshwater (y) and the proportion of otolith growth in freshwater (x) was fitted by a second-degree polynomial, and the fit of the model was evalu-ated by Mallows’ Cp(Mallows 1973). Centring the x
variable before use by subtracting its mean reduced to non-significance the collinearity between the un-squared and un-squared terms.
Habitat residence model. A simple ‘habitat resi-dency’ model that considers the effect of differing habitat growth rates on the estimation of habitat resi-dency times was compared with the observed relation-ship between the proportion of otolith growth in fresh-water and residency time in freshfresh-water based on measured values. If we assume linear relations between otolith and fish growth and between otolith (fish) growth rates occurring in fresh- and saltwater, then fish length-at-age would be:
Lt = fgt + (1 – f )Agt (1) where Ltis fish length at age t, f is the proportion of time spent in freshwater, g is the growth rate in fresh-water, A is a constant of proportionality between salt-and freshwater growth rates, salt-and A× g is the growth rate in saltwater. The proportion of total fish (otolith) growth in freshwater, measured by the proportion (P ) of ‘freshwater’ otolith Sr:Ca values, is the amount of fish (otolith) growth in freshwater (fgt ) divided by the total amount of fish (otolith) growth [fgt + (1 – f )Agt] or: (2) Given estimates of A and P, f can be estimated as
(3) An estimate of A (ratio of salt- to freshwater growth rates) for yellow eels was obtained from the ratio of the mean annual growth (g ), based on back-calculated lengths-at-age, of estuarine eels (< 50% fwg, n = 9, P = 0.35, g = 26.29 mm yr–1) and freshwater eels (100% fwg
estimated by Method 2, n = 43, P = 1.0, g = 22.03 mm yr–1; Jessop et al. 2006); thus, A = 26.29/22.03 = 1.19.
Other estimates of A can be derived from the mean annual growth rates estimated from the
back-calculated lengths-at-age for male and female silver eels from the East River, Chester. Thus, the mean annual growth rate of 21.8 mm yr–1for male silver eels
with largely (< 50% fwg) estuarine growth and 19.2 mm yr–1 with largely freshwater (> 50% fwg) growth gave an estimate of A = (21.8/19.2) = 1.14, while for female silver eels the estimate was A = (27.7/22.7) = 1.22 (Jessop et al. 2004). These are under-estimates of A to the extent that the saltwater compo-nent is not fully saltwater.
Values of f (proportion of time in freshwater) were calculated with the habitat residency model for values of P (proportion of growth in freshwater) ranging from 0 to 1.0 in increments of 0.05 and with A = 1.19. Model values of f were converted to percentages and com-pared with values of percent freshwater residency esti-mated from otolith measurements. The usefulness of the habitat residency model was evaluated by graphic comparison with a polynomial curve fitted to the otolith-based estimates of freshwater habitat residency period for individual eels.
RESULTS
Percent freshwater growth
Method 2 produced generally higher estimates than Method 1 of the percentage of otolith growth in An-guilla rostrata occurring in freshwater (Fig. 2). The mean difference between methods was statistically sig-nificant (n = 57, p = 0.0001) at 2.2% (95% CI = 1.22 to 3.20), with the measure of effect size, Hedge’s g = 0.16 (95% CI = 0.10 to 0.22). The greatest differences be-tween methods occurred for eels with intermediate per-centages of freshwater growth and large numbers of singleton Sr:Ca values. The variability about the 1:1 ref-erence line (represents equivalence between methods) depended on both the number of singleton Sr:Ca values and, for eels with otolith %fwg greater than about 90%, the degree of estuarine growth occurring between the elver check and freshwater entry (Figs. 1 & 2).
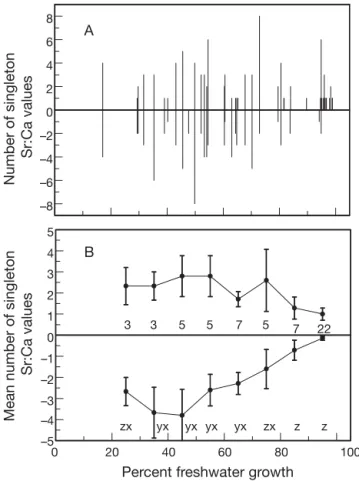
Singleton otolith Sr:Ca values occurred in 81% of inter-habitat migrants, but were most common in eels exhibiting intermediate (30 to 70%) levels of freshwa-ter growth (Fig. 3A). The mean number of singletons per fish was 3.2 (n = 57, SD = 3.22, range = 0 to 8), with no significant difference (t = 0.77, df = 112, p = 0.44) in the mean number of singletons indicating freshwater (< 4.0 × 10– 3) or estuarine (> 4.0 × 10– 3) incursion.
How-ever, when pooled in 10% fwg bins (so as to keep n ≥ 3) over the range 20 to 100% fwg, the mean number of positive singletons (> 4.0 × 10– 3) did not vary
signifi-cantly among bins (F = 1.49, df = 7, 49, p = 0.19), but the mean number of negative (< 4.0 × 10– 3) singletons did
f P P P = − + A A 1 P fgt fgt f gt f f f ( ) ( ) = + −1 A = + −1 A
vary significantly (F = 7.31, df = 7, 49, p < 0.001), being greatest at 40 to 49.9% fwg and decreasing with increasing %fwg (Fig. 3B). Singleton Sr:Ca values were usually isolated, but small clusters (2 to 3 spots) or closely spaced singletons fluctuating across the habitat transition constant occurred infrequently. The number of Sr:Ca singletons decreased with increasing magni-tude of the Sr:Ca value (Table 2).
The duration of the residence period in the minority habitat depends upon the growth rate over the given otolith growth increment. Assuming that singleton Sr:Ca values represent habitat transition, a mean residence pe-riod of 60.7 d (n = 10, SD = 20.36, range = 24 to 97 d) was estimated for singleton Sr:Ca ratio values, each with a value greater than ±1 × 10– 3from the habitat transition
constant. The ‘time period’ of a singleton Sr:Ca value is proportional to its microprobe spot width (approximately 5 μm) relative to the otolith annulus transect length, which varies with growth rate, and the magnitude of the Sr:Ca value. The time period is greater for values further from the 4.0 × 10– 3reference line than for closer values
because of the greater slope of the line connecting adja-cent Sr:Ca values as it crosses the reference line. This method assumes that the otolith spot Sr:Ca ratio value represents a habitat residence transect length greater than just the spot width and includes, on average, half of the distance (10 μm) between adjacent spots. In practise, the spot width on the otolith exceeds 5 μm because of electron beam spreading, and there is little distance be-tween spots.
Otolith growth versus residence time
For inter-habitat migrant yellow eels, the proportion of eel residence time in freshwater typically exceeded the proportion of otolith (eel) growth in freshwater. The mean difference was 0.029 (95% CI = 0.015 to
0 20 40 60 80 100
Percent freshwater growth (Method 1)
0 20 40 60 80 100 Per cent fr eshwater gr owth (Method 2)
Fig. 2. Anguilla rostrata. Relation between the percentage of otolith growth in freshwater estimated by Method 1 and that by Method 2 for yellow American eels from the East River, Nova Scotia. The dashed lines represent proportions ± 5%
from the central 1:1 ratio solid line
–8 –6 –4 –2 0 2 4 6 8 Number of singleton Sr:Ca values A 0 20 40 60 80 100
Percent freshwater growth
–5 –4 –3 –2 –1 0 1 2 3 4 5
Mean number of singleton
Sr:Ca values
B
zx yx yx yx yx zx z z
3 3 5 5 7 5 7 22
Fig. 3. Anguilla rostrata. (A) Number of positive and negative (relative to the habitat transition criterion of 4.0 × 10– 3)
single-ton Sr:Ca values along an otolith transect in relation to the percent of growth in freshwater (%fwg; Method 1) for yellow American eels (each vertical line represents 1 eel; 46 of 57 eels had 1 or more singletons) from the East River, Nova Scotia. (B) Mean (± SE) number of positive and negative sin-gletons, centred in 10% fwg bins, in relation to %fwg. The number of eels contributing to each mean is given along the zero axis; negative means without a letter in common are
sig-nificantly different at α = 0.05
Table 2. Anguilla rostrata. Deviation and frequency of single-ton Sr:Ca values (n = 180) from the habitat transition criterion
(4.0 × 10– 3) Deviation (±×10– 3) Frequency (%) 0–0.49 39 0.5–0.99 22 1.0–1.49 21 1.50–1.99 11 ≥2.0 7
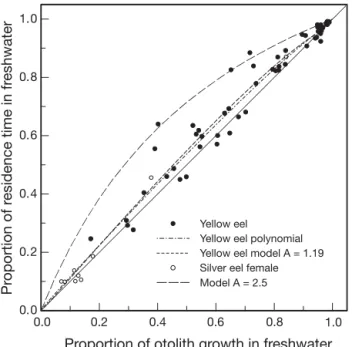
0.044, p < 0.0001) and the effect size measure, Hedge’s g, was g = 0.13 (95% CI = 0.08 to 0.18). The observed relation between otolith growth and habitat residence time changed non-linearly from small differences at low and high proportions of freshwater otolith growth to larger differences at intermediate proportions (Fig. 4). However, the quadratic term of a second-de-gree polynomial fitted to the yellow eel data (r2
adj =
0.94; adjusted for the number of independent vari-ables) was non-significant (n = 57, t = –1.171, p = 0.25, 95% CI = –0.468 to 0.123) and Mallows’ Cp= 3.4,
indi-cating that the polynomial model fitted the data in-significantly better than a linear model (Mallows 1973).
Habitat residence model
As the difference increased between growth rates in fresh- and saltwaters (increased A), so too did the dif-ference between the proportion of otolith growth in freshwater and the proportion of time resident in freshwater, particularly at intermediate proportions of freshwater otolith growth (Fig. 4). The habitat resi-dence model relating P (proportion of otolith growth) and f (proportion of habitat residence) in freshwater for yellow eels with A = 1.19 was almost coincident with
the quadratic polynomial curve fitted to the observed estimates of otolith P and f and was well within the 95% CI of the polynomial curve (not shown due to crowding in Fig. 4). The habitat model curves for male and female silver eels (A = 1.14 to 1.22) were also within the upper 95% CI of the polynomial curve for yellow eel observed data, indicating that the variability of the observed data is sufficient to encompass a mod-est range of A values for the habitat residence model.
DISCUSSION
Percent freshwater growth estimation
Estimates of the percentage of otolith (fish) growth in freshwater may vary significantly depending upon the method used, yet no standard method exists. Although statistically significant, the mean difference between Methods 1 and 2 was relatively low (2.2%) and may be of little biological or analytical consequence, depend-ing upon the requirements of any further use. One might, a priori, conclude that individual and mean dif-ferences of less than about 5% are of little conse-quence given the variability typical of biological sys-tems. Another approach is provided by the estimate of the effect size measure (Hedge’s g = 0.16), for which values < 0.2 are regarded as a small effect (Hedges & Olkin 1985, Cohen 1988) and perhaps of little biologi-cal significance. Thus, the differences between Meth-ods 1 and 2 may be minor, for most purposes, despite large differences for some individual fish. Although a single, accepted method for estimating the proportion of otolith growth in freshwater might be preferred, it is not clear which method would be most accurate.
Method 2 produced higher estimates of the percent-age of otolith growth in Anguilla rostrata in freshwater than did Method 1, because it ignored, for eels that entered freshwater as elvers, those cases where the measurement start occurred after the freshwater check and before the first pair of Sr:Ca values < 4.0 × 10– 3,
thus increasing the relative proportion of freshwater growth. The proportion of freshwater growth was altered in Method 2 by including singleton Sr:Ca val-ues > 4.0 × 10– 3or < 4.0 × 10– 3, with the net effect deter-mined by their relative numbers, while inclusion of the growth zone between the last annulus and the otolith edge increased the proportion of freshwater growth.
The causes and importance of singleton Sr:Ca values (see Fig. 1) are uncertain. If they are technical artefacts (see Kotake et al. 2003, Zimmerman & Nielsen 2003), then singletons are properly ignored when assessing habitat transition activities. In this case, smoothing of the transect data may assist the evaluation of trends. However, if large, off-trend singletons represent inter-0.0 0.2 0.4 0.6 0.8
Proportion of otolith growth in freshwater
0. 1.0 0 0.2 0.4 0.6 0.8 1.0 Pr oportion of r e sidence time in fr eshwater Yellow eel
Yellow eel polynomial Yellow eel model A = 1.19 Silver eel female Model A = 2.5
Fig. 4. Anguilla rostrata. Relation between the proportions (Method 1) of residence time (f ) and otolith growth (P ) in freshwater for yellow American eels from the East River, Nova Scotia. Plots are given for the polynomial regression fit-ted to the yellow eel data, for female silver eel data from Jes-sop et al. (2004), for the habitat residence model for the yellow eel data (A = 1.19), and for an illustrative case with A = 2.5. The central solid line represents the 1:1 ratio of A, the ratio of
habitat shifts, then ignoring them will underestimate the frequency of inter-habitat movement and time spent in another habitat. The degree of underestima-tion may be large given the substantial (39%) number of singleton Sr:Ca values ≥1 × 10– 3different from the habitat transition criterion and the moderate frequency of their occurrence in eels with an obvious history of inter-habitat migration. Excursions from freshwater to estuary (positive singletons) were not significantly more frequent for eels with high %fwg than for eels with intermediate %fwg, perhaps due to small sample sizes and high variability, or because, once in freshwa-ter, there is a lower biological motivation to make short-term excursions to the estuary relative to estuar-ine resident eels returning to freshwater, at least for eels with an intermediate history of %fwg. Inter-cohort competition, and resultant growth rates and survival among fishes are typically asymmetric, being influ-enced by factors such as fish size, individual fish phys-iology and behavioural aggressiveness, and local den-sity and habitat productivity (Ward et al. 2006). The significantly decreasing number of excursions from estuarine to freshwaters (negative singletons) with increasing %fwg suggests that eels with a high %fwg history migrate less frequently between habitats than do eels with an intermediate %fwg history. The larger number of singletons at intermediate %fwg values implies that singleton frequency is related to the degree of inter-habitat movement and may be an indi-cator of brief (up to several months), intra-seasonal, inter-habitat movements. Additional insight into the nature of large singleton Sr:Ca values and high Sr:Ca ratio values might be obtained by the comparison of similar otolith transects by the same or different analyt-ical methods and examination of strontium isotope ratios or other elements such as barium that also reflect environmental salinity (Kennedy et al. 2000, Elsdon & Gillanders 2004, 2005b, Milton & Chenery 2005).
Large-value singleton Sr:Ca microprobe spots repre-senting weeks or months of time during a growing sea-son of about 180 d (Jessop et al. 2006) could represent habitat changes. Environmental variability in Sr:Ca values requires about 20 d to become fully incorpo-rated into fish otoliths at growth-period temperatures, with greater changes in ambient Sr:Ca concentration reaching saturation more rapidly than lesser changes (Elsdon & Gillanders 2005a). Seasonal (spring, au-tumn) migrations of juvenile eels between river and estuary are well known (Smith & Saunders 1955, Med-cof 1969, Jessop et al. 2002). Freshwater Sr:Ca values of 1.9 × 10– 3to 2.5 × 10– 3(mmol mol–1) in the East River
are unlikely to have created difficulties in interpreting otolith Sr:Ca ratios because of their typical freshwater values, given partition coefficients <1:1 for Sr:Ca ratio incorporation into the otolith (Campana 1999, Bath et
al. 2000, Kraus & Secor 2004, Elsdon & Gillanders 2005b).
In addition to salinity, water temperature, water chemistry, fish size and exposure time may also influ-ence otolith Sr:Ca ratios (Kraus & Secor 2003, Elsdon & Gillanders 2004, 2005b, Martin et al. 2004). Ambient chemistry may dominate the effects of temperature and salinity (Elsdon & Gillanders 2004, Kraus & Secor 2004). Water chemistry is governed by freshwater ele-ment concentrations and the mixing curve with saltwa-ter, producing a direct relation between otolith Sr:Ca and ambient water Sr:Ca (Kraus & Secor 2004, Elsdon & Gillanders 2005b). Although lower estuarine water temperatures might reduce the effects of ambient Sr level (Elsdon & Gillanders 2004), Kraus & Secor (2004) estimated that the effect of freshwater–estuarine water chemistry variability was ~7-fold greater than the effect of a water temperature variation of 2°C. The relation between temperature and otolith Sr:Ca ratio appears negative below 10°C and positive above, with a response magnitude of about 0.1 mmol mol–1 in
otolith Sr:Ca for each 1°C of temperature change (Kraus & Secor 2004). No interaction has been found between salinity and water temperature for Japanese eels (Tzeng 1996, Kawakami et al. 1998), but it is unknown whether this applies to other anguillid spe-cies. Differences among species in the nature of their partition coefficients and fish size, perhaps due to dif-ferences in osmoregulatory ability with size, may also contribute to the variability in otolith Sr:Ca values (Zimmerman 2005). However, given a typically low freshwater Sr:Ca ratio, low seasonal discharge, a sea-sonal mean temperature differential between fresh-and estuarine waters of about 2 to 8°C and a rapid tran-sition between river and estuary (Jessop 2003), it may reasonably be concluded that otolith Sr:Ca patterns of juvenile American eels moving between the East River and its estuary will be more influenced by water chem-istry than by temperature.
Otolith growth versus residence time
For this data set, the proportion of eel otolith growth and proportion of residency in a habitat may be func-tionally equivalent. Thus, for inter-habitat migrant eels, Sr:Ca data usefully reflect the residence time in a given habitat as well as the growth in that habitat. Sta-tistical significance of the small (< 3%) difference between the mean proportion of otolith growth in a habitat and the proportion of residency in a habitat may be of little biological or analytical importance because of the small effect size measure (Hedge’s g = 0.13). However, the researcher’s judgement and study purpose are also considerations. The position (early,
mid, late) in the life history and duration of a habitat residence period may influence the difference be-tween the otolith growth period and the habitat resi-dence period because of the interaction of the decrease in growth rate with age and the variable growth rate in each habitat relative to the periods of residence in each habitat type.
Variability in growth and inter-habitat migratory his-tory may create differences between otolith growth and habitat residence period that are of concern for small numbers of eels, such as those near the dividing line between habitat residence categories. Where sam-ple sizes are moderate or large, shifts of a few fish from one category to another may make little difference to category means. Habitat categories should be based on broad rather than narrow salinity ranges, because of the high variability in otolith Sr:Ca ratios (Kraus & Secor 2003, Zimmerman 2005). The data (N = 107) of Jessop et al. (2006) were re-examined with percent freshwater habitat residence values estimated from the habitat model (A = 1.19), resulting in 1 eel in each of the 2 lower percent freshwater otolith growth period categories being moved into the next higher percent freshwater habitat residence period category, with no statistically significant change to any resultant conclu-sion. Similarly, of the 57 eels examined in this study, the number assigned to each %fwg habitat group did not differ significantly (χ2 = 0.58, df = 2, p = 0.75),
whether categorised by percent otolith growth or per-cent residence time, although 4 and 2 eels were moved from the middle (50 to 75% fwg) and lower (< 50% fwg) groups, respectively, to their next higher groups when based on residence time. Thus, otolith growth proportion was again found to be basically equivalent to habitat residency proportion. However, where the growth rate differences between habitats are much higher than those observed here, such as for American eels from Prince Edward Island (Lamson 2005), biolog-ically and analytbiolog-ically important differences may occur between otolith growth proportion and habitat resi-dency period. The close match of the habitat residence model with the observed data suggests that the model may be usefully applied to predict the relationship between otolith growth and habitat residence period for yellow and silver eels, with mean growth rates sim-ilar to those observed in this study, but it requires fur-ther verification for higher mean growth rates.
In summary, the small differences between 2 meth-ods of estimating the proportion of otolith growth in freshwater and estuarine/marine habitats were found to be of little practical effect. Similarly, small differ-ences in the proportion of otolith growth in a habitat and the duration of residence in that habitat permit the terms to be considered functionally equivalent, except perhaps where the difference between freshwater and
estuarine/marine growth rate is large. However, the approaches developed here may contribute to more accurate estimates of habitat residence period when otolith (fish) growth rates differ between habitats. Additionally, the importance of singleton Sr:Ca values as indicators of habitat transition remains to be deter-mined.
Acknowledgements. We thank the anonymous reviewer of a previous paper who suggested the model and prompted a more thorough analysis of the problem examined here. We also thank C. Harvie, E. Jefferson and K. Rutherford for assist-ing in the collection and processassist-ing of the eel samples, and D. Cairns for reviewing a draft manuscript. This study was, in part, financially supported by the National Science Council of the Republic of China (NSC 94-2313-B-002-070).
LITERATURE CITED
Bath GE, Thorrold SR, Jones CM, Campana SE, McLaren JW, Lam JWH (2000) Strontium and barium uptake in arago-nitic otoliths of marine fish. Geochim Cosmochim Acta 64: 1705–1714
Campana SE (1999) Chemistry and composition of fish oto-liths: pathways, mechanisms and applications. Mar Ecol Prog Ser 188:263–297
Cohen J (1988) Statistical power analysis for the behavioural sciences, 2nd edn. Erlbaum, Hillsdale
Daverat F, Tomas J, Lahaye M, Palmer M, Elie P (2005) Track-ing continental habitat shifts of eels usTrack-ing otolith Sr:Ca ratios: validation and application to the coastal, estuarine and riverine eels of the Gironde-Garonne-Dordogne watershed. Mar Freshw Res 56:619–627
Daverat F, Limburg KE, Thibault I, Shiao JC and 5 others (2006) Phenotypic plasticity of habitat use by three temperate eel species, Anguilla anguilla, A. japonica and A. rostrata. Mar Ecol Prog Ser 308:231–241
Dunlop WP, Cortina JM, Vaslow JB, Burke MJ (1996) Meta-analysis of experiments with matched groups or repeated measure designs. Psychol Methods 1:170–177
Elsdon TS, Gillanders BM (2004) Fish otolith chemistry influ-enced by exposure to multiple environmental variables. J Exp Mar Biol Ecol 313:269–284
Elsdon TS, Gillanders BM (2005a) Strontium incorporation into calcified structures: separating the effects of ambient water concentration and exposure time. Mar Ecol Prog Ser 285:233–243
Elsdon TS, Gillanders BM (2005b) Consistency of patterns between laboratory experiments and field collected fish in otolith chemistry: an example and applications for salinity reconstructions. Mar Freshw Res 56:609–617
Gross MR (1987) Evolution of diadromy in fishes. Am Fish Soc Symp 1:14–25
Hedges LV, Olkin I (1985) Statistical methods for meta-analysis. Academic Press, San Diego, CA
Jessop BM (2000) Estimates of population size and instream mortality rate of American eel elvers in a Nova Scotia river. Trans Am Fish Soc 129:514–526
Jessop BM (2003) Annual variability in the effects of water temperature, discharge, and tidal stage on the migration of American eel elvers from estuary to river. Am Fish Soc Symp 33:3–16
behaviour and habitat use by American eels Anguilla ros-trata as revealed by otolith microchemistry. Mar Ecol Prog Ser 233:217–229
Jessop BM, Shiao JC, Iizuka Y, Tzeng WN (2004) Variation in the annual growth, by sex and migration history, of silver American eels Anguilla rostrata. Mar Ecol Prog Ser 272: 231–244
Jessop BM, Shiao JC, Iizuka Y, Tzeng WN (2006) Migration of juvenile American eels Anguilla rostrata between fresh-water and estuary as revealed by otolith microchemistry. Mar Ecol Prog Ser 310:219–233
Johnson DH (1999) The insignificance of statistical signifi-cance testing. J Wildl Manage 63:763–772
Kawakami Y, Mochioka N, Morishita K, Tajima T, Nakagawa H, Toh H, Nakazono A (1998) Factors influencing otolith strontium/calcium ratios in Anguilla japonica elvers. Env-iron Biol Fish 52:299–303
Kennedy BP, Blum JD, Folt CL, Nislow KH (2000) Using natural strontium isotopic signatures as fish markers: methodology and application. Can J Fish Aquat Sci 57: 2280–2292
Kotake A, Arai T, Ozawa T, Nojima S, Miller MJ, Tsukamoto K (2003) Variation in migratory history of Japanese eels, Anguilla japonica, collected in coastal waters of the Amakusa Islands, Japan, inferred from otolith Sr/Ca ratios. Mar Biol 142:849–854
Kraus RT, Secor DH (2003) Response of otolith Sr:Ca ratio to a manipulated environment in young American eels. Am Fish Soc Symp 33:79–85
Kraus RT, Secor DH (2004) Incorporation of strontium into otoliths of an estuarine fish. J Exp Mar Biol Ecol 302: 85–106
Lamson HM (2005) Movement patterns and growth of Ameri-can eels (Anguilla rostrata) between salt and fresh water, based on otolith microchemistry. MS thesis, University of New Brunswick, Fredericton
Lamson HM, Shiao JC, Iizuka Y, Tzeng WN, Cairns DK (2006) Movement patterns of American eels (Anguilla rostrata) between salt- and freshwater in a coastal watershed, based on otolith microchemistry. Mar Biol 149:1567–1576, doi 10.1007/s00277–006–0308–2
Mallows CL (1973) Some comments on Cp. Technometrics 15:
661–667
Manley BFJ (1997) Randomization, bootstrap and Monte
Carlo methods in biology, 2nd edn. Chapman and Hall, London
Martin GB, Thorrold SR, Jones CM (2004) Temperature and salinity effects on strontium incorporation in otoliths of larval spot (Leiostomus xanthurus). Can J Fish Aquat Sci 61:34–42 McDowall RM (1987) The occurrence and distribution of
diadromy among fishes. Am Fish Soc Symp 1:1–13 Medcof JC (1969) Fishermen’s reports of freshwater and
salt-water migrations of Nova Scotia eels (Anguilla rostrata). Can Field-Nat 83:132–138
Michaud M, Dutil JD, Dodson JJ (1988) Determination of the age of young American eels, Anguilla rostrata, in fresh water, based on otolith surface area and microstructure. J Fish Biol 32:179–189
Milton DA, Chenery SR (2005) Movement patterns of barra-mundi Lates calcarifer, inferred from 87Sr/86Sr and Sr/Ca
ratios in otoliths, indicate non-participation in spawning. Mar Ecol Prog Ser 301:279–291
Morrison WE, Secor DH, Piccoli PM (2003) Estuarine habitat use by Hudson River American eels as determined by otolith strontium:calcium ratios. In: Dixon DA (ed) Biology, management and protection of catadromous eels. Am Fish Soc Symp 33:87–99
Smith WM, Saunders JW (1955) The American eel in certain fresh waters of the Maritime Provinces of Canada. J Fish Res Board Can 12:238–269
Tzeng WN (1996) Effects of salinity and ontogenetic move-ments on strontium:calcium ratios in the otoliths of Japan-ese eel Anguilla japonica Temminck and Schlegel. J Exp Mar Biol Ecol 199:111–122
Tzeng WN, Iizuka Y, Shiao JC, Yamada Y, Oka HP (2003) Identification and growth rates comparison of divergent migratory contingents of Japanese eel (Anguilla japonica). Aquaculture 216:77–86
Ward AJW, Webster MM, Hart PJB (2006) Intraspecific food competition in fishes. Fish Fish 7:231–261
Zimmerman CE (2005) Relationship of otolith strontium-to-calcium ratios and salinity: experimental validation for juvenile salmonids. Can J Fish Aquat Sci 62:88–97 Zimmerman CE, Nielsen RL (2003) Effect of analytical
condi-tions in wavelength dispersive electron microprobe analy-sis on the measurement of strontium-to-calcium (Sr/Ca) ratios in otoliths of anadromous salmonids. Fish Bull 101: 712–718
Editorial responsibility: Jon Hare (Contributing Editor), Narragansett, Rhode Island, USA
Submitted: February 17, 2006; Accepted: December 27, 2006 Proofs received from author(s): July 10, 2007