MICROCONTROLLER-BASED EGG
RECORDING SYSTEM
J.-K. JANG1, T.-S KUO1'2, AND M.-J SHIEH2
institute of Electrical Engineering and institute of Biomedical Engineering, National Taiwan University
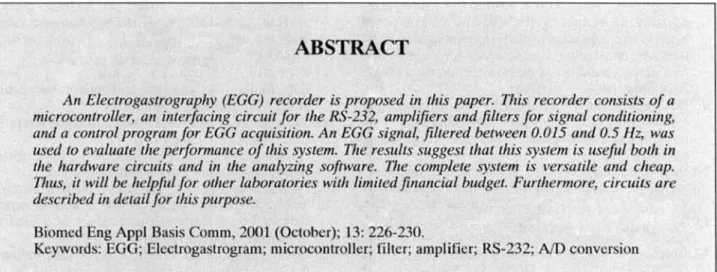
ABSTRACT
An Etectrogastrography (EGG) recorder is proposed in this paper. This recorder consists of a microcontroller, an interfacing circuit for the RS-232, amplifiers and fillers for signal conditioning, and a control program for EGG acquisition. An EGG signal, filtered between 0.015 and 0.5 Hz, was used to evaluate the performance of this system. The results suggest that this system is useful both in the hardware circuits and in the analyzing software. The complete system is versatile and cheap. Thus, it will be helpful for other laboratories with limited financial budget. Furthermore, circuits are described in detail for this purpose.
Biomed Eng Appl Basis Comm, 2001 (October); 13: 226-230.
Keywords: EGG; Electrogastrogram; microcontroller; filter; amplifier; RS-232; A/D conversion
1. INTRODUCTION
The electrical activity of the stomach recorded non-invasively by cutaneous electrode is reputed as Electrogastrogram (EGG). Basically gastric myoelec-trical activity has two components, Elecmyoelec-trical Control Activity (ECA) and Electrical Response Activity (ERA) [1]. Since the pioneer investigator Alvarez pub-lished his studies of EGG in 1922, scientists have made a great progress in recent two decades on EGG study. However, the low amplitude characteristic of EGG signal (about 50-500// V)[2] made it liable to be interfered by the motion of the heart, chest, diaphragm, and abdominal wall, etc. [3]. The relatively low S/N ratio of EGG led it unpractical on clinical use. There-fore, we tried to create new techniques to resolve this problem, and the essential first step is to create a new
Received: Aug. 15, 2001; accepted: Sep. 30, 2001. Correspondence: M.-J Shieh, M.D.
Institute of Biomedical Engineering and Department of Oncology, College of Medicine,
National Taiwan University, Taipei, Taiwan
E-mail: soloman(Sha.mc.ntu.edu.tw
EGG acquisition system.
Microcontroller was wildly used on biomedical signal recording [4-5]. The small size and low power consumption make it suitable for the battery power supplier. We used a new microcontroller that includes an embedded A/D converter to accomplish our new EGG acquisition system. It operated with the pream-plifier and the bandwidth adjustable Butterworth filters. All of the circuitries were packaged in a plastic case with adequate shielding for electrical safety. The EGG signal was transfered with the RS-232 stander interface for resisting interferences. The EGG signal was stored on the hard disk in digital type finally. Furthermore, we also accomplished the acquisition and analysis pro-grams for EGG preliminary analyzing.
2. METHOD
The complete system contains a 2-channel bed-side EGG recorder, the A/D conversion unit and its analysis software. EGG signals on surface of the upper abdomen were record with Ag/AgCl surface electrodes.
Figure 1 is the block diagram of the EGG re-corder. It consists of high precision amplifiers, an one-chip microcontroller and the circuit for interfacing with the RS-232 standard. After picking up by the
APPLICATIONS, BASIS & COMMUNICATIONS
Chi F* Amplifiers
& Filters
F*
Micro-controller
Ch2 ... I
F+ RS-232
PC
Fig. 1 Block diagram of the EGG recording system.
electrodes, the amplifiers increase the magnitude of the EGG signals and, at the same time, suppress noises by the filters built in. EGG signals were sampled by the on-chip A/D converter of the microcontroller. Then, the microcontroller transmits the digitized signals to the host PC via the RS-232 interface. Finally, the ac-quired waveform was displayed for inspection and stored onto hard disks for latter analysis. The EGG re-corder was battery powered for electrical safety. Moreover, all the circuitry was enclosed in a plastic case with adequate shielding.
2.1 Amplifiers and filters
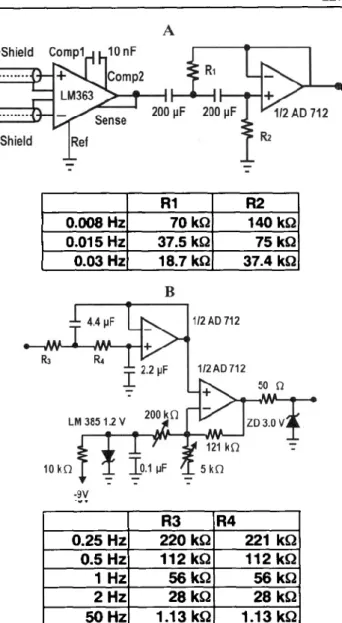
For flexibility in practical application, the gain and bandwidth of the amplifiers are variable. Figure 2 shows the circuit diagram of the amplifiers and filters. An instrumentation amplifier (LM363) was used to implement this amplifier with a gain of 10. The advan-tages of using this IC are: low cost, low power, high precision, low input bias current and high input imped-ance. These features make this chip suitable for han-dling the EGG signals, which have the magnitude of 50 to 500 µ V or so. The on-chip guard drive of the LM363 is used to eliminate noisy interferences, both from power lines and from capacitive coupling of the input leads. The bandwidth of the Butterworth filter is adjustable to eliminate high-frequency noise coming from ECG, EMG, and so on. To make use of the maximally scale of the A/D converter additional gain of 75 times was afforded by this circuit.
2.2 Digital circuit
The microcontroller PIC16C74A that contains a multi-channel A/D converter was used to digitize EGG signals. For simplicity, the A/D converter was pro-grammed in free-running mode of operation; that is, it scans and converses in a successive and continuous manner among different channels of inputs. Two channels of EGG signals were sampled. Because the voltage levels between the microcontroller and the RS-232 interface are different, a circuit should be designed to transfer the TTL signal (from the microcontroller) into the RS-232 compatible voltage (for the host com-puter). The circuit is shown in Figure 3.
2.3 Software design
Besides the acquisition program was implemented
A R1 R2 0.008 Hz 70 kQ 140 kQ 0.015 Hz 37.5 kQ 75 kQ 0.03 Hz 18.7 kQ 37.4 kQ B •9V R3 R4 0.25 Hz 220 kQ 221 kQ 0.5 Hz 112kg 112kQ 1 Hz 56kQ 56kg 2 Hz 28 kg 28 kg 50Hz 1 .13kg 1.13kc2 227
Fig. 2 Detailed circuit diagram of the amplifiers (A) and filters (B).
for user friendly, two analyzing packages were devel-oped for ease of use. One program displays the sam-pled data in time domain for visual inspection and thus, we can discard data with exceptional large artifacts. The other program analyzes data in frequency domain. It provides further digital filtering and the capability of running spectrum analysis. Techniques of Hamming windowing and zero padding were used in power spec-trum analysis. All the three programs were developed in the Labview environment for time saving, flexibility, and portability.
2.4 EGG measurement
EGG signals were recorded from a healthy volun-teer with no history of gastrointestinal diseases. He did not use tobacco, alcohol, and medication the week
-15-A
2.0 7 CH1 mV . 0 10 20 30 40 -2 0 _1.6-I -1.0-50 60 70 00 90 100 110 120 secB
PC _ HIN 232cp - 16c74AFig. 3 The TTL to RS-232 conversion circuit.
3cpm-Chl 12000 E1000 d 4 -CL 0 N 40 20 Time (min) 0 .3 0.4 0 Frequcy (Hz)
C
Fig. 4 Position of electrodes on the abdomen.
fore and during the study. The baseline fasting data and the postprandial response of the EGG were re-corded from the four electrodes on the abdomen after skin preparation. The Position of those electrodes is shown in Figure 4.
3. RESULTS
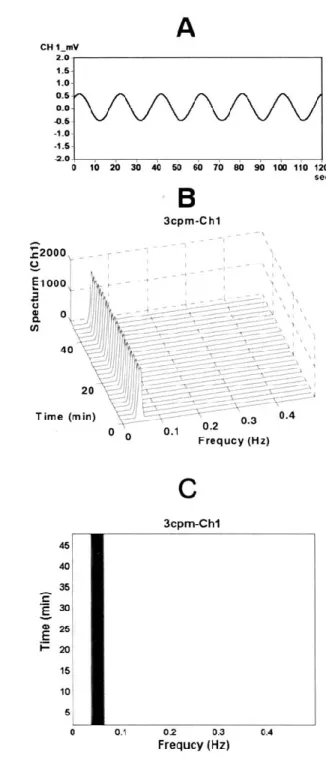
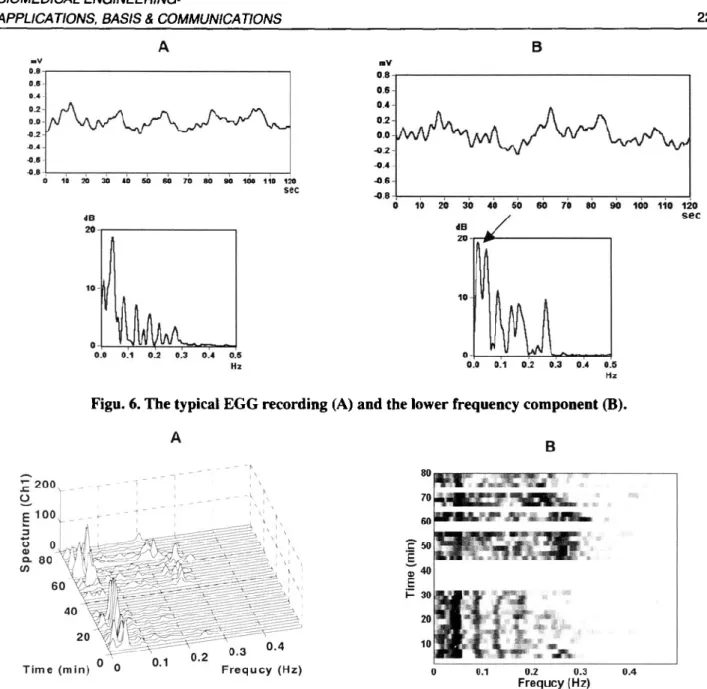
Figure 5 shows the results of a test. A 3 cpm sine wave was used to simulate the low frequency EGG. The low and high cutoff frequencies of the filters were set at 0.015 Hz (0.9 cpm) and 0.5 Hz (30 cpm), respec-tively. The sampling rate of the A/D converter was 5Hz. Two EGG recording from the health volunteer were shown in Figure 6. The upper part is the time domain waveform while the lower one is its frequency spectrum. The same data shown in Figure 7 processed with the method of running spectrum.
4. DISCUSSION
The cutaneous EGG from upper abdomen
repre-3cpm-Chl
0.1 02 0.3 OA Frequcy (Hz)
Fig. 5 A 3 cpm sine wave was used to test our
am-plifiers (filters) (A) and software programs (B, Q.
sents the electrical activity of the stomach. It is a non-invasive measurement and gains widespread accep-tance. In this paper, a microcontroller-based system was designed, which has the characters of low cost, high precision, and stability. Basing on this system, we can reliably measure, digitize, and analyze EGG sig-nals free from noises.
APPLICATIONS, BASIS & COMMUNICATIONS A 4e 20 M 0.0 0.1 02 0.3 0.4 0.0 Hz 1 229 30 40 50 00 Ti 00 00 100 110 120 m 0.0 0.1 02 0.3 0.4 0.0 HZ
Figu. 6. The typical EGG recording (A) and the lower frequency component (B).
A - -n 200 E 100 --- a---- - I i ` r m 0 0.1 m 10 B B 0.2 0.3 Frequcy (Hz) 0.4 sec
Fig. 7 Running spectrum analysis of the same data as in Figure 6 . The pseudo-3D plot (A) and a grayscale
plot (B). The gap is the exceptional contamination of recording that was discarded with the visual inspec-tion.
EGG recording. To decrease this effect, Ag/AgCI elec-trodes were used because of its low-noise charac-teristic [6]. Furthermore, visual inspection before data analysis was used to discard records with exceptional contamination [7]. To faithfully record the EGG, the corner frequency of the high-pass filter cannot be set too high. However, the recovery time of a large time-constant filter might be too long to be acceptable [8]. Therefore, the cutoff frequency is determined by tradeoff and set at 0.015 Hz.
The frequency component indicated by the arrow in Figure 6 does not seem to be bradygastria. Previous study suggested that this component is the disturbance
m 70 m Z 50 E m 40 E F- 30
of strong contraction [9]. From our data as shown in Figure 6, we cannot find any strong contraction relat-ing to the 3 cpm frequency. Further studies should be designed to address this problem.
REFERENCES
1. Smout A.J.P.M, Van Der Schee E.J., MSc,Grashuis J.L.: What is measured in electrogastrography?
Di-gestive diseases and sciences 1980 ; 25: 179-187.
2. M. Zhou, H. Zhang, R. Shaw, and F . S. Barnes:
Real-time Multi -channel computerized
-17-1236.
3. AJPM. Smout, HJA. Jebbink, M. Samson: Acquisi-tion and analysis of electrogastrographic data. Elec-trogastrography: Principle and Aplications, edited by Jiande Z. Chen, Raven Press, Ltd., New York,
1994; 3-30.
4. PJ. Bagwell and PH. Chappell: Real time micro-controller implementation of an adaptive myoelec-tric filter. Medical Engineering & Physics 1995; 17: 151-60.
5. Z. McCreesh, NE. Evans, and WG. Scanlon: Vagi-nal temperature sensing using UHF radio telemetry. Medical Engineering & Physics 1996; 18: 110-4. 6. Michael R. Neuman: Biopotential electrodes,
ed-1995; 227-287.
7. J. Chen, R. W. McCallum, and R. Richards: Fre-quency components of the electrogastrogram and their correlations with gastrointestinal contractions in humans. Med. & Biol. Eng. & Comput. 1993; 31: 60-57.
8. I. Daskalov, I. Christov, and V. Kolev: High-pass filtering of the electrogastrogram, Med. & Biol. Eng. & Comput. 1997; 35: 279-282.
9. J. Chen, P. Yeaton, and R. W. McCallum: Effect of erythromycin on gastric myoelectrical activity in normal human subjects. Am. J. Physiol. 1992, 263: G24-G28.